• Products
  • Community
  • Markets
  • Brokers
  • More
Get started
  • Markets
  • /Canada
  • /Stocks
  • /Ideas
Déjà vu.Hello old friend, it feels like we've been down this road before. "After exhaustive researches and investigations of the known sciences, I discovered that the Law of Vibration enabled me to accurately determine the exact points to which stocks or commodities should rise and fall within a given time. The working out of this law determines the cause and predicts the effect long before the Street is aware of either" -- W.D. Gann
TSX:BBLong
by AbsoluteRegard
Updated
Consolidation bottomNothing fancy just the bottom of the consolidation in Monthly chart
TSX:SPBLong
by curiousCoconut77509
1
Wallbridge Squeeze Continues After almost five years of falling, a decision is nearing for Wallbridge! I would be surprised if this continues within this channel into 2026. I would also not count out a reverse split if this does not go higher soon.
W
by CSGold1
3
Canopy Growth Corporation – High-Risk, High-Reward SpeculationThe stock of Canopy Growth Corporation experienced an unprecedented rally following its initial public offering (IPO). After a brief correction phase, the share price surged from CAD 0.25 to an all-time high of CAD 744.50 within four and a half years — an increase of over 244,000%. A sharp decline followed, interrupted by a temporary rebound that reached a new record high of CAD 766.80. This movement marked the beginning of a massive correction phase during which the stock dropped to CAD 1.09 —
TSX:WEEDLong
by PsychoAlien
4
NFG Just wait for more dipWill buy NFG @ 0.8 when it reached I'm Q3..... If reached will be good hunt for 2X Not Advise..... Just testing the idea
NLong
by B7r88
1
Surge Energy (SGY) Elliott Wave Outlook26/04/25 SGY Update I’ve been long Surge Energy since Jan 24. Price did move higher initially following my entry but has since ground lower in what looks like an ending diagonal pattern in red C of a larger ABC zig zag correction. There is RSI divergence on the weekly time frame which helps the case that SGY could be bottoming, but that will of course be effected by what the price of oil does. Any further downside on SGY I will be looking at the yellow zone which contains the 786 retracement a
TSX:SGYLong
by TheWaveCave
$NDA.V $NPPTF coiled up tight and looking bullishTSXV:NDA trading tight around moving averages and VWAP
TSXV:NDALong
by ChartStocks25
ATZ LONGATZ 2LL dip absorbed by buyers yet again. I am long on this name. Weekly gaps to be filled. Target is $45.
TSX:ATZLong
by WiseInvestorClub
Balancing act on Bear Creek on Corani news value surge40$ Silver comes next month At that price current production free cash flows enables to Finance their own development of the site 10% equity from our pockets does the same Let them have balance, let them realize The dream of 100$ per ounce The reality of a 100 million a year Silver mine in Peru by 2030
BLong
by develuse
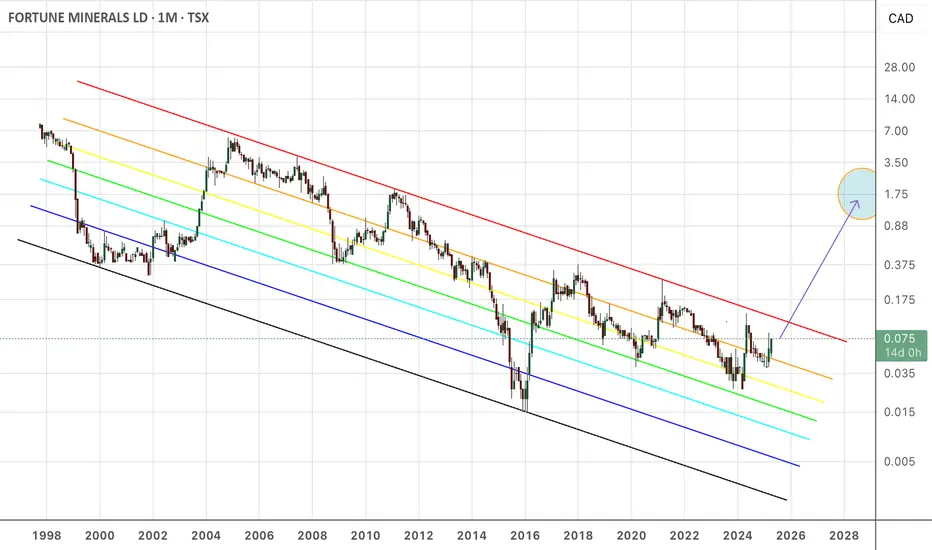
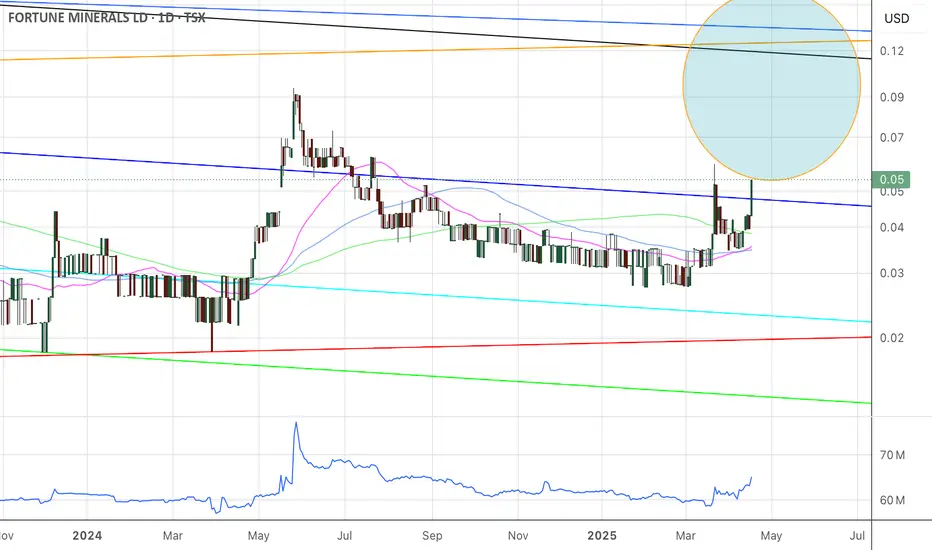
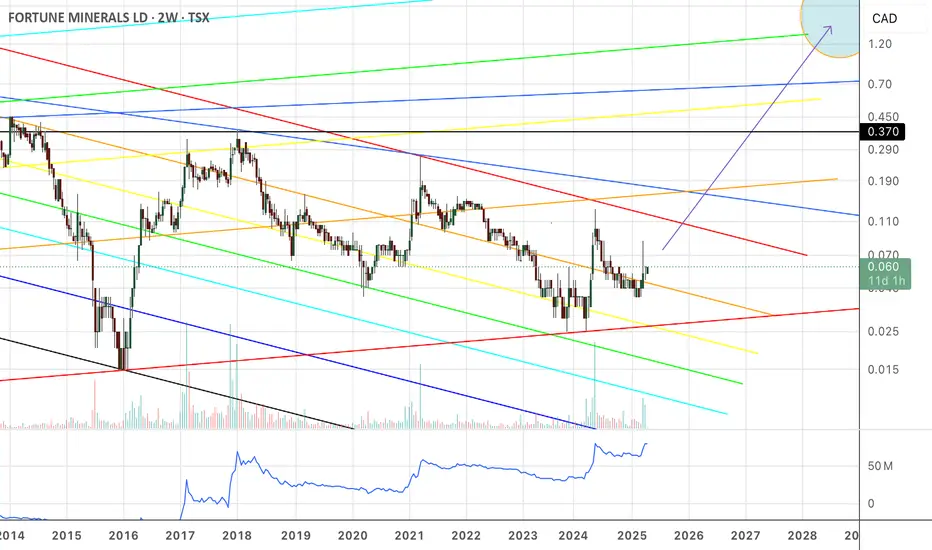
Fortune MineralsThere are multiple technical theories about why FT will break out. OBV is climbing, and I have postulated and proven that OBV is a leading indicator. Every other indicator is rear-ward looking. Looking out the back mirror. That includes moving averages. The price is spending too much time above the .786 “macro bear fib”, and this cannot stand. A breakout is inevitable. There, we have OBV pointing to a breakout, and we have the price near the 1-level bear fib. The only conclusion is a bre
TSX:FTLong
by Shammus01
Fortune MineralsFor those that love volatility like moths love flames, I present to you Fortune Minerals. If you know a more volatile stock, please let me know. I own well over 5M shares, and I’m basically flat in price, and long term. This party is just starting. I’ve been in and out of FT for 15 years. We’re about to witness the first real bullish pump, which prints a higher swing high, and it’s going to be glorious. I know I chart FT too much, but I have a quarter million dollar position, so can you bl
TSX:FTLong
by Shammus01
Are we there yet? My bags are fully packed. LFG!I have been waiting to long for this to break out. it feels like this is about to finally send over the next 8 months or so. Last chance to load up for this potential 10X My buy and sell zones are clearly marked. but what I have painfully learned is that price is less important than time. I don't care what the price is at the end of the year, whether that be way under my targets or not. -buy now -sell >75% in December. simple.
TSXV:GIIILong
by merchtank19
Pegasus is closing in on a major price decision!Pegasus is squeezing vs uranium sprot price. A break above the top (black) diagonal line would give this a lot of room to run.
P
by CSGold1
Fortune MineralsSchwab reports that the on balance volume (OBV) is going up in Fortune Minerals. You’ll never find a nicer tidbit from Schwab, because they prefer to not report on “penny stocks”, even though what is now a penny will soon be a dollar.
TSX:FTLong
by Shammus01
Canopy Growth: Some Room Left...WEED has continued to move downward within the magenta Target Zone between C$2.96 and C$0.90, and it is now trading in the lower quarter of this range. Currently, the stock should be working on a blue five-wave move and should soon reach the low of wave (v), thus completing this structure and also the large green wave . Primarily, we still grant the stock some more room to fully utilize the Target Zone, but a trend reversal should be initiated with the low. Afterward, the high from April 29, 20
TSX:WEED
by HKCM_Global
3
Livermore accumulation cylinderFew understand what is going on here. Let the volatility guide you. It won't be long until we see a triple. One of the most fundamentally strong junior producers out there.
TSX:APMLong
by DollarCostAverage
AC for you hangers or bottom feedersCritical Price Levels Updated Key Technical Points Current Price: C$13.96 Point of Control (POC): C$18.50 (Major volume node) Line in Sand: C$19.50 Support: C$12.80 Volume Profile Significance POC at C$18.50 shows highest traded volume Large visual spike confirms strong historical interest Only C$1.00 gap between POC and Line in Sand (C$18.50 → C$19.50) Validates our overall bullish thesis Enhanced Technical Framework Key Levels Hierarchy Line in Sand: C$19.50 (Ultimate resistance) POC: C$18.
TSX:AC
by Prober7314
1
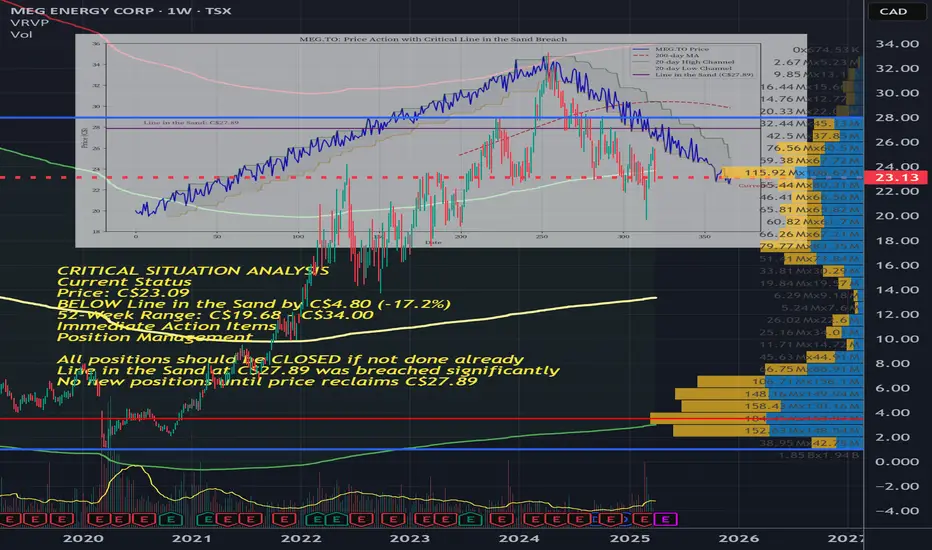
Uber Max Analysis using AI Monica backtestedMEG.TO Trading Methodology 🎯 1. The Line in the Sand (LITS) System Current LITS: C$27.89 Purpose: Acts as our binary decision maker Rule: Only trade bullish above, bearish/avoid below Current Status: Trading at C$23.09 (BELOW line by -17.2%) 2. Entry Criteria Must be ABOVE C$27.89 Volume confirmation required Prefer low IV environments (<30% IV Rank) Look for consolidation patterns or clear trend 3. Options Strategy Preferences ATM Strikes: Primary focus due to higher Vega Delta Target: Minimum
M
by Prober7314
NPI (northland power) longHey guys! This setup looks too good to be true. I just bought some spot shares because this weekly bullish divergence is huge and when it does play out, this 7% dividend stock will rally and be a great hold for long term investors. This RSI divergence shows momentum trying to change, long term holders buying from short sellers and panic sellers. Also we can clearly see 5 waves down from the top, totaling a 69%ish drop from ATH. In my opinion, there is a high likelihood that 16.16$ CAD is the b
TSX:NPILong
by cicatrace
Updated
Monica and I came up with this uses massive high end valuations The Strategic Edge: BAM.TO Technical Analysis Deep Dive Executive Summary Through rigorous analysis and backtesting, we've identified a remarkably reliable technical framework for trading BAM.TO (Brookfield Asset Management) that combines institutional-grade risk management with precise entry and exit points. The Strategic Framework 1. The "Line in the Sand" Methodology Our research has identified the 200-day Moving Average (currently at C$61.89) as the critical demarcation line between bull an
TSX:BAM
by Prober7314
Sierra Madre is in production and will ramp up quicklySierra Madre has is in production and will ramp up quickly Has 40% gold in their production Silver equivalent value.
TSXV:SMLong
by develuse
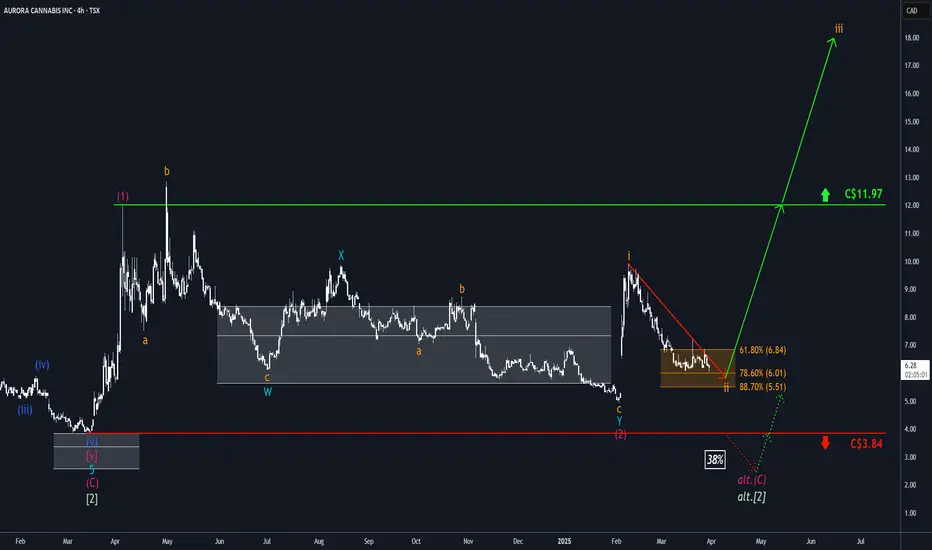
Aurora: Bottom FormationThe Aurora stock continues to trade within the orange Target Zone (coordinates: C$6.84 – C$5.51) and should soon reach the low of the ongoing wave ii in orange. With the completion of this corrective movement, the foundation should be set for a sustainable rise in the corresponding wave iii. However, there is still a 38% probability that the stock will head for a new low below the support level at C$3.84 in the green wave alt. .
TSX:ACB
by HKCM_Global
1
Fortune or misfortune?It’s absolute despondency for life’r bagholders, of which I include myself. But there are guys like Brian who are real lifer’s and they’re ready to commit herri karri. I say wait. Don’t put yourself in front of a train yet. Sell when you feel like a genius, and buy when others are despondently selling. What’s happening now is just low vol, not really going anywhere, and holding a somewhat elevated level as it consolidates momentary. What can happen next is six-sigma to the upside.
TSX:FT
by Shammus01
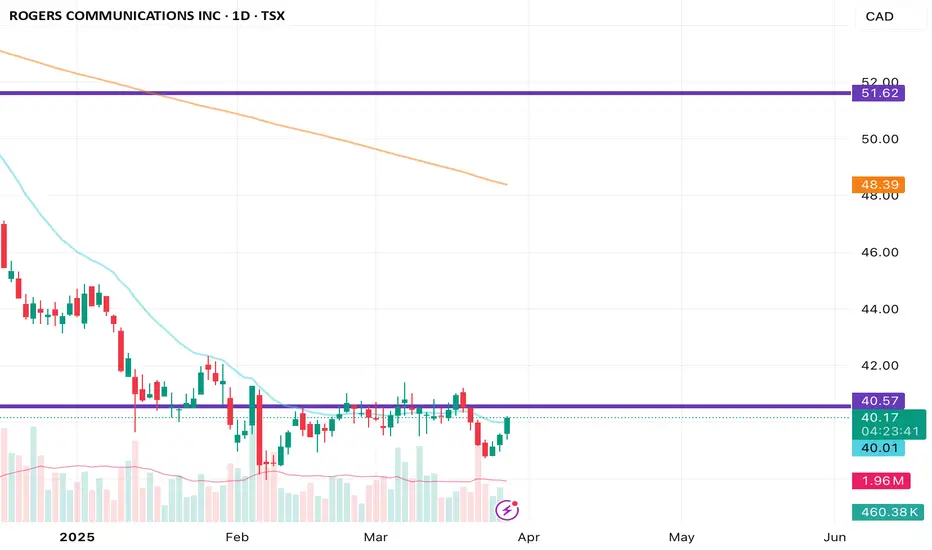
Rogers Long Daily Time frameBullish setup in the daily time frame Entry 40$ Target 50$ Stop loss 38$
TSX:RCI.BLong
by KingRuling
1
123456789101112131415161718192021222324252627282930313233343536373839404142
…999

Made by humans

Select market data provided by ICE Data Services. Select reference data provided by FactSet. Copyright © 2026 FactSet Research Systems Inc.Copyright © 2026, American Bankers Association. CUSIP Database provided by FactSet Research Systems Inc. All rights reserved. SEC filings and other documents provided by Quartr.© 2026 TradingView, Inc.

SOC 2 CompliantGDPR Compliant
More than a product
  • Supercharts
Screeners
  • Stocks
  • ETFs
  • Bonds
  • Crypto coins
  • CEX pairs
  • DEX pairs
  • Pine
Heatmaps
  • Stocks
  • ETFs
  • Crypto coins
Calendars
  • Economic
  • Earnings
  • Dividends
  • IPOs
More products
  • News Flow
  • Portfolios
  • Fundamental Graphs
  • Yield Curves
  • Options
  • Macro Maps
  • Pine Script®
  • MCP Server
Apps
  • Mobile
  • Desktop
Community
  • Social network
  • Wall of Love
  • Refer a friend
  • Creator program
  • House Rules
  • Moderators
Ideas
  • Trading
  • Education
  • Editors' picks
Pine Script
  • Indicators & strategies
  • Wizards
  • Freelancers
  • Marketplace
Tools & subscriptions
  • Features
  • Pricing
  • Market data
  • Gift plans
Trading
  • Overview
  • Brokers
  • Brokers comparison
  • The Leap
Special offers
  • CME Group futures
  • Eurex futures
  • US stocks bundle
About company
  • Who we are
  • Space mission
  • Blog
  • Help Center
  • Careers
  • Media kit
Merch
  • Tarot cards for traders
  • The C63 TradeTime
Policies & security
  • Terms of Use
  • Disclaimer
  • Privacy Policy
  • Cookies Policy
  • Accessibility Statement
  • Trust Center
  • Security tips
  • Bug Bounty program
  • Status page
Business solutions
  • Widgets
  • Charting libraries
  • Lightweight Charts™
  • Advanced Charts
  • Trading Platform
Growth opportunities
  • Advertising
  • Brokerage integration
  • Partner program
  • Education program
Community
  • Social network
  • Wall of Love
  • Refer a friend
  • Creator program
  • House Rules
  • Moderators
Ideas
  • Trading
  • Education
  • Editors' picks
Pine Script
  • Indicators & strategies
  • Wizards
  • Freelancers
  • Marketplace
Business solutions
  • Widgets
  • Charting libraries
  • Lightweight Charts™
  • Advanced Charts
  • Trading Platform
Growth opportunities
  • Advertising
  • Brokerage integration
  • Partner program
  • Education program
Look FirstLook First