Long
Long
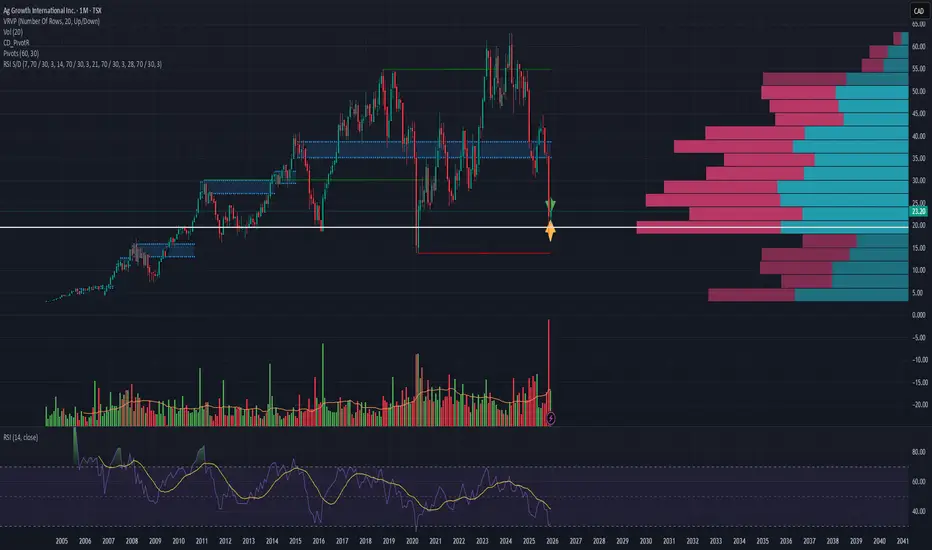
(AFN) Long-Term Setup | Price: $ 23→ Target: Around $ 40📈🔭 Long-Term Forecast – AFN
⏳ This is a long-term outlook for AFN, which is currently trading near its lowest price levels since 2010 🕰️.
🔻 Price History & Pullback
📉 The stock declined from approximately $60 ➝ $20, representing around -66 % drop 🔻.
⚠️ This decline coincided with two consecutive years of revenue stagnation (2024–2025), showing .
💼 Fundamental Growth (Long-Term View)
🚀 Revenue expanded from $137M in 2007➝ $1.4B,in 2024 representing a +922% total increase over the long run 📊.
⛔ However, in 2024–2025 🕰️, revenue fell ~8–10% 🔻, leading to a bearish market reaction 📉.
🔮 Forward forecasts point to a return to +10–12% growth 📈, offsetting prior losses and supporting a bullish long-term outlook 🐂📊.
🧱 Major Long-Term Support Zone
📅 On the monthly timeframe, the $15 – $20 range represents a strong historical support zone 🛡️.
⏱️ This zone has held for 15+ years (0% breakdown rate), reinforcing its structural importance.
📊 Volume Profile Confirmation
🔵 The highest historical traded volume (100% peak volume node) is concentrated in this price range.
✅ This suggests maximum historical participation, confirming the area as a high-probability pullback zone.
📉➡️📈 Momentum & RSI Shift
📍 Monthly RSI reached ~30 (oversold) and has now started turning upward ⤴️.
⚡ This transition often precedes a positive momentum shift (%) after extended consolidation.
🔄 Cyclical Behavior & Seasonality
🔁 AFN historically forms major peaks every 1–4 years.
📆 Seasonality shows January–March frequently deliver 3 consecutive positive months, often producing double-digit % gains 📈📈📈.
🎯 Price Targets (2026)
🎯 Base target: $35 – $45 → +75% to +125% upside from $20
🚀 Extended target: $60 (previous high) → +200% upside, possible by late 2026, assuming forecasted growth resumes.
✅🧠 Conclusion
⭐ This setup represents a high-quality long-term opportunity, supported by:
✔️ –66.7% historical correction already priced in
✔️ 0% growth period fully absorbed by the market
✔️ Around 1000 % long-term revenue expansion
✔️ Oversold momentum + heavy volume accumulation
⏱️ At current levels, the risk-to-reward strongly favors long-term positioning (%) 💎📈  Long
Long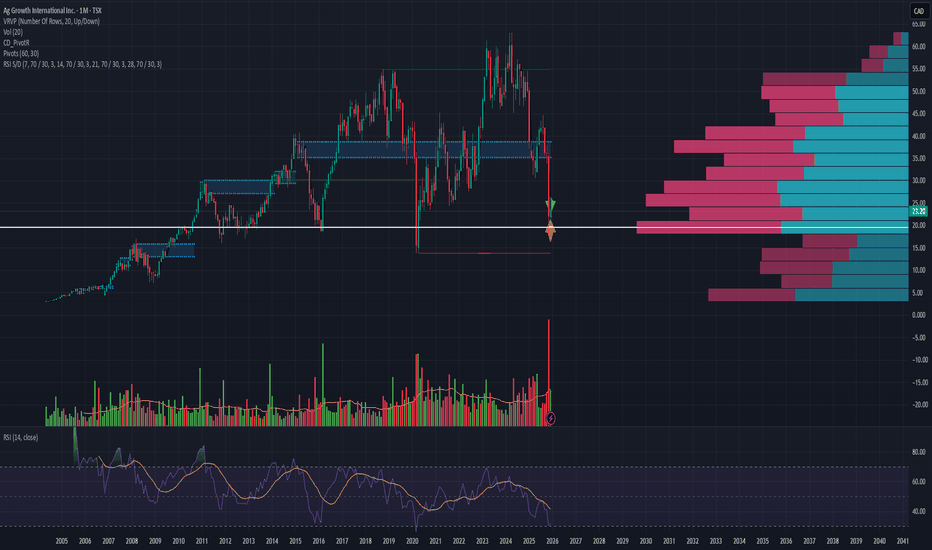
APGO - Following Silver’s Footsteps?Markets don’t move in isolation.
They rhyme… especially when capital rotates from the metal to the miners .
Over the past few months, Silver quietly broke out of a long-term accumulation range…
And once it did, price exploded higher with speed and conviction.🚀
Now zoom out on Apollo Silver TSXV:APGO and the structure looks uncomfortably familiar 👀
📊 Technical Analysis
After a brutal markdown phase that lasted more than a decade, APGO spent years building a clear accumulation base , following Silver’s broader long-term path.
That base is now being tested:
• The upper accumulation zone around $5.7 is acting as a key decision level
• Price is transitioning from accumulation into early markup behavior
• The structure mirrors Silver’s breakout phase almost step by step
Just like Silver:
– Long accumulation
– Clean breakout
– Brief consolidation
– Then acceleration
If APGO confirms breakout above the accumulation phase, the technical roadmap opens toward a full markup phase , with much higher levels coming into play.
This is no longer about catching bottoms; it’s about recognizing phase shifts.📉📈
🌍 Bigger Picture - Why Silver, Why Apollo?
Silver isn’t just a precious metal anymore; it’s a strategic industrial input.
Apollo Silver controls one of the largest undeveloped silver resources in the U.S., with over 125M ounces measured & indicated and 57M ounces inferred at the Calico project. 🗻
🥈Silver demand is accelerating across:
AI data centers, solar energy, 5G infrastructure, and defense systems, all while supply remains constrained.
On top of that, Apollo’s exposure to barite and zinc , both classified as critical minerals, adds optionality that most silver juniors simply don’t have.
In a world pushing for U.S. mineral independence, domestic silver assets are no longer optional… they’re strategic.🔎
📌 Bottom Line
Silver already made its move.
APGO looks like it’s next in line.
Structure is shifting.
Accumulation is behind us.
And if history rhymes, this could be the early stages of a much larger markup cycle.
⚠️ Always do your own research and speak with your financial advisor before investing.
Disclaimer: I have been paid $900 by CDMG, funded by Apollo Silver Corp., to disseminate this message.
📚 Stick to your trading plan, entry, risk management, and execution.
All strategies are good; if managed properly.
~ Richard Nasr  Long
Long
 Long
Long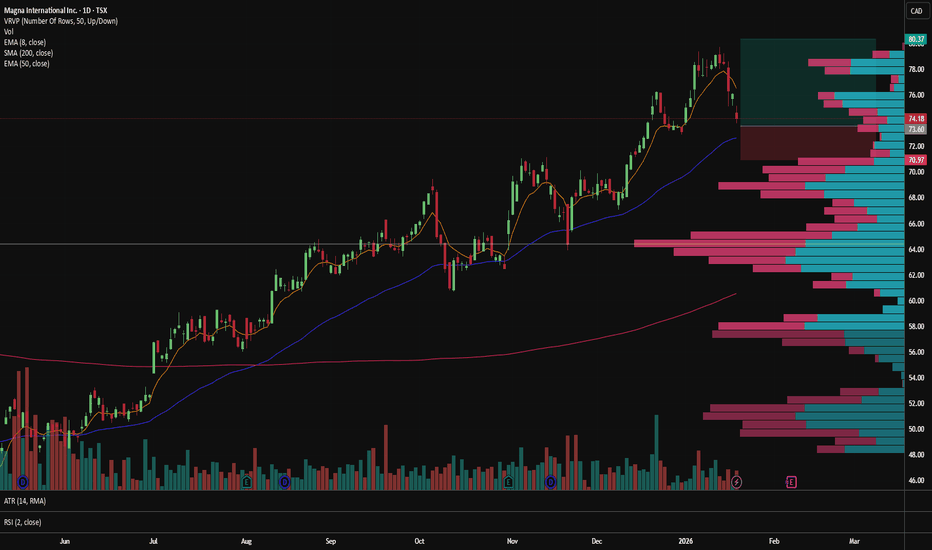
 Long
Long
URB (Canada) - Financial Sector Play Still Under $10Urbana Corporation has quietly put together a solid run over the last year, gaining about 60% . Originally starting out decades ago as a gold mining explorer, the company has evolved into a diversified investment vehicle managed by Caldwell Investment Management. They primarily focus on a mix of U.S. financial companies and Canadian resource stocks, but what makes them unique is their heavy hand in private equity. It’s a way for regular investors to get exposure to private businesses and specialized financial infrastructure that usually isn't accessible on public exchanges.
Fundamentally, the momentum has been driven by the strength of the financial sector and steady growth in their underlying net asset value. They recently declared another dividend, continuing a long streak of annual increases which shows a lot of stability in their cash flow. The sharp drop we see on the chart over the last week is largely due to the stock going ex-dividend on January 16th. It’s a mechanical price adjustment rather than a signal that something is wrong with the business.
Looking at the chart, the price has had a healthy 13% pullback and dipped back under the 20-day SMA (the green line) after that dividend release. The RSI has cooled off significantly, dropping from overbought levels in the 80's back down to a neutral 52 but shows signs of heading back up again. I do also like that it is still sub $10. Its been above that the last week and I always think a $10 stock has a better chance of doubling and going to $20 than a $100 stock has of going to $200. Round numbers like $10 once broken through often become the new base. Its a psychological thing.
Need to see if it starts to head back up again when the market opens, but odds would suggest it will. Could be one to watch.
=======================================
PLEASE NOTE: Nothing I post is trading advice. All investing involves risk, and past performance doesn’t predict future results. Trends can and do end. For 2026 , my goal is to try and post one new asset each day. Something outside the usual gold, silver, BTC, or big tech names. I like to find stocks worldwide showing steady trends with some good gains, a recent pullback, and signs of renewed strength. I don’t necessarily hold positions in these. They are simply companies I find interesting at the time of posting. I’ll often revisit them within a week to see how they went and share any updates. If you enjoy these posts, please BOOST and FOLLOW ME to discover more under-the-radar stocks and businesses from around the world.
======================================= Bausch Health Companies Inc. (BHC.TO) — Swing Trade Idea💰 BHC.TO — Swing Trade Idea
🏢 Bausch Health Companies Inc.
🏢 Company Snapshot
• Diversified specialty pharma focused on gastroenterology, aesthetics, and neurology
• Trade-relevant now due to stabilizing fundamentals + technical reset within a broader base after a multi-month range
📊 Fundamental Context (Trade-Relevant Only)
• Valuation: Depressed vs large-cap pharma peers; pricing reflects leverage risk but limited downside repricing at current levels
• Balance Sheet: High debt, but no near-term liquidity stress; refinancing risk pushed out
• Cash Flow: Stable, predictable cash generation supporting deleveraging narrative
• Dividend: None — neutral for swing context
Fundamental Read: Fundamentals are no longer deteriorating, removing downside pressure and allowing technicals to drive mean-reversion and trend continuation trades.
🪙 Industry & Sector Backdrop
• Short-Term (1–4 weeks): Healthcare showing defensive bid; rotation out of cyclicals supports stability
• Medium-Term (1–6 months): Neutral-to-slight underperformance vs TSX, but basing structure improving
• Macro Influence: Rates stabilizing → reduces pressure on leveraged balance sheets
Sector Bias: Neutral → Mildly Bullish
📐 Technical Structure (Primary Driver)
• Trend:
– Price holding above rising 50-SMA (~9.70)
– Still above 200-SMA (~8.70) → primary trend intact
• Momentum:
– RSI(2) reset into oversold territory and curling up
– RSI(14) mid-range → room to expand
• Pattern:
– Pullback within an emerging higher-low structure
– Prior breakout zone acting as support
• Volume:
– Recent selloff on sub-expansion volume → pullback, not distribution
Key Levels
• Support: 9.50 – 9.65 (50-SMA + prior range high)
• Resistance: 10.50 – 11.25 (recent swing highs / range top)
🎯 Trade Plan (Execution-Focused)
• Entry: 9.55 – 9.75
– Confluence of 50-SMA, prior resistance-turned-support, RSI(2) reset
• Stop: 9.15
– Clean loss of structure + below rising trend support
• Target: 11.20 – 11.30
– Range high / measured move from pullback depth
• Risk-to-Reward: ~2.6R
Alternate Scenario:
If price loses 9.50 on a closing basis, stand aside and reassess near 8.90 – 9.00 (range midpoint + 200-SMA proximity).
🧠 Swing Trader’s Bias
Price remains in a constructive higher-low structure above the 50-SMA, with momentum resetting rather than breaking down. Looking for a reaction entry at support to target the upper range for a >2R mean-reversion / trend-continuation swing. A decisive close below 9.15 invalidates the setup.  Long
Long
 Long
Long
 Long
Long
Emperor Metals; buy forget and retireThanks for viewing,
My title is a bit click baity, but man I was so happy when I discovered this stock. Was introduced to this by Rick Rule in his 'wrap up' videos from his July 2025 conference.
What I found was a small seemingly well-run Canadian company with a CAD24 million market cap and half of that was cash. So, a Company with a gold resource around 1.5 million gold ounces, two locations, and a well-drilled underground resource with a published Feasibility Study for just CAD12 million. Still a lot of work to do, but I figured that the smaller underground was around two years - maybe three - away from re-opening and producing using toll-treatment. The larger Duquesne West open pit / underground; all I know is that when it opens the open pit will be highly profitable and potentially much larger than current drilling indicates (which is about half a million ounces presently). They are expanding the open-pit resource by re-sampling already drilled core that was disregarded at the time. That is a VERY cheap way to add ounces.
If they open the smaller underground and run it at its permitted output level, it could easily produce around 45,000 ounces a year. So even before you consider opening production from Duquesne West, this Company is clearly worth many multiples more than present. The open-pit will be lower grade, but definitely profitable. All they need is a mill with contracted processing capacity around 1Mtpa and they can be adding 40,000 ounces plus to their annual production.
They got a very good deal on their mines and got the established gold resource for less than CAD10 per ounce in the ground. I like bargain hunters. The less they pay for a quality resource, the higher the up-side for investors.
So, a couple of days after discovering Emperor Metals I collected money from other mining investments that were in profit already (but I felt the remaining upside was limited; like Avino Silver and Gold and Matsa Resources) opened a new investment account because I couldn't invest in Canadian equities at the time. Learnt the new (quite frustrating new platform) waited for the withdrawals, wire transfers, and for the money to clear. Did I wait around for my limit order to be hit? No, I market executed as my money was cleared for purchases.
When you find a Company so unbelievably cheap how could I also then ask to get it at a much deeper discount? Lucky I didn't wait, because after today's trading my position is up 25% in a week. How high do I expect this to go? Well, you might think I'm crazy if I tell you. But, if they get both mines producing sometime in the next five years, I would expect it to go around 50x higher from my buy in price of $0.175 (this is also taking 50% share dilution into account). That is without gold being worth more then that it is now. With two mines producing they could easily be producing 80,000+ ounces a year, even without investing in their own processing plant (although after a couple of years of steady cashflow, it would make sense for them to buy or construct their own). It will not be a huge expensive exercise to get the tenements producing.
I'm sorry, I would have loved to publish this a week ago... but I need to finish buying in. My first purchase was 1 week ago, but I added another 65% Thursday last week. I have to buy in before I publish.
I send a couple of emails to the CEO and he replied which is also very important for me. I like to have responsive people who are looking to promote their Company. He didn't tell me anything specific, but he believed that the selling pressure was largely gone (I could see that from the chart). He sounds like a nice guy. Experienced. Endorsed by Rick Rule who also invests in Emperor helps.
My one fear is that this miner will be purchased by a larger miner and I might just get a 5 or 7 multiple return. But Canada has quite a lot of rules about takeovers and a stealth takeover is strictly illegal. Yes, I even researched Canadian Corporate takeover law before purchasing Emperor Metals lol.
I could be wrong or I could be right. The only way to know if to put my own cash at risk.  Long
Long
 Long
Long
 Long
Long
 Long
Long
 Long
Long
 Long
Long
Fancamp Exploration – Asset-Backed Spin-Out SetupFancamp has announced a strategic spin-out of all its core exploration assets into a new company, Goldera Exploration Ltd. Existing FNC shareholders will receive Goldera shares pro-rata, with no change to their Fancamp holdings.
The transaction will be completed via a court-approved plan of arrangement and is targeted for Spring 2026. No record date has been announced yet, meaning the spin-out window remains open pending the Information Circular.
Post spin-out, Fancamp becomes a cash-flow and royalty vehicle, holding:
>$20M in marketable securities (dividend-generating)
$34.5M secured note in Ontario’s Ring of Fire (~$2M annual interest)
A diversified royalty portfolio, including up to $40M in future production payments and titanium exposure
At current levels, cash and securities alone approach the company’s market cap, leaving the secured note, royalties, Ring of Fire leverage, and spin-out optionality largely unpriced.
This is not a typical junior explorer trade, but a balance-sheet-backed asymmetric setup with a clearly defined corporate catalyst ahead.
Not investment advice. Do your own due diligence.  Long
Long
 Long
Long
 Long
Long
 Long
Long
 Long
Long