P

 Long
Long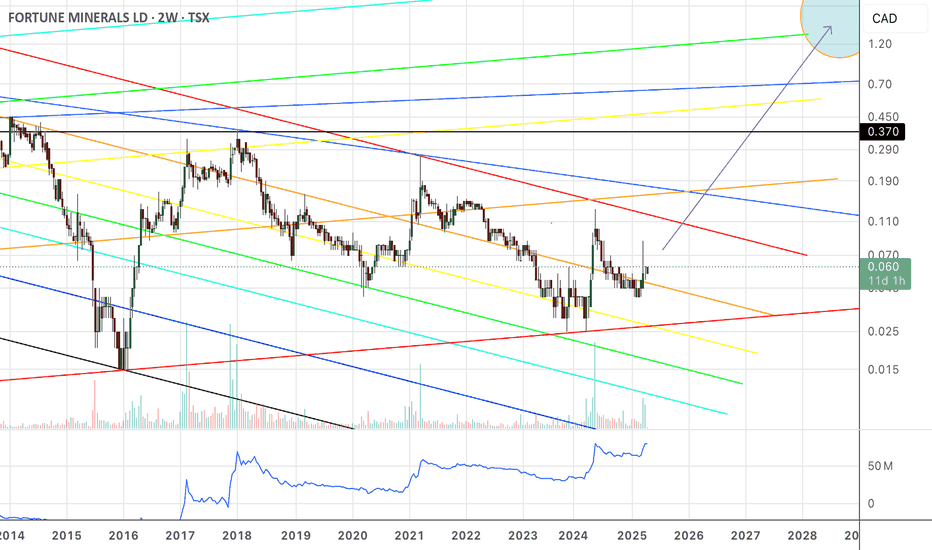
 Long
Long
 Long
Long
 Long
Long
 Long
Long
FT converted into USDHi y’all, I converted CAN to USD in the upper, right-hand corner. It puts us below the .236 Fibonacci level for my “projected” macro bull fib. I’m pretty good at this at this point. The level between 0 and .236 is a low volume, high risk, high reward zone. If and once the price overcomes the .236 bull fib, then a new bull run is confirmed, and volume enters. New money and bigger players enter above that US $0.10 to $0.15 zone. For stocks, and all else equal, if we break through the .236, then we expect to see a .618 test. This is just how it is in stocks, and in crypto I’m looking for the .786 fib.
Fat has a good history now, and there’s an all-time linear overhead that we’ve already cleared, and there’s a log overhead around $2, which the bears are not happy to see. A run for the log overhead is a fait accompli.
 Long
Long
 Long
Long
 Long
Long
R

 Long
Long
Fortune MineralsToday’s pump in FT has proven my point. My whole thesis relies on the nothing that after the price capitulation, the consolidation since then has been Adam and Eve. Now, this is proven right. Adam was the initial capitulation, and Eve is an inverse head and shoulder. I’ve been saying this, and you can go back and check my records. I own more than 5 million shares of ftmdf, at an average price of US $.055. So, the price went up and tested my average price paid today, before pulling back down. We will see where it ends the day and week, but what a relief to see my chart formation theory become fact. Almost all of my shares are in one term - held over one year. I’m looking for $2 FTMDF, which is just a revisit of the log overhead in FT - which is the only full history. A spike to $1USD puts me at well over five million US dollars, so let’s run this. Long 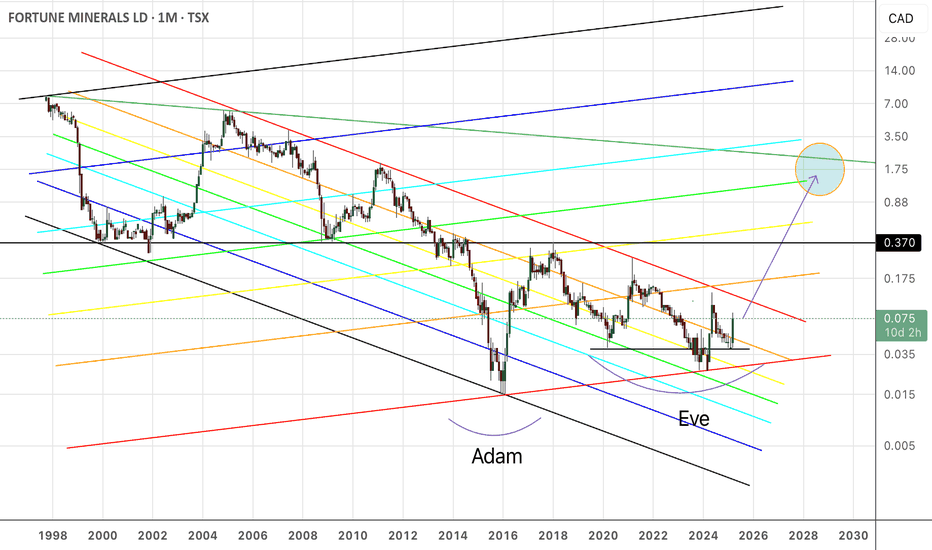
 Long
Long
Dolly varden Silver is on multiyear breakout targets identifiedHI everyone,
i have been mostly posting charts of crypto market but because of poor performance in feb and march, i am waiting for better chart to present itself before posting a chart.
I have been monitoring this dolly varden chart for months and taken an entry before as well but closed due to failed breakout.
Due to Gold and Silver good performance, i believe this chart look prime for breakout
As per chart, Dolly varden silver attempted 6 attempts to break resistance and last few times, it successfully broke but failed afterwards as can be seen on chart.
The current breakout attempt look legit and alligned with stronger silver. So i am anticipating a breakout this month and entry next month on the high of this month candle.
Keep in mind this is monthly chart and need few months to play out and i am anticipating a strong price appreciation in Quarter 2.
By looking at stochastic Rsi, it is also confirming the crossover which can result in trend build and strength apear later on.
On worst case, if this month candle is not strong and next month candle break the march low, i would be exiting.
Chart is pretty clear, 1st target would be 2.50 to 2.90 and if momentum sustain, we could hit 3.50
Best of luck trading with proper risk management.
Not financial advise just an technical observation of chart
Please like and subscribe for more analysis
 Long
Long