 LongLong
01 Quantum: The Binary Breakout01 Quantum Inc TSXV:ONE has recently surprised investors, revealing a 500% YoY revenue growth driven by quantum security and artificial intelligence solutions.
From a technical standpoint, price appears ready to abandon the accumulation range it has been in since 2014. A retest of the current $0.39 USD zone gives us the opportunity to target significantly higher prices. Projecting a simple extension of the range's height, we consider $6.61 USD per share a viable target.
Progress within the industry and the company's profitability will be key factors in this process.
 Long
Long
$ECORTSX:ECOR catalyst watch (H2 2026):
- Q2-26 trading update — imminent (late Jul). ±5% swing. April cobalt catch-up + Kestrel volumes → keeps Base/Bull alive
- Santo Domingo FID — H2-26. The big one, ±22% (skewed +17/−22), worth ~C$0.55/sh. Sanctioned → Base/Bull. Not proceeding → Bear
- H1-26 results — Sep-26. ±6%. Voisey's Bay volumes + net debt trajectory decide Base vs Bear
- Mantos Blancos Phase II study — H2-26. +7/−3%. +10ktpa Cu + tailings option → Bull
- Voisey's Bay full steady-state — H2-26. ±5%. Confirms the 500–560t cobalt run-rate → Base
- Phalaborwa DFS — 2026 into 1H27. ±4%. Royalty steps 0.85%→1.10% if no production by Jul-2028 → Bull/Blue
...Base worth C$3.34 against C$2.55; prob-weighted C$3.41 (+34%); 1-yr U/D 1.41×
...Breaking the ascending triangle would technically spell $3.40 so. yeah.
would rather some torque on the metals ECOR is exposed to over tech speculation in this market.
Royalties tend to compound better than producers. good starting point imo.
 Long
Long
atlas saltMajor de-risking milestone for Atlas Salt.
Export Development Canada (EDC) just issued a Letter of Interest to lead up to C$150M in senior debt financing for the Great Atlantic Salt Project.
That’s ~40% of their $350M–$400M debt target anchored by Canada's export credit agency.


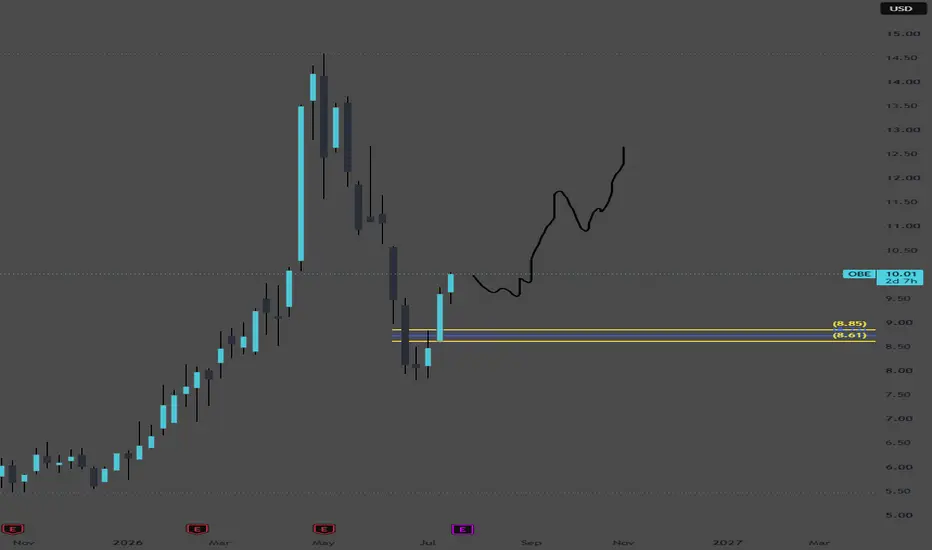
$OBE long thesis Bull Case
1. High operating leverage to oil prices
Every sustained increase in WTI oil prices significantly boosts cash flow.
Most operating costs are relatively fixed, so higher realized prices largely flow to the bottom line.
2. Attractive valuation
OBE has historically traded at lower EV/EBITDA and cash flow multiples than many North American E&P peers.
The market still discounts the company because of its past as Penn West Petroleum, despite a much healthier balance sheet today.
3. Improved balance sheet
Management has focused on debt reduction over the last several years.
Lower leverage reduces financial risk and gives flexibility for acquisitions or shareholder returns.
4. Production growth
Recent acquisitions, including the Belly River transaction, are expected to increase production and extend drilling inventory. Management has also increased production guidance following the acquisition.
5. Capital discipline
Unlike previous commodity cycles, management emphasizes:
returns on invested capital,
free cash flow generation,
disciplined capital spending,
maintaining financial flexibility.
Potential Catalysts
Higher oil prices.
Strong quarterly earnings.
Continued debt reduction.
Share buybacks.
Additional accretive acquisitions.
Reserve upgrades.
Improved analyst sentiment following successful integration of recent assets.
Key Risks
Oil price declines remain the largest risk.
Canadian pipeline constraints and differentials.
Cost inflation.
Integration risk from acquisitions.
Environmental and regulatory changes.
A global recession reducing energy demand.
Valuation Scenario
If WTI remains in the $70–80/bbl range:
Free cash flow could remain robust.
Debt can continue declining.
Investors may award a higher valuation multiple.
If WTI moves above $85/bbl, upside could be substantial due to operating leverage.
Conversely, if WTI falls below $60/bbl for an extended period, earnings and cash flow would likely compress significantly.
Overall View
The investment thesis rests on three pillars:
A stronger company than its historical reputation suggests.
An inexpensive valuation relative to cash-generating capability.
Significant upside from disciplined capital allocation and favorable commodity prices.
The primary downside is that OBE remains fundamentally an oil producer, making returns highly sensitive to crude prices. For investors who are constructive on medium-term oil fundamentals, OBE offers a relatively high-beta way to express that view.

(BRE) Fast Bounce Setup | Price:$ 5.38 Target:5.65TO 8(5TO48%)Sometimes, the market gives you a setup where you don't need to overcomplicate the analysis. Take a look at this chart! 📉👀
Here is the incredible fundamental reality: The company’s revenue is currently 10 TIMES higher than it was back in 2015. 💰📈 Yet, after a massive panic sell-off triggered by management's decision to reinvest dividends rather than cash them out, the stock is trading right back down near its absolute lowest Covid-19 era prices. 😷🛑
Targeting asset purchases right at these historic, rock-bottom support levels offers a phenomenal risk-to-reward setup. 🛡️ When you have explosive 10x top-line growth colliding with pandemic-level support prices, jumping on this tactical entry makes complete sense. 🔥💎 Let's see how this zone holds! 📊🎯
 Long
Long
birchcliff monthlyrick rule says its cheap but there is canadian political risk
ricks other canadian energy idea peyto got bought out for a premium by shell
he also like tourmaline oil


From green to red.... A real decision point has arrived for BEW. I'm watching intently to see what the market has decided. I have a lot of confidence in the names involved, the tech, the market...just waiting for the market to feel the same way. Down a bit at this point. Powder stacked. I'm bailing if if can't recover and will watch from the sidelines for signs of success


$IVN SetupEntry : CMP
TP1 : 29.51
TP2 : 35.11
TP3 : 41.81
SL : If you wish
⚠️ Financial Disclaimer:
This post is not financial advice. I am not your financial advisor, your life coach, or your legally responsible adult.
Always do your own research and never trade based solely on internet comedy.
 Long
Long
MTL Mullen Group - long.MTL Mullen group on the TSX
We have been accumulating this in the green box area.
Wanted a dividend equity.
Looked like decade lows. Even tho 2020 was lower. wasn't investing in 2020. oh well.
I think it's a well run outfit. imo
anyways was pleasantly surprised by these summer gains of 2026. unexpected.
 Long
Long
Another ascending triangle? With the double bounce off the horizontal resistance of 26.3, if the lower trend line holds we could see 32.
 Long
Long
Gold and Silver Price Prediction: Analyst Sees More DownsideGold and silver are both selling off hard today, and one chart strategist says the drop isn’t over yet. Gareth Soloway, chief market strategist at Verified Investing, says rising tensions in the Middle East are pushing the US dollar and interest rates higher, as oil prices climb. Higher oil tends to push inflation expectations up too, which lifts rates further. That combination is putting direct pressure on both metals.
Gold dropped 1.5% on the day, while silver also took a hit.
Gold’s Chart Is Flashing a Warning
Soloway points to a wedge pattern forming on gold’s chart, where price is getting squeezed between a descending resistance line and a rising support line. Each bounce off support has failed to reach the upper resistance trend line, a sign he says shows continued weakness. Gold recently bounced off support near $4,000, and that level is now back in focus.
Below that, Soloway is watching the $3,975 zone as the next line in the sand. A break there, he says, opens the door toward a deeper pullback.
Where Gold’s Correction Could End
Looking at past cycles, Soloway says gold fell 66% from its 1980 peak, then 46% during its 2011 top. Each cycle has produced a shallower drawdown than the one before, tied to rising government debt and ongoing quantitative easing.
Applying that pattern, he expects a roughly 30% to 37% drawdown from gold’s recent high this cycle, which would put the bear market low near the $3,500 level.
A Longer-Term Bull Case Beyond the Pullback
Despite the near-term weakness, Soloway remains bullish on gold’s next multi-year cycle. He said gold’s bear markets have shortened over time, from 30 years following the 1980 peak to 15 years after the 2011 peak. That pattern suggests the next cycle top could arrive within roughly five years.
Based on a model he’s built, Soloway projects gold’s next bull market high could land somewhere around $13,000, though he stresses this is a longer-term projection rather than a near-term target.
Silver’s Setup Looks Similar
Silver is forming what Soloway describes as a bear flag, having broken below key support levels before rejecting a retracement attempt. He’s watching the $58 level closely. A break below that could open a path toward $54, and potentially as low as $50 or $46 if selling accelerates further.
Silver has already dipped close to the $54 to $55 zone, near the upper end of his projected drawdown range, though Soloway says one more leg lower remains possible before a bottom fully forms. Once that downside plays out, he says a break above the descending resistance trend line would mark the start of a bigger move higher for silver.
 Short
Short
LGOLGO - with US DND contract and one of the lowest cost Vanadium producers + highest quality Vanadium mine in the world. this stock is positioned to rally to $5.64 for a test of resistance levels before the trend change to growth.
*** High volumes + strong fundamentals + improved revenue outlook + earned trust form government = strong case for a bull run
Cheers.
 Long
Long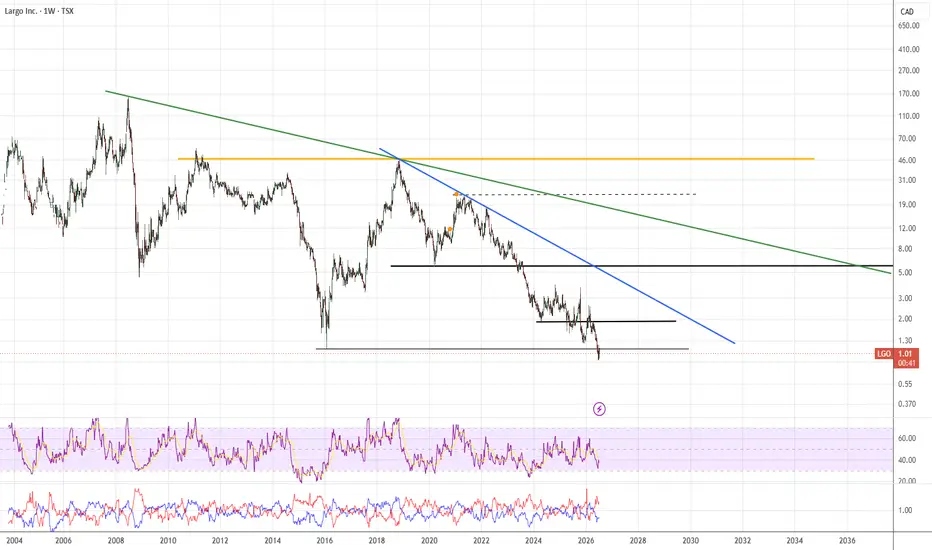
CP Breakout: Sniper Alpha Positioned Before the MoveCanadian Pacific Kansas City had been on Sniper Alpha’s radar for several days, and a position was established before the latest breakout expansion.
After reclaiming the 119.85 area, CP continued to improve its structure through a series of higher lows. Price then formed a tighter base beneath the breakout trigger near 127, creating a clear level for confirmation.
The latest move above the trigger suggests that the structure may be transitioning from consolidation into trend continuation.
Key Levels:
Breakout Trigger: Around 127
Structural Invalidation: 119.85
Current Bias: Bullish while the breakout holds and price remains above the invalidation level
This setup also connects with the broader strength in the Industrials sector previously discussed by Sniper Alpha through XLI.
The objective is not to chase one strong candle. The process is to identify sector strength, monitor improving structures, establish a position when the setup becomes valid, and manage risk through a clearly defined invalidation level.
Sniper Alpha currently holds a position in CP and will continue managing it by following the developing structure rather than using a fixed profit target.
For educational purposes only. Not financial advice.
 Long
Long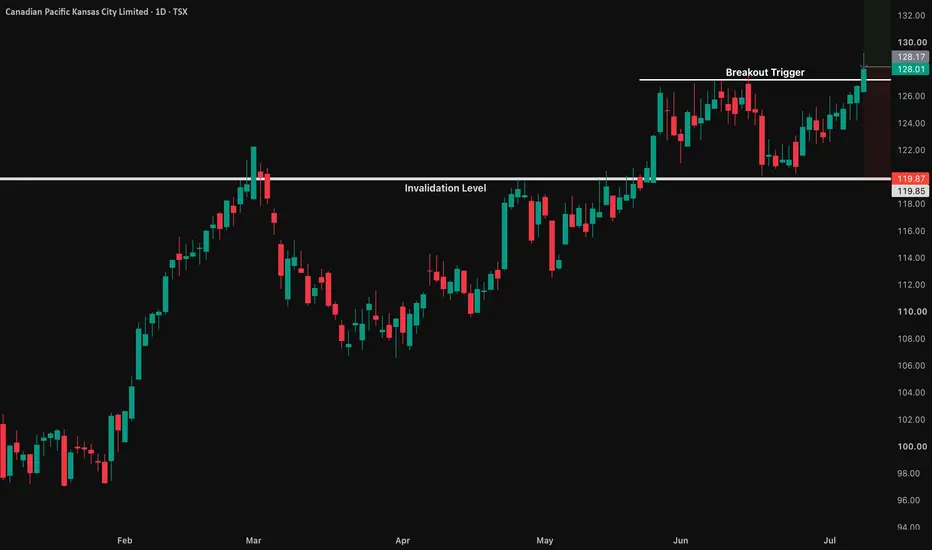
SVM / Silvercorp Metals — 3D Chart: Bullish Structure, Bearish
SVM has had a powerful breakout from its multi-year accumulation/base, but the current 3D structure is showing signs of a meaningful correction after a parabolic advance.
Price rejected from the upper extension region near 16.80–20.77 and is now pulling back into a key decision zone. The larger trend is still structurally bullish, but the short-term swing has turned bearish unless bulls defend support.
The most important level on this chart is the 11.40–11.50 zone.
This area lines up with the 1.0 Fib level, prior breakout structure, and the first major zone where bulls need to step in. If this level holds, SVM may simply be forming a higher-low before continuation. If it fails, the correction can extend much deeper.
Bullish Setup
A long setup becomes interesting if price holds above 11.40–11.50 and forms a strong reversal candle on the 3D chart.
Long Entry Ideas
Conservative long:
Wait for a confirmed 3D reversal candle above 11.40
Better confirmation if price reclaims 15.00
Reload zone:
10.18
9.48
8.40–8.90
If price comes into the 8.40–9.50 region and shows strong demand, that may offer the best risk/reward long setup.
Bullish Targets
15.00
16.80
20.77
A clean 3D close below 11.40 weakens the immediate bullish case and opens the door to a deeper correction.
Bearish Setup
A short setup becomes valid if SVM loses the 11.40 level on a 3D closing basis.
The current top structure resembles a broad distribution / failed continuation after a strong parabolic move. If support breaks, price may continue toward lower fib and prior breakout levels.
My Bias
SVM is not a clean buy here yet. The larger structure remains bullish, but the current 3D swing is bearish.
I would not chase longs in the middle of this pullback. I’d rather wait for either:
A confirmed hold/reversal above 11.40, or
A deeper pullback into 10.18–9.48 / 8.40–8.90 with demand, or
A clean reclaim of 15.00–16.80 for bullish confirmation
Not financial advice. Trade the levels, not the opinion.
 Short
Short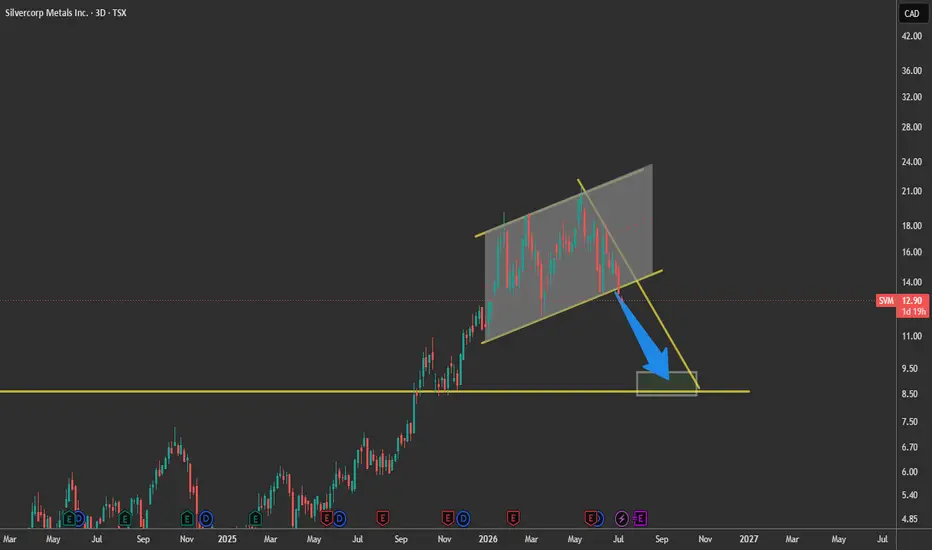
$OBE FFO Misses on Hedging Losses. Free Cash Flow Negative!Obsidian Energy had a remarkable run. 📈 Up 137% over the past year, the stock exploded from CAD $5.35 to a 52 week high of CAD $19.83 on the back of strong oil prices and production momentum. 🛢️
But the chart has now printed a textbook weekly supply zone and the fundamental picture is deteriorating fast. 📉 This is the short setup. 🔻
The Q1 2026 numbers tell the real story. ⚠️ Funds flow from operations came in at CAD $61.0 million, below what the market needed to see given the capital expenditure commitments. 💸 Free cash flow was negative at CAD $(20.4) million, with capital expenditures running at CAD $79.7 million against incoming cash. 📉
Net loss hit CAD $18.7 million, driven by realized and unrealized hedging losses that wiped out operating gains. 🔴 Net debt stands at CAD $279.8 million. Production of 28,733 boe/d came in below the prior year comparative period, largely due to the Pembina asset disposition. 🏭
The oil price assumption underpinning management guidance is conservative and potentially optimistic relative to where WTI is heading. 🛢️ Management guided full year 2026 using a WTI assumption of US$58 per barrel for H1 and US$62 per barrel for H2. At that pricing, full year FFO is only CAD $225 million with free cash flow of just CAD $7 million razor thin margin for a company spending CAD $190 million to CAD $230 million in capex. ⚡
If WTI softens further, free cash flow goes negative for the full year. 🔻
The stock has already begun fading from its highs. 📊 The month over month decline is already 16.38%. 📉 Insiders have been exercising options and selling at elevated prices. 💼 BMO Capital has a price target of CAD $19 and RBC Capital has CAD $18, but those targets were set during peak oil sentiment and the stock is already well below them. 🐻
The 52 week range sits between CAD $7.24 and CAD $19.83. Next earnings are due 30 July 2026. 📅
The weekly chart has printed a clean supply zone following the spike to CAD $19.83. ✅ The bounce into supply is the short entry. 🎯
🔴 Sell Zone ~ CAD $13.48 area (0.5 Fibonacci Weekly)
Weekly supply zone. Price has bounced from lows back into a level where sellers are expected to step in.
📉 Entry (Sell): CAD $13.48
🛑 Stop: CAD $13.88 (2.967% above entry)
🎯 Target: CAD $10.44 (22.6% downside from entry)
📈 Risk/Reward Ratio: 7.6
📅 Next Earnings: 30 July 2026
💸 Net Debt: CAD $279.8 million
🌍 52 Week Range: CAD $7.24 to CAD $19.83
🛢️ WTI Guidance Assumption: US$58 to US$62 per barrel
FFO missing. 📉 Free cash flow negative. 💸 Hedging losses mounting. 🔴 The weekly supply zone is the short entry. Let price come to the level and let the trade do the work. 🔻
⚠️ Not financial advice. Manage your risk.
Short
LONG $ANET - AI Company that Connects $NVDA GPUsI've started buying NYSE:ANET around this level.
One thing I've learned over the years is that when you're investing in a major trend like AI, it's worth looking beyond the companies making the headlines.
Everyone talks about NASDAQ:NVDA because they build the GPUs. But once those GPUs are installed, someone has to connect tens of thousands of them so they can work together efficiently. That's where Arista Networks comes in.
To me, Arista is one of the critical pieces of AI infrastructure.
As I've mentioned in my previous ideas, I'm building a long-term portfolio around robotics and automation. I believe companies like Arista deserve a place in that portfolio because robots, AI clusters, and autonomous systems all depend on fast, reliable communication. Without that network, none of these systems can perform at scale.
If I had to describe Arista in one sentence, it would be this:
Arista builds the nervous system of AI data centers.
Could this pull back from here? Absolutely.
The FOMC meeting is just around the corner, and the market will be paying close attention to the tone of the new Fed Chair. If the market reacts negatively, I wouldn't be surprised to see another pullback.
But that doesn't change my thesis.
I'll continue adding to my position as long as it stays within my planned risk. I'm not trying to pick the exact bottom. I'm simply accumulating a business I believe will play an important role in the next decade of AI.
Like I always said, just manage your risk on this one.
 Long
Long
Cronos Group , The Flag, the Flagpole, and a question - July 26SYMBOL: TSX:CRON | DIRECTION: LONG | TIMEFRAME: 23-Day
Published: July 2026
In 2019 Cronos Group was the future of medicine, the future of wellness, and the future of whatever else someone needed it to be that week to justify buying at $30. The stock had risen 14,285% from its 2016 low. A tobacco company invested $1.8 billion. The comments section smelled of ambition and something else entirely. Then the price did what all parabolas do. It corrected. Enthusiastically. For seven years.
What followed has been annotated on the chart with admirable restraint as “The Flag.” Cronos shareholders may have a different word for it. The flagpole, however, measures 14,285%. And the chart then poses the question “Do you know how to measure the glorious profit?” A rhetorical question. Although with cannabis stocks in 2019, nothing was rhetorical.
On the above 23-day chart, RSI is breaking out of a multi-year descending channel for the first time since the 2019 peak. Two observations:
1) RSI breakout. First since 2019. The RSI descending channel that has capped every rally since the peak has just been broken to the upside. On a 23-day chart, that takes time to develop. It has taken seven years. When the momentum structure of a correction this long finally breaks, it is not nothing.
2) Bull divergence Confirmed. signals are stacking at the base. Two Bullish divergence Confirmed prints, both , both at the floor, both arriving as RSI stages its first real recovery. Weak signals at a base are the beginning of the argument, not the conclusion. The RSI breakout is here. The flag structure is here. All three at once is not a coincidence. It is a checklist.
Targets
Not publishing one. The chart has already asked you the question. If you know how to measure a bull flag, you know what the flagpole implies. If you don’t, then don’t guess. Followers will get the answer!
The cannabis sector has spent seven years being comprehensively humiliated. The stocks are uninvestable. The promises were embarrassing. The business models were optimistic to the point of performance art. Nobody is long cannabis. Nobody wants to be seen long cannabis. In fact this idea will be the first published on tradingview after a 5 year nothing burger. It’s a stock nobody wants as RSI breaks a seven-year ceiling, sitting inside a pattern with a 14,285% flagpole. Sure, it’s cannabis. The chart doesn’t know that. As with investment, plant your seeds early before the crowd shows up looking for a taste.
Is it possible price drops further? Sure.
Is it probable? No way dude. Chill.
Ww
Type: Speculative long / educational | Timeframe: 12–36 months
===============================================
Disclaimer
This idea is for educational and informational purposes only. It is not financial advice. Cannabis sector stocks carry significant regulatory, operational and market risk. Always do your own research and consult a qualified financial adviser before making any investment decisions. Past performance is not indicative of future results.
 Long
Long
Almonty Industries (ALM) — Strategic Tungsten LeaderAlmonty Industries Inc. NASDAQ:ALM is a leading tungsten producer focused on high-grade mining assets, including the Sangdong Mine in South Korea and the producing Panasqueira Mine in Portugal. The company is becoming an increasingly important supplier of strategic minerals outside China.
Key Catalysts:
Critical minerals demand:
Tungsten is an essential material used across defense, semiconductors, aerospace, advanced manufacturing, industrial tooling, and next-generation technologies, positioning Almonty to benefit from long-term structural demand.
Sangdong Mine transformation:
With Sangdong returning to production after more than three decades, Almonty is establishing itself as one of the world's leading non-Chinese tungsten suppliers.
Global supply chain importance:
Following Phase 1 production and the planned Phase 2 expansion, Sangdong has the potential to supply approximately 40% of global tungsten demand outside China, strengthening Western critical mineral supply chains.
Diversified production portfolio:
Existing production from the Panasqueira Mine and future development opportunities at the Gentung / Browns Lake project in Montana provide additional growth and geographic diversification.
Geopolitical tailwinds:
Governments and industries are increasingly prioritizing critical mineral security, defense readiness, and supply chain diversification, creating a favorable long-term environment for strategic tungsten producers.
Investment Outlook:
Bullish above: $13.00–$14.00
Upside target: $33.00–$34.00
Supported by critical mineral demand, expanding production capacity, and strategic non-Chinese tungsten supply, Almonty is well positioned to benefit from the global reshaping of critical mineral supply chains.
📢 ALM — A strategic tungsten producer powering the future of defense, semiconductors, and advanced manufacturing.
 Long
Long
$SHOP: Two Locks Overhead. 172 First, Then 183TSX:SHOP has been quietly building something. Bullish RSI divergence at the May low near 130. Price made a lower low, RSI made a higher low. That was the warning. The bounce that followed wasn't random.
Since then it reclaimed the 20, 50 and 100 EMAs one by one. Now there are two locks overhead, not one. First the 200 EMA at 171.90, testing it right now. Then the upper line of the triangle near 183. That's the real breakout level. Between the two sits the March supply zone around 175 to 180.
RSI at 61, above its average, still room before overbought. Momentum is there. Step one is a clean daily close above 172. Step two is clearing 183 with volume. That's what confirms the triangle break, not before. First tests of the 200 from below usually fail, so no rush. Rejected here and it rebuilds around 158 to 165 (EMA100).
 Long
Long
BUY THE BREAKOUTUS military contracts only expand. This is just the beginning. A pullback may not materialize here, good entry on breakout and buy any dip. This is a game changer for this company.
Long
AYA - 5 months HEAD & SHOULDERS CONTINUATION══════════════════════════════
Since 2014, my markets approach is to spot
trading opportunities based solely on the
development of
CLASSICAL CHART PATTERNS
🤝Let’s learn and grow together 🤝
══════════════════════════════
Hello Traders ✌
After a careful consideration I came to the conclusion that:
- it is crucial to be quick in alerting you with all the opportunities I spot and often I don't post a good pattern because I don't have the opportunity to write down a proper didactical comment;
- since my parameters to identify a Classical Pattern and its scenario are very well defined, many of my comments were and would be redundant;
- the information that I think is important is very simple and can easily be understood just by looking at charts;
For these reasons and hoping to give you a better help, I decided to write comments only when something very specific or interesting shows up, otherwise all the information is shown on the chart.
Thank you all for your support
🔎🔎🔎 ALWAYS REMEMBER
"A pattern IS NOT a Pattern until the breakout is completed. Before that moment it is just a bunch of colorful candlesticks on a chart of your watchlist"
═════════════════════════════
⚠ DISCLAIMER ⚠
The content is The Art Of Charting's personal opinion and it is posted purely for educational purpose and therefore it must not be taken as a direct or indirect investing recommendations or advices. Any action taken upon these information is at your own risk.
Long
HIVE is a Hold
as we break this red line resistance which has been the trend resistance for the last few weeks of bullish movement... breaking this we easily test 7.06-7.86$ CDN then create 6.86-7.06 as new floor upon mediocre to good earnings. this is a stock you buy for growth into the end of the year if not longer.. depending on your situation.
not financial advice but honestly 10.80$ is in the cards on weeekly and daily. with big catalyst and volume when breaking structure.
 Long
Long