Bitcoin to new lows from here $42-54k next, $10-20k afterThe title of the chart isn't meant to trigger people. I already know what the comments will be "tHeRe's No waY we CoulD EveR See $10k."
Alright, well let me explain the thinking of what's happening and then explain things from a technical perspective.
I think what's happening in the crypto market
Where the world does markets
Join 100 million traders and investors taking the future into their own hands.
Get started for free$0 forever, no credit card needed

Supercharged
Supercharts

DXY: Major Support Test at 102 - Bullish Rebound Ahead?Executive Summary & Market Context
The U.S. Dollar Index (DXY) is currently exhibiting a crucial structural retest following a sustained medium-term recovery phase. Price action has pulled back directly into a high-confluence support zone near the 102.00 psychological handle and previous resistance
SILVER: Is This the Bottom We've Been Waiting For?Silver just bounced after weeks of heavy selling. And this time, the weekly chart is starting to tell a different story.
I think there's a good chance the weekly bottom is already in.
But before getting too bullish, there's one level buyers still need to break.
📊 WEEKLY: Did We Just See the Bott
Bitcoin's Four-Year Cycle: Is History About to Repeat?Bitcoin has gone through several major bull and bear markets, and there has always been one pattern that traders keep coming back to: the four-year cycle.
Every few years, Bitcoin goes through a strong rally, reaches a new high, and then enters a long correction. The timing has often been connected
H&S in a Falling Channel, Short Toward 7,000The S&P 500 (daily) is forming a potential Head & Shoulders inside a descending channel.
The ideal setup is a rally into the upper channel line at the right shoulder, followed by a confirmed false breakout (a push above the channel, then a close back inside). That would give a high-quality short en
MACRO LONG Nasdaq QQQ Stocks approachingIt looks like we are at the final phases of this bull market IMHO from an Elliott Wave perspective. That said, my analysis leads me to believe we likely have 1 more leg up.
I'm looking for a local consolidation in the near term, before one more move lower (wave 5) to complete a larger flat structur
Quick BITCOIN Daily update - Time to ask yourselves something.
The Question ?
Just how many more times are you going to go LONG or SHORT on a BITCOIN Leveraged Trade in the hope of Getting Rich quick and then LOOSE EVERYTHING ?
In the last 4 hours, we have seen $898.3 MILLION get REKT ( Data from COINGLASS ) and I can assure you, that agood amount of that w
Flexsteel ($FLXS): bought back about 24% of sharesFlexsteel Industries, of Dubuque, Iowa, is one of the largest manufacturers, importers and marketers of residential furniture products in the United States. Almost all of its sales are Flexsteel branded seating and casegoods, and it is exiting its Homestyles ready-to-assemble line.
On 26 October th
$SPCX: STILL BEARISH, BUT I'M WAITING FOR THE RIGHT SETUPI've been watching NASDAQ:SPCX lately, and the 1H chart is still showing weakness.
At 123.48, price is trading below all three major moving averages, with the 1H, 4H, and daily trends aligned to the downside. RSI is at 24.18, and MACD remains negative.
The bearish setup looks more favorable for
Stocks Are Soaring After the Midterms. Why Is AI Missing Out?Wall Street celebrates a… Democratic sweep?
Wall Street rallied after Democrats won control of both chambers of Congress in Tuesday's US midterm elections , but the celebration didn't extend to every corner of the market.
The Dow Jones surged more than 1,500 points , or 3%, on Wednesday, while
See all editors' picks ideas
Confluence Profile█ OVERVIEW
Confluence Profile is a tool for finding places where several independent technical factors point to a similar price level. It does not give buy or sell signals. Instead, it shows where Fibonacci levels, Order Blocks, Fair Value Gaps and volume nodes cluster on the chart, and how many of
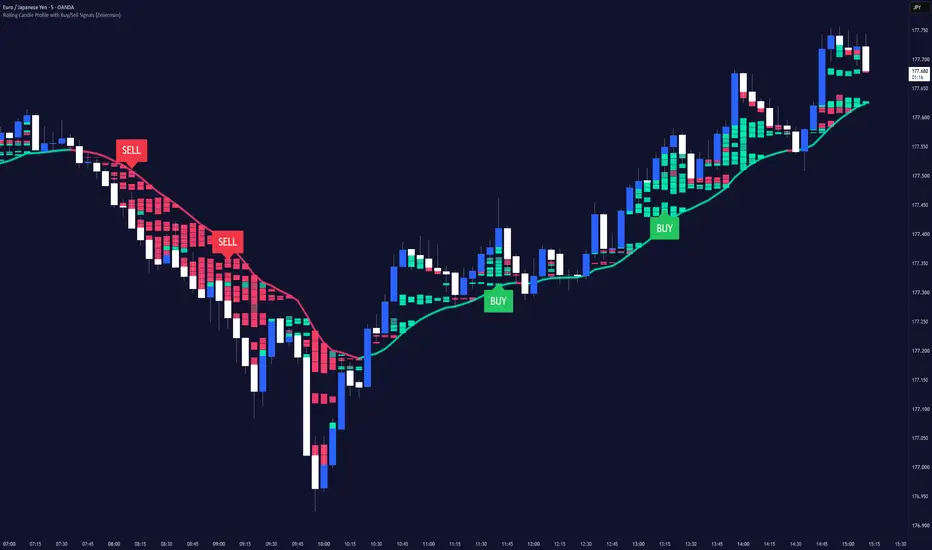
Rolling Candle Profile with Buy/Sell Signals (Zeiierman)█ Overview
Rolling Candle Profile with Buy/Sell Signals (Zeiierman) is a dynamic price-pressure indicator that visualizes buying and selling dominance, directional pressure concentrations, and weak-pressure regions directly on the chart.
The indicator constructs a 12-layer Rolling Pressure Prof
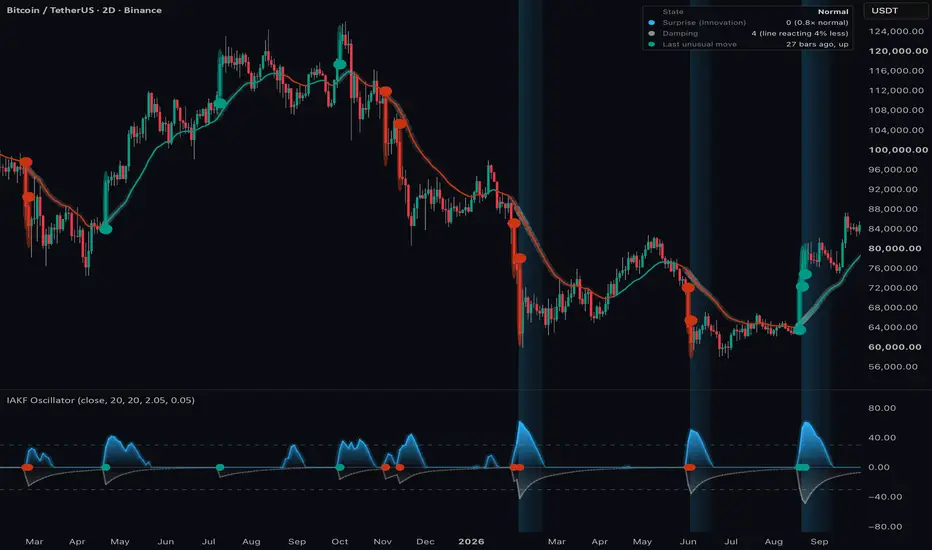
Innovation Adaptive Kalman Filter Oscillator█ OVERVIEW
The Innovation Adaptive Kalman Filter (IAKF) is a modern implementation of the Kalman filter that uses its own prediction errors to detect abnormal measurements and adapt its measurement-noise estimate.
This indicator is an oscillator that adapts recent research in GPS and inertial nav
Market Matrix (Zeiierman)█ Overview
Market Matrix (Zeiierman) is a multi-timeframe market analysis dashboard that brings together price structure, trend, momentum, and market strength into six compact indicator panels.
Instead of switching between multiple indicators and timeframes, Market Matrix displays higher-timefr
RedK Indicator Amplifier (RedK i-Amp)🟩 What is RedK i-Amp?
-------------------------------
RedK i-Amp is not an indicator in itself - it's a "wrapper" utility that "amplifies" another "source" indicator by improving its visual and alerting capabilities.
RedK i-Amp hooks to another indicator's plot and enables the addition of the fol
TASC 2026.10 A Low-Risk ETF-Trading Strategy█ OVERVIEW
This script implements concepts from a short-term ETF investment strategy outlined by Markos Katsanos in the article "Selecting Strong ETFs While Avoiding Sharp Overbought Reversals" from the October 2026 edition of TASC Traders' Tips . The strategy analyzes Katsanos' custom relative s
Buyers & Sellers Profile + Dynamic S/R (Zeiierman)█ Overview
Buyers & Sellers Profile + Dynamic S/R (Zeiierman) is a volume-profile and market-structure indicator designed to combine a large rolling Buyers/Sellers Volume Profile with dynamically generated support and resistance levels.
Instead of treating the volume profile and swing structure
Vol-Control Fund PositioningThe investors who sell because nothing happened
In 2017 the American stock market was so calm that a whole class of institutional portfolios held more equities than their own capital, simply because the rules they follow told them to. Reconstructed with the model behind this indicator, their estim
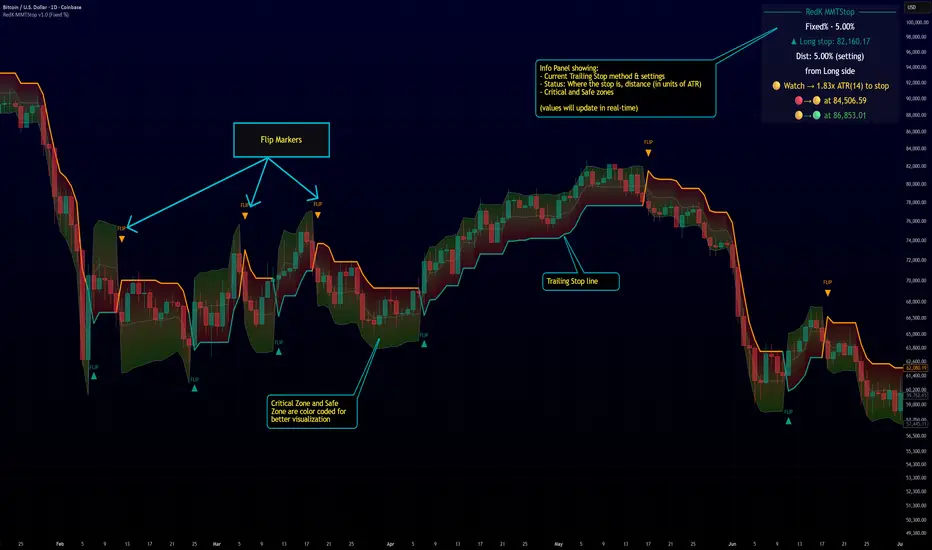
RedK Multi-Modal TrailingStop (RedK MMTStop)█ RedK MMTStop - Release Notes
Introduction & background
RedK MMTStop is a Multi-Modal Trailing Stop indicator - Let's quickly explore the "trailing stop" concept first as a refresher - then explain what a multi-modal trailing stop indicator does.
A "Trailing Stop" is what helps traders avoi
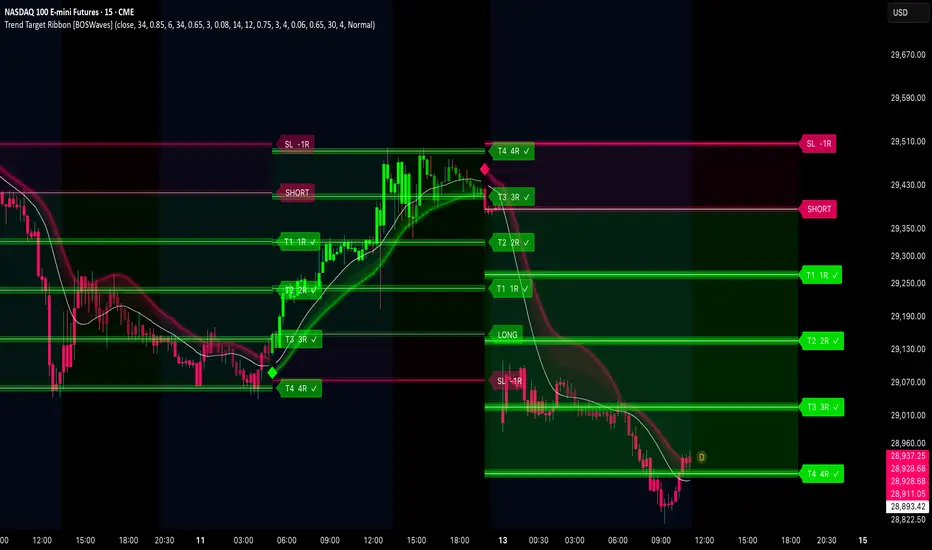
Trend Target Ribbon [BOSWaves]Trend Target Ribbon - ALMA Conviction Trend Detection with Integrated Structure-Based Position Planning and R-Multiple Target Tracking
Overview
Trend Target Ribbon is an ALMA-based trend identification system that combines slope-normalized momentum confirmation with standard deviation band
See all indicators and strategies
Community trends
NVDA: Rising Wedge Breakdown, Is $150 the Next Target?After months of sustained gains, NVDA is showing clear signs of weakness. On the weekly (W1) chart, price has broken below the lower boundary of a Rising Wedge pattern , falling to around $186.64. This breakdown signals growing selling pressure and puts the long-standing bullish structure at risk.
Deep dive analysis on HOOD viewers requests!In this video I walk you through my levels of support and resistance and what I make of the recent price action. As always folks if you found this helpful I would appreciate you folks to boost like and leave a comment. I'm interested on your thoughts on this chart! If you have levels feel free to s
HOOD: Can the $73–$77 Support Zone Hold?Following a request from a TradingView community member, here’s my daily chart analysis of Robinhood Markets (NASDAQ: HOOD).
HOOD closed at $80.91, up 3.21%, after the previous session’s sell-off reached the $73–$77 support zone. That area served as a consolidation base in May. Buyers have responde
Here’s Why Karman Holdings (KRMN) Climbed 42%Karman Holdings shares soared 42.13% on Friday, closing at $45.61 apiece, after the space and defense company reported a 174% jump in third-quarter profits and received bullish ratings from Needham and Piper Sandler.
In an updated report, Karman Holdings said net income grew to $21 million in the t
Data Infrastructure is the Next AI MonopolyAs the market continues to debate whether algorithmic software, proprietary foundation models, or hyperscale cloud providers will capture the ultimate value in artificial intelligence, a structural reality is emerging on the ground: compute capacity and power-dense data center real estate are the ul
KEEL | WeeklyNASDAQ:KEEL — HIEQ Model
TQ Analysis | Trend Reversal!? 📈
KEEL rose 13.33% today, closing the week at the TS Ray 1 confluence.
With the retracement approaching the 0.66 Fibonacci level, the recent low ➤ $ 1.61 may be recognized as the origin point of the projected advance in Primary Wave ⓹.
I
NVIDIA: Will the 1W MA100 hold or drop even lower ($145)?NVIDIA turned almost oversold on its 1D technical outlook (RSI = 31.305, MACD = -8.193, ADX = 28.876) after dropping by almost -10% yesterday. On the long term 1W outlook it is on solid sell levels (RSI = 39.992) as it crossed below its 1D MA50 and is approaching the 1W MA100 which has been untouche
CENX - Strong Fundamentals Meet Major Technical Supportentury Aluminum is testing a significant demand zone following a 53% correction from its $70.43 high.
Q3 fundamentals remain strong:
Revenue: $961.2M (+27.8% QoQ)
Net income: $302.6M
Adjusted EBITDA: $331.6M
Cash: $713M
Q4 EBITDA guidance: $275M–$300M
Technically, price is approaching the 0.6
Nvidia 50% GAAP income cut = earnings crashNvidia is below upwards trend
with an entire portfolio of crashing equities
Last quarter 24% of its GAAP profits were paper gains on equities
Now these equities are down >$25bn
This will nearly cut their GAAP income by 50%
GAAP loss is what dragged google down 20%
Nvidia earnings in 10 days expect
TESLA 1-year Channel Down targeting $260 next.Tesla (TSLA) has been trading within a 1-year Channel Down and following Monday's High (Lower High of the pattern), it got rejected below the 1W MA50 (blue trend-line) again, initiating the new Bearish Leg.
The previous two made Lower Low bottoms on their respective 1.382 Fibonacci extensions. The
See all stocks ideas
Community trends
BTCUSD 1H | Bearish Momentum Signals Further DownsideCRYPTO:BTCUSD
BTCUSD continues to demonstrate a bearish market structure on the 1-hour timeframe, with sellers maintaining control following repeated rejections from important resistance levels.
The market previously experienced a strong decline after reaching the major resistance region around $8
400-Day MA Fakeout—Final C Wave Ahead?Bitcoin breaks below the 400-day moving average, rallies back to retest it, briefly pushes above it, and then loses the level again. In the previous examples shown, that failed reclaim preceded another major leg down.
My thesis is that we’re seeing this setup repeat, with the next decline potential
COULD RENEWED MIDDLE EAST CONFLICT SEND BITCOIN STRAIGHT TO $75kBITCOIN: WHAT THE CHART IS TELLING US
Bitcoin continues to struggle against several important resistance zones, and repeated rejections are showing that buyers are losing strength. With geopolitical uncertainty growing and concerns surrounding the reported Binance security incident, I believe BTC
Bitcoin's Four-Year Cycle: Is History About to Repeat?Bitcoin has gone through several major bull and bear markets, and there has always been one pattern that traders keep coming back to: the four-year cycle.
Every few years, Bitcoin goes through a strong rally, reaches a new high, and then enters a long correction. The timing has often been connected
BTCUSDT – Triangle Breakdown: Bearish Liquidity Target🔹 BTCUSDT is showing signs of bearish weakness after consolidating inside a large symmetrical triangle pattern. Price has slipped below the rising support trendline, suggesting a potential bearish breakout and a shift in short-term market structure. The recent price action around $76,000 reflects se
BTCUSDTHello Traders! 👋
What are your thoughts on Bitcoin ?
Bitcoin continues to trade within a well-defined descending channel, with the overall technical structure still favoring sellers.
Price has now reached the lower boundary of the descending channel, which coincides with the important support zon
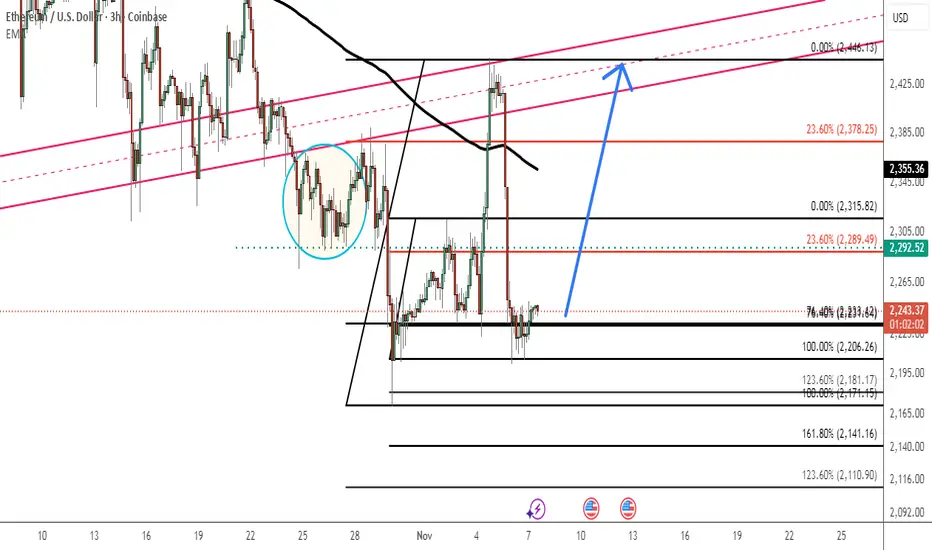
ETHUSDT: Returns to 2,200 — Another Recovery Taking Shape?ETH is testing a familiar support area after a sharp rejection from the 2,420–2,440 resistance zone, where the previous rally lost momentum.
On the 1H chart, price has returned to 2,180–2,230, a zone that previously attracted buyers. The recent selling pressure has been significant, but the market
ETH updateCurrent technical signals suggest that ETH is in a "short-term rebound, medium-term still bearish" phase. Without effectively breaking above the $2,488–$2,546 resistance zone, it is too early to confirm a bullish trend. A more prudent technical confirmation would be: price stabilizes above $2,300
BTCUSD Bullish Reversal from Key Support BTCUSD is currently trading near a major support zone around 74,900–75,200 after a strong bearish move from the 80,500 resistance area. Price is showing signs of stabilization, with the possibility of a bullish recovery from this demand zone.
If buyers successfully defend the current support and bu
Bitcoin - The uptrend is still holding!👑Bitcoin ( CRYPTO:BTCUSD ) is still heading for new highs:
🔎Analysis summary:
After witnessing a quite volatile swingtrading week, Bitcoin is not dropping lower at all. Together with the recent retest of a confluence of support, this shows some major buying pressure. After the next resistance b
See all crypto ideas
XAUUSD - BEARISH WEDGE BREAKDOWN🥇
Gold is trending within a 🔺 long-term descending wedge, currently testing its lower boundary after multiple rejections of the upper resistance line. The price action shows clear structural decay, marked by lower highs and a failed reclaim of the horizontal flip zone at 4,100.
The 🧭 bearish bias
gold’s trendline breakout — are bulls gearing up for a $4,230Gold is showing encouraging signs of a bullish recovery on the 4-hour timeframe after a strong rebound from the $3,880 demand zone. The recent upward movement has broken the descending trendline, suggesting that the previous bearish structure is losing strength and buyers are gradually regaining con
XAUUSD H4: Breakout or Bull Trap? Gold's Next Big MoveGold has finally stepped outside its descending channel, but the real test is only beginning.
After weeks of lower highs and lower lows, XAUUSD found buyers around the 3,870–3,900 order block and recovered sharply toward 4,145. Price has since pulled back to approximately 4,070, placing the market
XAUUSD | At A Decision Point Between Continuation And RejectionGold is currently trading at a key technical area where both bullish and bearish scenarios remain valid.
Following a recent bullish CHoCH and multiple BOS confirmations, buyers have managed to defend the demand zone and reclaim part of the previous decline. However, price is now approaching an impo
Gold 1H: Resistance Sweep and Short Setup AnalysisHello everyone , I am sharing my current perspective on the gold 1 hour chart where I am looking for a potential short position setup based on how price is interacting with key structural levels and liquidity pools.
Instead of jumping into trades blindly, I like to break down the chart step by step
Payroll Strength Meets H1 ResistanceMarket Context
Friday’s U.S. payrolls showed a resilient labor market, with October nonfarm payrolls rising 165K and unemployment easing to 4.1%. The stronger data lifted the USD and Treasury yields while increasing expectations for another December Fed hike.
Market Impact
This macro repricing limi
XAUUSD | Bullish Recovery Structure BuildingGold is showing signs of stabilization after reacting strongly from the invalidation zone and reclaiming short-term support. The recent price action suggests that sellers are losing momentum while buyers attempt to establish a higher base above the key demand area.
The highlighted entry zone repres
XAUUSD H1: Five Waves Up—Is the Correction Finished?Gold has bounced, but buyers still have something to prove.
The H1 chart shows a labelled five-wave advance into the 4,140–4,150 area, followed by a sharp correction. Price is now recovering toward 4,082, where the next reaction could help distinguish a sustainable recovery from another corrective
XAUUSD: Is Gold Preparing a Major Bullish Reversal?
Gold is approaching a critical long-term decision point after a powerful multi-year rally and a substantial correction. With price trading near the 4,078 Fibonacci reference, could the next major recovery eventually challenge 4,694 and reopen the path toward 5,200?
The potential is visible. The st
XAUUSD — Long-Term Bearish Structure: Is 2,600 Next?
Gold remains under long-term bearish pressure after failing to sustain its recovery from the previous decline. From Kelly’s view, XAUUSD is still moving inside a major descending channel, suggesting that the broader Elliott Wave correction may not be over.
The key idea is simple: as long as gold
See all futures ideas
EURUSD | Bullish Trendline and Potential Market Reversal
EURUSD is currently trading around 1.11790 after experiencing a short-term bearish correction from the recent highs. Despite this downward movement, the broader chart structure shows an established bullish trend, with price approaching an important demand area where buyers may become active.
The m
GBPUSD 30M | Bearish Structure ShiftFX_IDC:GBPUSD
GBPUSD is currently displaying strong bearish momentum on the 30-minute timeframe following a significant rejection from the major resistance zone around 1.3495–1.3503. After previously establishing bullish momentum and reaching higher price levels, the market failed to maintain its
EURJPY – Bullish Rebound Setup | Key Support and Upside Targets
EURJPY is trading around 176.558 on the 2-hour chart, approaching a strong support zone near 176.200. After a sharp bearish correction from the 178.400 resistance level, price is showing potential for a bullish recovery.
If buyers successfully defend the 176.200 support zone, EURJPY could move tow
DeGRAM | GBPJPY — Bulls Face a Major Resistance📊 Technical Analysis
● GBPJPY remains in a strong rising channel, with price continuing to respect the ascending support structure while pushing toward the upper boundary.
● The current move is testing a major resistance zone where the upper channel line and resistance structure converge, giving se
EURUSD 4H Analysis | Trendline Breakout, Liquidity & Key SupportEURUSD 4H Analysis | Trendline Breakout, Liquidity & Key Support Levels
Market Overview
EURUSD is currently showing a recovery attempt after an extended bearish move on the 4-hour timeframe. Price has moved upward from the lower demand area and is now trading around 1.12258, according to the provi
GBPUSD Bearish Reversal Setup | Rising Channel Breakdown....Bearish Reversal Setup | Rising Channel Breakdown & Support Analysis
1. Market Overview
The market is currently trading around 1.33706 after experiencing a strong bullish recovery within an ascending channel.
However, recent price action indicates a potential shift in short-term momentum. Price h
EURUSD: Repeated Resistance Failures Keep the Lower TargetHello everyone, here is my breakdown of the current EURUSD setup.
Market Analysis
EURUSD previously formed a Rounding Top and declined under the Trend Line into a range. Price then tested the Resistance Zone near 1.1270 with breakouts and was rejected, confirming the bearish bias.
Currently, EUR
GBPUSD | Bullish Reversal Opportunity From Discount ZoneGBPUSD has completed a strong corrective move into a key support region after breaking below the recent ascending structure. Price is now approaching an area where downside momentum appears to be slowing, while the highlighted entry zone could attract fresh buying interest.
The current market struc
A little lower for EUHi traders,
Last week EU swept the liquidity above the recent high, making the correction pattern (wave 4) a regular Flat. After that it started to drop again.
So next week, we could see one more move down for this pair if price stays below the bearish Daily FVG.
Let's see what the market does an
See all forex ideas
Trade directly on Supercharts through our supported, fully-verified, and user-reviewed brokers.