• Products
  • Community
  • Markets
  • Brokers
  • More
Get started
  • Markets
  • /Saudi Arabia
  • /Stocks
  • /Ideas
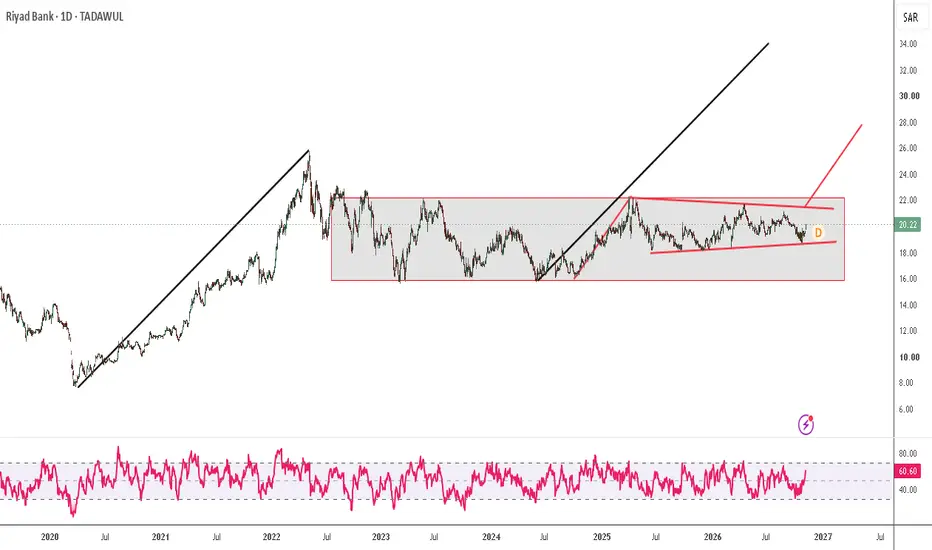
Riyad Bank (1010) : Breakout Trigger Required !!TADAWUL:1010 Since July 2022, price has remained range-bound between 16–22, indicating a prolonged consolidation phase. 📊 Long-Term Structure On the weekly timeframe, the broader structure may be developing into a continuation pattern. However, the 21–23 zone remains the critical make-or-break area for bulls. 📊 Short-Term Structure Zooming into the shorter-term price action, we can observe a potential bullish flag formation, with trendline resistance around 21.5. 🔑 Key Levels to Watch - 16
TADAWUL:1010Long
by wish_fund
Wataniya Insurance (8300) : Accumulation ZoneTADAWUL:8300 Price continues to trade in a range-bound structure, with the current price action suggesting a potential accumulation phase. The 15–16 resistance zone is the key level to watch. A decisive breakout and sustained move above this range could signal a shift in momentum and trigger the next upside leg. 🔑 Target Roadmap - 15–16: Key breakout zone - 20–25: Initial upside targets - 30: Extended bullish target 📈 Bullish Scenario A sustained breakout above 16 could open the door towar
TADAWUL:8300Long
by wish_fund
Sports Club (6018) Trendline Ahead - Bulls Push Toward 11.50?TADAWUL:6018 Price is approaching a strong trendline resistance zone, putting bulls at a crucial technical juncture. The 8.60–9.10 zone is the key area to watch. A sustained move above this range would strengthen the bullish case and could signal a potential trendline breakout. 🔑 Key Levels - 8.60–9.10: Crucial breakout and sustain zone - 11.50: Potential upside target 📈 Bullish Scenario If price breaks through resistance and sustains above 8.60–9.10, bullish momentum could accelerate, openi
TADAWUL:6018Long
by wish_fund
NAHDI (4164): Consolidation Zone Setup – TADAWULNAHDI (4164) on TADAWUL 1D is currently trading at 90.65 SAR (O:90.05, H:91.60, L:90.05, C:90.65, +0.60/+0.67%). CONDITIONAL SCENARIO: The daily chart shows price consolidating after recent momentum. Current price sits at 90.65 SAR with today's high at 91.60 SAR and low at 90.05 SAR. The stock is trading within a defined daily range, reflecting a consolidation pattern. CONFIRMATION: Bullish scenario confirmed if price closes daily above 91.60 SAR (today's high), potentially targeting the 92.00
TADAWUL:4164
by Asif_Brain_Waves
NAHDI Daily: 92 Reclaim Could Open 105.70 and 112Instrument: Nahdi Medical Company | TADAWUL:4164 Timeframe: Daily (1D) Bias: Bullish recovery only on confirmation Analysis date: 4 November 2026 Nahdi has rebounded sharply from its late-October low, but the broader Daily chart still shows a prolonged decline. The latest uploaded snapshot shows SAR 90.75, below the key horizontal area around SAR 92. This is a chart reference, not a live quote; the current Daily candle is not yet closed. BULLISH CONFIRMATION I am watching for a completed Daily
TADAWUL:4164Long
by Asif_Brain_Waves
BCI at least 50% upAccording to the chat pattern and its fair value, the stock is going north to 32 minimum. I am in 😁
TADAWUL:1210Long
by majed_333
TASI Stock with Strong Support & Resistance Levels**6015 – Technical Analysis** **Closing Price: 2.58 | 29 October 2026** The stock is approaching a major resistance zone at **2.65–2.75**, which remains a crucial hurdle for any meaningful upside move. A breakout above this range, supported by strong trading volumes and sustained monthly closings, could signal a potential trend reversal from bearish to bullish. On successful confirmation, the next resistance levels to watch would be **3.00 and 3.35**. **Overall View:** The stock is at a cr
TADAWUL:6015
by House-of-Technicals
**SABIC (2010) — Yearly Low Swept, Monthly Reversal Still Un SABIC remains in a bearish Monthly structure and has moved below the previous year’s low around **50**. This creates potential liquidity-sweep context, but a sweep alone does not confirm a bullish reversal. The displayed SFO states include **“source invalid,” “GP invalid” and “BUY blocked.”** The historical BUY CISD and completed TP1 labels do not establish a fresh entry. For a bullish recovery setup, I am watching for: - A Monthly reclaim of the **50 area**. - Fresh, valid Monthly CISD from
TADAWUL:2010Long
by Asif_Brain_Waves
**STC (7010) — Monthly SFO: Watching for a Fresh Recovery Setup* STC’s earlier bullish SFO sequence reached TP1 near 42. However, the chart now shows **“GP invalid”** and **“BUY blocked.”** The previous setup therefore does not currently support a fresh Model 2 entry. Price is testing the previous year’s low around 40. The highlighted **38.2–39.4 area** is a potential reaction zone, but a touch alone would not confirm a BUY. My bullish scenario requires: - A liquidity sweep followed by a convincing reclaim. - A fresh eligible SFO source, valid Monthly CIS
TADAWUL:7010Long
by Asif_Brain_Waves
SAPTCO (4040) — Monthly SFO: Yearly Low Sweep, Awaiting Confirma**SAPTCO (4040) — Monthly SFO: Yearly Low Sweep, Awaiting Confirmation** SAPTCO’s Monthly chart shows a sweep below the previous year’s low, followed by a bullish reaction and a marked BUY CISD. However, the broader structure remains bearish. Price has returned below the BUY CISD, and the indicator still displays **“Y BUY — Wait HTF close.”** This remains a developing recovery setup rather than a confirmed long entry. The bullish plan requires: - A reclaim of the marked BUY CISD. - Completio
TADAWUL:4040Long
by Asif_Brain_Waves
ALHABIB (4013) | Daily Bullish Recovery — 228.30 / 237ALHABIB (4013) | Daily Bullish Recovery — 228.30 / 237 Al Habib has rebounded from its October low and reclaimed support around SAR 219. The highlighted demand zone near SAR 216–220 is the key area I am watching. Bullish scenario: • Demand holds with bullish confirmation on closed candles. • First target: SAR 228.30. • Extended target: around SAR 237, following a confirmed breakout above 228.30. A reaction or pullback around the first target is possible before further continuation, as illustr
TADAWUL:4013Long
by Asif_Brain_Waves
Umm Al Qura (4325) | Monthly Buy Watch — SAR 21.71 Gap ObjectiveUmm Al Qura (4325) | Monthly Buy Watch — SAR 21.71 Gap Objective Analysis Date: 30 October 2026 Timeframe: Monthly Reference Price: SAR 16.38, as shown on the supplied chart. Umm Al Qura’s latest lower wick appears to sweep the previous low near SAR 14.5, creating a potential recovery setup. However, price remains below the marked reference area around SAR 16.5, so bullish confirmation is still required. BUY CONDITIONS 1. Reclaim and hold the SAR 16.5 area. 2. Confirm bullish CISD and a rele
TADAWUL:4325Long
by Asif_Brain_Waves
AlAmar Foods (6014) | Conditional Buy Plan — Monthly RecoveryAnalysis Date: 30 October 2026 Market: TADAWUL | Timeframe: Monthly Reference Price: SAR 39.00, as shown on the chart. AlAmar remains in a bearish monthly structure, but a potential base is developing around SAR 39. My bullish scenario requires confirmation before entry. BUY CONFIRMATION 1. Price reclaims and holds the SAR 39 area. 2. A closed Daily/H4 candle confirms bullish CISD, followed by a break of the relevant swing high. 3. Entry is considered on a retest of the confirmed bullish Fair
TADAWUL:6014Long
by Asif_Brain_Waves
NAHDI (4164) | Monthly Recovery Watch — SAR 112 / 132NAHDI (4164) | Monthly Recovery Watch — SAR 112 / 132 Nahdi is testing the SAR 92 area after a prolonged decline. The chart snapshot shows SAR 91.20, so a bullish recovery still needs confirmation. My preferred scenario: • A confirmed reclaim of SAR 92. • Bullish structure on the Daily or 4H chart, using closed candles. • First upside target: SAR 112. • Extended target: approximately SAR 132, if price breaks and holds above SAR 112. A reaction or pullback around SAR 112 would be reasonable be
TADAWUL:4164Long
by Asif_Brain_Waves
TASI Stock - Bullish in Bearish Market9618 Analysis CMP 26 (25-10-2026 02:05pm) Retracement done towards Golden Pocket Zone. ABCD Pattern may play well targeting around 36 - 37 if 29 - 29.50 is Crossed & Sustained with Good Volumes. However, breaking Point C (around 13) may bring some more selling pressure.
TADAWUL:9618Long
by House-of-Technicals
**Saudi Advanced Industries — Monthly Outlook | Yearly FVG 21oct**Saudi Advanced Industries — Monthly Outlook | Yearly FVG & Long-Term Recovery Potential** Saudi Advanced Industries is approaching an important higher-timeframe decision area after a prolonged bearish decline. The Monthly chart highlights a **Yearly Type 4 FVG** overlapping a broader demand zone, with price near **SAR 13.23**. **Bullish Recovery Scenario** If buyers defend the highlighted demand region and Monthly price structure begins to improve, the following levels become important: •
TADAWUL:2120
by Asif_Brain_Waves
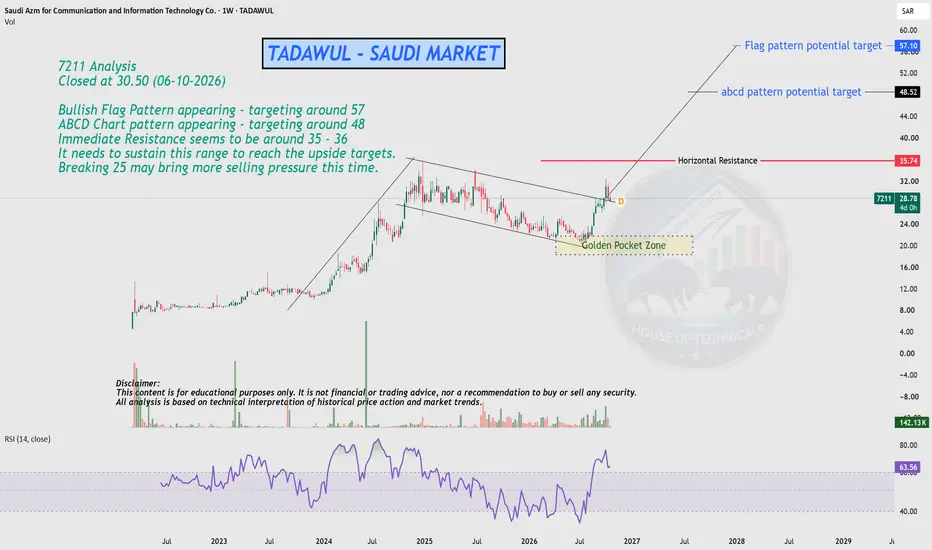
Bullish Setup in 72117211 Analysis Closed at 30.50 (06-10-2026) Bullish Flag Pattern appearing - targeting around 57 ABCD Chart pattern appearing - targeting around 48 Immediate Resistance seems to be around 35 - 36 It needs to sustain this range to reach the upside targets. Breaking 25 may bring more selling pressure this time.
TADAWUL:7211Long
by House-of-Technicals
1
Beautiful Setup1325 - Watani Iron Steel Co. Closed at 3.22 (18-10-2026) Beautiful Flag pattern on bigger tf. Crossing & Sustaining 3.40 - 3.50 may lead it towards 5.50 - 5.70 On the flip side, it may retest 2.30 - 2.50. However, it should not break 1.50 this time, else we may witness more selling pressure.
TADAWUL:1325
by House-of-Technicals
Theeb Rent a car reversal chance.From March 2021 until January 2026, the price consistently moved within a well‑defined channel. In 2026, the stock broke below the channel and continued falling along the downward trend line. It has now reached the projected breakout target zone, where a potential upward reversal is expected
TADAWUL:4261Long
by ahmerned
TADAWUL: 4261 (Harmonic Pattern) The price near by the Potential Reversal Zone - PRZ between 18-20 SAR
TADAWUL:4261Long
by adel942
Updated
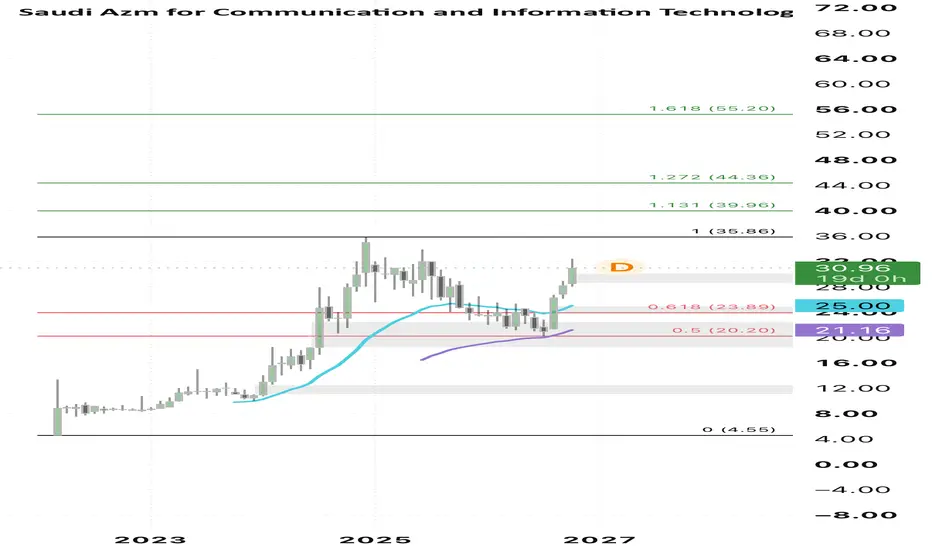
7211Technical Outlook : Bullish in the long term, with a key resistance zone between SAR 32.40 and SAR 35.86. Financial Outlook: The company is delivering strong earnings growth, although its P/E ratio remains relatively high. Investment Outlook : A promising long-term investment worth considering for a diversified portfolio, provided the stock is purchased at a reasonable valuation and the company’s financial performance is closely monitored. Disclaimer : This analysis is for informational a
TADAWUL:7211Long
by binibra37
7030I am expecting a move from here to new high numbers. The fundamentals say that this stock is undervalued 😀
TADAWUL:7030Long
by majed_333
2320 Al Babtain20-09-2026 CMP 57.3 Currently at a good duppoert Precious attempt to break this support was rejected by Bulls Morning Star pattern also appearing Stochastic also +ve signals Can plan entry here 1st Target 58 2nd Target 59.6 3rd Target 62 Stoploss 56 on closing basis
TADAWUL:2320Long
by khurramsheikh
2300 SPM20-09-2026 CMP 62 Classical bullish divergence appearing on RSI in lower TF Can plan entry here 1st Target 62.8 2nd Target 63.5 3rd Target 65 Stoploss 61 on closing basis
TADAWUL:2300
by khurramsheikh
123456789101112131415161718192021222324252627282930313233343536373839404142
…999

Made by humans

Select market data provided by ICE Data Services. Select reference data provided by FactSet. Copyright © 2026 FactSet Research Systems Inc.Copyright © 2026, American Bankers Association. CUSIP Database provided by FactSet Research Systems Inc. All rights reserved. SEC filings and other documents provided by Quartr.© 2026 TradingView, Inc.

SOC 2 CompliantGDPR Compliant
More than a product
  • Supercharts
Screeners
  • Stocks
  • ETFs
  • Bonds
  • Crypto coins
  • CEX pairs
  • DEX pairs
  • Pine
Heatmaps
  • Stocks
  • ETFs
  • Crypto coins
Calendars
  • Economic
  • Earnings
  • Dividends
  • IPOs
More products
  • News Flow
  • Portfolios
  • Fundamental Graphs
  • Yield Curves
  • Options
  • Macro Maps
  • Pine Script®
  • MCP Server
Apps
  • Mobile
  • Desktop
Community
  • Social network
  • Wall of Love
  • Refer a friend
  • Creator program
  • House Rules
  • Moderators
Ideas
  • Trading
  • Education
  • Editors' picks
Pine Script
  • Indicators & strategies
  • Wizards
  • Freelancers
  • Marketplace
Tools & subscriptions
  • Features
  • Pricing
  • Market data
  • Gift plans
Trading
  • Overview
  • Brokers
  • Brokers comparison
  • The Leap
Special offers
  • CME Group futures
  • Eurex futures
  • US stocks bundle
About company
  • Who we are
  • Space mission
  • Blog
  • Help Center
  • Careers
  • Media kit
Merch
  • Tarot cards for traders
  • The C63 TradeTime
Policies & security
  • Terms of Use
  • Disclaimer
  • Privacy Policy
  • Cookies Policy
  • Accessibility Statement
  • Trust Center
  • Security tips
  • Bug Bounty program
  • Status page
Business solutions
  • Widgets
  • Charting libraries
  • Lightweight Charts™
  • Advanced Charts
  • Trading Platform
Growth opportunities
  • Advertising
  • Brokerage integration
  • Partner program
  • Education program
Community
  • Social network
  • Wall of Love
  • Refer a friend
  • Creator program
  • House Rules
  • Moderators
Ideas
  • Trading
  • Education
  • Editors' picks
Pine Script
  • Indicators & strategies
  • Wizards
  • Freelancers
  • Marketplace
Business solutions
  • Widgets
  • Charting libraries
  • Lightweight Charts™
  • Advanced Charts
  • Trading Platform
Growth opportunities
  • Advertising
  • Brokerage integration
  • Partner program
  • Education program
Look FirstLook First