Investing:Nifty IT is looking good for long term accumulation!If you have been following the tech related news lately, it has been about the new AI "revolutionary" tool named Anthropic.
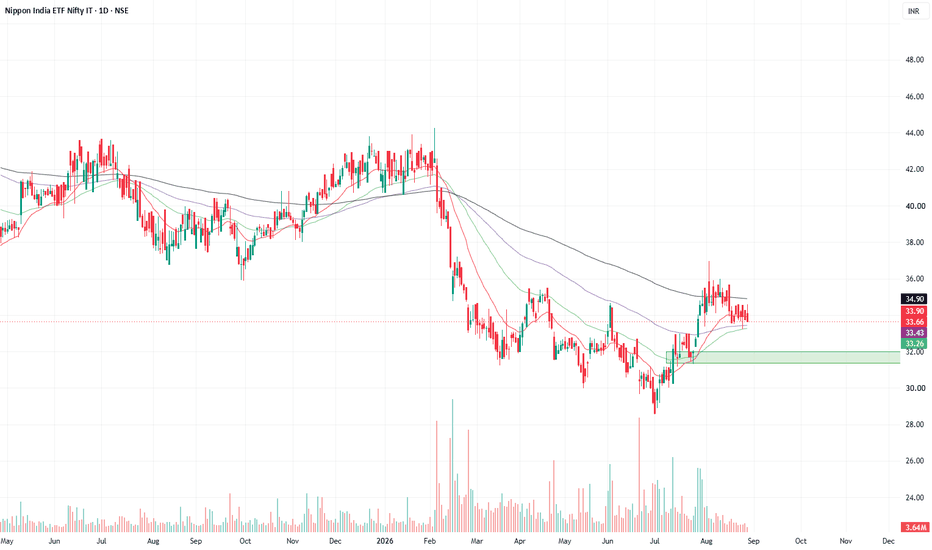
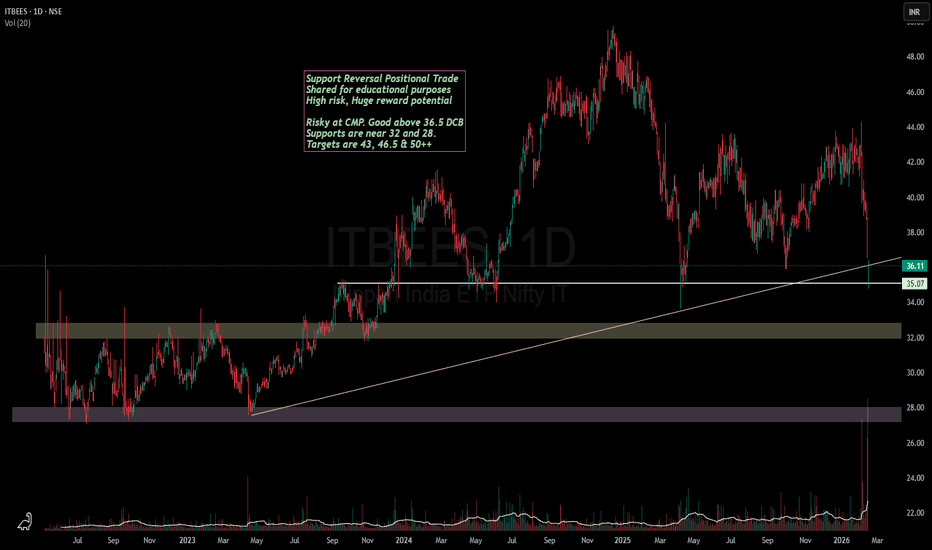
And the same is visible on charts of Nifty IT.
TCS is available at a price at which it was trading in December 2020.
Infy has just broke a crucial support.
Wipro has always been the weakest of 3.
So what next?
My opinion is that the fall is now almost in the end stage. The accumulation has already started on Friday as we have seen some good recovery by end of the day.
However, A SL hunting move near 32-34 zone might come as a formation of a lower low with RSI divergence in Nifty ITBEES which is where one needs to be careful.
We might also see some rebalancing & restructuring in IT index soon. However, these large companies are operating since past many decades and are here to stay at least for a few more.
These are the kind of dips which should be mouth watering for long term investors as the valuations are now dirty cheap.
The levels which i mentioned are my personal opinion shared for educational purposes and should not be considered as a recommendation.
ETF market
Option Intraday AnalysisOption Chain Analysis: Decoding Open Interest (OI) to find where the "Big Players" are positioned.
FII/DII Data: Understanding institutional activity and its impact on market direction.
Intraday Strategies: Scalping and swing setups using Price Action and key EMAs.
Global Market Cues: How GIFT Nifty and US Markets might influence our opening.
Price above VWAP
Put writing increases
Resistance breakout confirmed
Institutional Option TradingIntraday trading involves buying and selling financial instruments within the same trading session, with all positions closed before the market ends. Traders aim to take advantage of short-term price fluctuations using fast decision-making and technical analysis. Intraday trading is highly active and often relies on chart patterns, volume analysis, momentum indicators, and market news to identify quick trading opportunities.
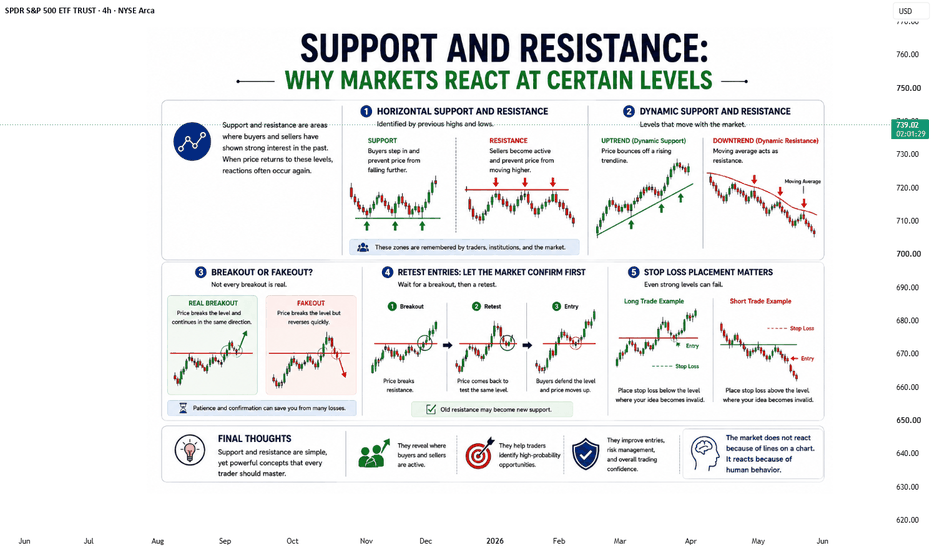
Support and Resistance BasicsIf you ask experienced traders what they look at first on a chart, many will give the same answer:
Support and Resistance.
These are not magical lines that predict the future. Instead, they represent areas where buyers and sellers have previously shown strong interest. They are levels where emotions, decisions, and market psychology become visible on the chart.
Have you ever noticed how price often stops falling at a certain area and suddenly bounces back? Or how an uptrend pauses near a previous high and struggles to move further?
That is support and resistance in action.
Horizontal Support and Resistance
The easiest way to identify these levels is by looking at previous highs and lows.
A support level is an area where buyers step in and prevent prices from falling further.
A resistance level is an area where sellers become active and prevent prices from moving higher.
These zones are important because traders remember them. Institutions remember them. The market remembers them.
And when price returns to these areas, reactions often occur again.
Dynamic Support and Resistance
Support and resistance are not always horizontal.
Moving averages, trendlines, and channels can also act as dynamic support and resistance.
During strong uptrends, price may repeatedly bounce from a rising trendline.
During downtrends, a moving average can act as resistance and push price lower.
These levels move with the market and help traders understand the strength of a trend.
Breakout or Fakeout?
One of the most exciting moments in trading is a breakout.
Price finally breaks above resistance or below support.
But not every breakout is real.
Sometimes price moves beyond a level only to reverse quickly and trap traders who entered too early.
This is known as a fakeout.
The difference between a breakout and a fakeout often comes down to patience.
Waiting for confirmation can save traders from many unnecessary losses.
Retest Entries: Let the Market Confirm First
Professional traders rarely chase price.
Instead, they often wait for a breakout and then look for a retest.
For example:
Price breaks resistance.
Later, it comes back to test the same level.
If buyers defend that area and price starts rising again, the old resistance may become new support.
This approach allows traders to enter with more confidence and better risk management.
Stop Loss Placement Matters
Even the best support or resistance level can fail.
That is why stop losses are essential.
A stop loss should not be placed randomly.
It should be placed at a level where your trading idea becomes invalid.
Because trading is not about being right every time.
It is about protecting capital while allowing winning trades to grow.
Final words:
Support and resistance are among the simplest concepts in trading, yet they remain some of the most powerful.
They reveal where buyers and sellers are active.
They help traders identify opportunities.
And most importantly, they teach an important lesson:
The market does not react because of lines on a chart.
It reacts because of human behavior.
$SPY How you an trade the top. AMEX:SPY SPY Technical Analysis: Multi-Day Upward Channel
The SPY is maintaining a clean, well-defined ascending (upward) channel that has guided price action over the last several trading sessions. The market is respecting both parallel boundaries of this structure, providing clear, high-probability structural levels to build a game plan around.
* Channel Resistance (Upper Boundary): Currently capping upside momentum near the $758 – $760 zone.
* Channel Support (Lower Boundary): Acting as a consistent buying floor, currently tracking along the $752 – $754 range (and rising dynamically over time).
💡 Trading Strategy: Playing the Channel Ranges
When trading an established ascending channel, the objective is to maximize efficiency by buying structural value and locking in profits near historical supply, rather than chasing breakouts prematurely.
1. Long Setups (Buying the Floor)
* The Idea: Look for entries when the price pulls back to the lower ascending trendline support ($752 – $754 area).
2. Profit Targets & Short Setups (Selling the Ceiling)
* The Idea: Scale out of longs or look for tactical short opportunities as the price approaches the upper dynamic resistance trendline ($758 – $760).
* Confirmation for Shorts: Because the dominant trend is up, shorting inside an ascending channel carries higher risk. Look for clear signs of exhaustion—like long upper wicks or a failed breakout attempt above the upper line before attempting a mean-reversion short back toward the middle or bottom of the channel.
Trading Note: Trade the ranges until they break. Protect capital by letting the price come to your levels rather than chasing it in the middle of the channel.
#MIDSMALLTrend: The ETF remains in a structurally strong medium-term uptrend on the daily chart following its powerful rally from the April low of 42.41, despite its current minor pullback from the recent high of 51.63.
Price Action: A bearish daily candle dropped the price by -1.47% to close at 50.92, pulling back from overhead resistance to rest just above the immediate horizontal support line at 50.85.
#HNGSNGBEESTrend: The ETF has reversed its April-May recovery rally after topping out near 565.98, entering a sharp short-term downward correction on the daily chart.
Price Action: The latest bearish candle closed near its session low at 518.53, breaking through multiple minor support levels to sit just above a crucial structural support line at 512.70.
#SILVER1Trend: The ETF is currently locked in a multi-month sideways consolidation phase, maintaining a structural recovery floor from its April low of 17.77 but facing overhead supply near the 25.85 to 27.99 resistance zone.
Price Action: The price ticked down slightly by -0.24% to close at 25.32, continuing a string of quiet, range-bound sessions directly above immediate structural support levels at 24.52 and 23.65.
#MODEFENCE Trend: The ETF remains in a structurally strong medium-term uptrend on the daily chart after its sharp rally from the April lows, though it is currently undergoing a short-term corrective pullback from its recent peak of 104.44.
Price Action: A bearish candle pushed the price down by -1.81% to close at 99.91, breaking slightly below the psychological 100 mark to test the immediate horizontal support line near 99.4.
#GROWWRAIL Trend: The ETF has reversed its recent spring recovery after making a lower high at 34.47, resuming a broader medium-term downtrend on the daily chart.
Price Action: A sharp red candle broke firmly below the immediate horizontal support at 30.65 to close at 30.02, threatening a further slide toward the next major structural support level at 29.35.
#MIDCAPETFTrend: While the broader structure was steadily bullish peaking near 23.96, the ETF has entered a sharp short-term corrective phase over the last few sessions.
Price Action: The price witnessed a steep decline to test a critical psychological and horizontal support zone around 23.00 (22.98 orange dashed line) before staging a small relief candle to close at 23.10.
Institution Option Trading Part-2PCR (Put-Call Ratio) – Institutional Trading Strategy
What is PCR?
PCR = Put OI ÷ Call OI
It shows market sentiment of big players in indices like NIFTY 50.
Institutional Psychology
2. How Big Players Use PCR
Retail buys options randomly
Institutions control PCR zones to trap traders
👉 You follow PCR = You follow smart money
📈 PCR Levels (Game Changer)
3. Key Zones
PCR < 0.7 → Bearish sentiment (too many Calls) → ⚠️ Reversal possible
PCR 0.7 – 1 → Neutral zone
PCR > 1.2 → Bullish sentiment (too many Puts) → ⚠️ Reversal possible
👉 Extreme PCR = Trap zone (Institutional move coming)
(Smart Money PerspectiveRSI Divergence (Smart Money Perspective)
RSI Divergence signals a hidden shift in momentum before price reacts
Bullish Divergence → Price makes lower low, RSI makes higher low (reversal up)
Bearish Divergence → Price makes higher high, RSI makes lower high (reversal down)
Works best at strong demand & supply zones (institutional areas)
Always combine with market structure + liquidity grab for confirmation
Divergence alone is not enough—wait for price action validation
Most powerful when seen on higher timeframes (1H / 4H / Daily)
Institutions use divergence to trap retail traders before real move
Avoid using divergence in sideways markets (low accuracy)
Best entries come when divergence aligns with Break of Structure (BOS)
Institution Option Trading Part-3PCR means Put-Call Ratio
It compares how many Put options are traded versus Call options.
Simple formula: Put Volume ÷ Call Volume.
This helps understand market mood.
Institutions use options heavily
Big players like banks, hedge funds, mutual funds often use options for hedging and positioning.
So PCR can give clues about what smart money may be doing.
Shows fear vs confidence
High PCR = More puts than calls = Fear, protection, bearish mood.
Low PCR = More calls than puts = Confidence, bullish mood.
Institutions often buy protection before market falls
Banknifty and Nifty AnalysisPCR means Put Call Ratio
It tells us how many Put options and Call options people are buying or trading.
Why it matters for institution trading
Big players mostly use options. So PCR helps us understand what big money may be thinking.
If PCR is high
More puts than calls.
Means traders are scared or taking protection.
Sometimes big players expect weakness.
If PCR is low
More calls than puts.
Means confidence in upside.
Sometimes market is bullish.
Why learn this
Price only shows movement.
PCR shows mindset behind movement.
Institutions think different
Retail people chase candles.
Institutions manage risk first.
PCR helps you see that risk activity.
RBI Interest Rate & Liquidity DecisionsIntroduction
The Reserve Bank of India (RBI) plays a major role in controlling inflation, maintaining financial stability, and supporting economic growth in India. One of the most important responsibilities of the RBI is managing interest rates and liquidity in the banking system. These decisions directly impact the stock market, banking sector, businesses, loans, investments, and the overall economy.
This report explains RBI interest rate policies, liquidity management tools, market impact, and future expectations in simple and professional language.
Understanding RBI Interest Rate Decisions
The RBI mainly controls monetary policy through the Monetary Policy Committee (MPC). The committee reviews economic conditions regularly and decides whether interest rates should increase, decrease, or remain unchanged.
What is Repo Rate?
The Repo Rate is the rate at which the RBI lends money to commercial banks.
Higher Repo Rate = Expensive loans
Lower Repo Rate = Cheaper loans
When inflation rises sharply, the RBI usually increases the repo rate to reduce excessive spending in the economy. When economic growth slows down, the RBI may reduce interest rates to encourage borrowing and investments.
Current Market Importance
Repo rate decisions are closely watched by:
Stock market traders
Institutional investors
Banks and NBFCs
Foreign investors
Businesses and industries
Even a small change in rates can create strong movement in banking stocks, financial markets, and currency markets.
RBI Liquidity Management
Liquidity means the availability of money in the financial system.
The RBI continuously manages liquidity to maintain balance in the economy. Too much liquidity can increase inflation, while too little liquidity can slow economic growth.
Major Liquidity Tools Used by RBI
1. CRR (Cash Reserve Ratio)
Banks are required to keep a certain percentage of deposits with the RBI.
Higher CRR reduces money supply
Lower CRR increases liquidity in banks
2. SLR (Statutory Liquidity Ratio)
Banks must maintain a percentage of deposits in safe assets like government securities.
This ensures financial stability and controls excessive lending.
3. Open Market Operations (OMO)
The RBI buys or sells government securities in the market.
RBI Buying Bonds = Injecting liquidity
RBI Selling Bonds = Removing liquidity
4. Reverse Repo Rate
This is the rate at which banks park excess money with the RBI.
Higher reverse repo rates encourage banks to keep money with RBI instead of lending aggressively.
Impact on Financial Markets
Banking Sector Impact
Banking stocks react strongly to RBI policy decisions.
Positive Impact
Lower interest rates support loan growth
Better credit demand improves banking profitability
Private banks often benefit from liquidity support
Negative Impact
Higher rates increase borrowing costs
Loan growth may slow down
Banking margins can face pressure
Major banking stocks and financial institutions usually witness high volatility during RBI policy announcements.
Impact on Stock Market
Bullish Scenario
When the RBI supports growth with stable or lower rates:
Banking sector strengthens
Real estate sector improves
Auto sector demand increases
Market sentiment becomes positive
Bearish Scenario
When the RBI becomes aggressive against inflation:
Market volatility increases
Growth stocks face pressure
FIIs may reduce risk exposure
Interest-sensitive sectors weaken
Institutional traders closely monitor RBI commentary for future policy guidance.
Impact on Inflation
Inflation control is one of the primary objectives of the RBI.
If inflation remains high for a long period:
Purchasing power decreases
Consumer spending slows down
Economic stability weakens
The RBI uses higher interest rates to control demand and reduce inflation pressure.
However, aggressive tightening can also slow economic growth. Therefore, the RBI tries to maintain a balance between inflation control and growth support.
Impact on Indian Rupee
RBI policy decisions also influence the Indian Rupee.
Stronger Rupee Scenario
Higher interest rates attract foreign investors
Foreign inflows support the currency
Bond market becomes attractive
Weaker Rupee Scenario
Lower rates may reduce foreign inflows
Global uncertainty increases pressure on currency
Oil prices also impact rupee movement
Currency traders monitor RBI policy statements carefully for future guidance.
Institutional Perspective
Large institutions and smart money participants focus heavily on:
RBI inflation commentary
GDP growth outlook
Liquidity conditions
Bond yield movement
Banking sector stability
Global central bank trends
Institutional investors usually position themselves before major policy announcements.
Volatility in Bank Nifty and financial stocks often increases significantly during RBI events.
Future Expectations
Market participants are currently focused on:
Inflation trend in India
Global interest rate environment
US Federal Reserve policies
Crude oil prices
Domestic liquidity conditions
Economic growth momentum
If inflation remains under control, the RBI may maintain a supportive stance for growth. However, if inflation pressures increase again, stricter monetary policy measures may return.
Key Market Takeaways
RBI policy decisions directly impact Indian financial markets.
Interest rate changes influence banking, real estate, auto, and financial sectors.
Liquidity management plays a major role in market stability.
Institutional traders closely monitor RBI commentary and future guidance.
Bank Nifty often witnesses strong volatility during policy announcements.
Inflation and growth balance remain the RBI’s top priority.
Trading Option Analysis With Education and Logic PCR means Put Call Ratio
It tells us how many Put options and Call options people are buying or trading.
Why it matters for institution trading
Big players mostly use options. So PCR helps us understand what big money may be thinking.
If PCR is high
More puts than calls.
Means traders are scared or taking protection.
Sometimes big players expect weakness.
If PCR is low
More calls than puts.
Means confidence in upside.
Sometimes market is bullish.
Institution Option Trading Part-1PCR means Put Call Ratio
It tells us how many Put options and Call options people are buying or trading.
Why it matters for institution trading
Big players mostly use options. So PCR helps us understand what big money may be thinking.
If PCR is high
More puts than calls.
Means traders are scared or taking protection.
Sometimes big players expect weakness.
If PCR is low
More calls than puts.
Means confidence in upside.
Sometimes market is bullish.
Why learn this
Price only shows movement.
PCR shows mindset behind movement.
Institutions think different
Retail people chase candles.
Institutions manage risk first.
PCR helps you see that risk activity.
Technical Analysis VS. Institutional Option Trading part - 2.0Trading is the process of buying and selling financial instruments such as stocks, commodities, currencies, or derivatives with the objective of generating profit. Unlike long-term investing, trading focuses more on price movements over shorter timeframes.
Key Objectives of Trading:
Capital appreciation
Hedging risk
Generating regular income
Leveraging market volatility
Trading operates on the principle of demand and supply, where price fluctuates based on market participants’ actions.
Trading is the backbone of modern financial markets, allowing individuals and institutions to participate in wealth creation, risk management, and price discovery. In today’s digital era, trading has evolved from traditional floor-based systems to advanced algorithmic and data-driven environments. This comprehensive guide will help you understand options and all major types of trading in a structured, professional manner.