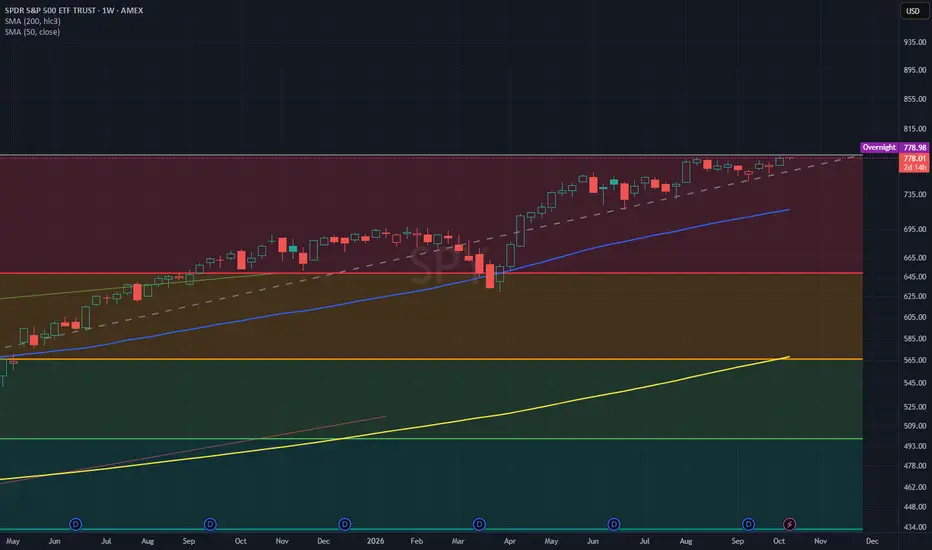
$SPY & $SPX — Levels for Thursday, October 15, 2026🔮 AMEX:SPY & SP:SPX — Levels for Thursday, October 15, 2026
📊 Key U.S. Economic Data (ET)
8:30 AM | Core PPI m/m | Forecast: 0.3% | Previous: 0.2%
8:30 AM | Core Retail Sales m/m | Forecast: 0.6% | Previous: 1.4%
8:30 AM | PPI m/m | Forecast: 0.6% | Previous: 0.4%
8:30 AM | Retail Sales m/m | Forecast: 0.3% | Previous: 1.2%
8:30 AM | Philly Fed Manufacturing Index | Forecast: 28.2 | Previous: 37.8
8:30 AM | Unemployment Claims | Forecast: 199K | Previous: 197K
11:30 PM | Fed Speake
ETF market
SQQQ: Bulish Setup Is In Place.TIME to go long on SQQQ ladies and gentlemen, you know the drill.
Daily targets are on the table .
Play it right.....................Play it safe..................Play it The Numberfive Way.
Boost......................Follow....................Share..................Comment.
DRAM: Breakout And RetestRoundhill Memory ETF (CBOE: DRAM) closed its latest trading session at $57.19. The fund remains in a technical bear market, down nearly 30% from its 52 week high of $81.34. The primary catalysts driving current market behavior include massive institutional outflows and shifting AI dynamics.
Technical view:
DRAM is on a bullish motion. The ETF recently broke below its trend support line at $59.70, after a few months of scaling partially on highs and lows pattern, in respect to the framework. Pri
SMH at weekly ema20 566$ major support see it go up ...NASDAQ:SMH weekly 20ema is a place (green line) where since May2025 always bounced off it. So I see it bounce today since it's also down like 6 days in a row ish! Be careful of the higher low's! trading inside a bear flag also the white trend lines.. Monthly chart veryyy overbought I see it drop 40% but not now, I see it happening more on November-January. That is only if stays over support white line, if drops under and go under it'S 200ema day I would turn bearish and a pump not likely at all
QQQ GEX - Hot CPI, Negative GEX, 730 Put Wall in FocusQQQ backed off a test of 740 after a hotter-than-expected CPI print, and the 10-year yield is pushing higher with it. PPI is due tomorrow.
Near 737, on the October 23 cumulative profile (9 DTE), price is inside the put cluster and still above the largest put wall. 730 is the level in focus.
🔶 Regime Context 🔶
HVL is at 746. Below it, QQQ is in a negative GEX regime, where price tends to be less stable than above the pivot. The put cluster starts at 742 and runs down through 740 and 734 towar
10/16/26 - $ETHB/$SBET10/16/26 :: VROCKSTAR :: $ETHB/ NASDAQ:SBET
Rotataing back into SBET
- on a day where people realize they've done zero work
- the discount requires moving funds back from ETHB to SBET which as you can see, we timed the bottom and preserved nearly 18% of our purchasing power in eth
- it's just a game of playing discounts against each other.
- SBET is the only eth exposure i have, rn
V
A stop is an instruction, not a price: a year of SPY gapsHow a backtest fills a stop decides what its drawdown means. TradingView's own emulator does the honest thing: when a bar opens through your stop, it fills at the open. A spreadsheet that books the stop price on every loss does not. Here is what that difference looked like over the last year on the most liquid index ETF there is.
AMEX:SPY, daily bars, 2025-10-10 to 2026-10-09. 251 bars, so 250 overnight gaps. Split-adjusted, regular session only, recomputed from the feed rather than quoted:
—
Research 14.10.2026🌏 Markets:
AMEX:SPY -2.26 -0.29%(pre/m)
NASDAQ:QQQ -4.28 -0.58%(pre/m)
🆕 Economic News:
Wall St futures turn lower after hotter-than-expected September CPI; chip stocks stay under pressure after ASML results
08:30 USA – CPI (Sep)
13:30 USA – Fed Barkin Speech
14:00 USA – Fed Beige Book
14:00 USA – Monthly Budget Statement
22:55 USA – Fed Bowman Speech
📈 Gap Ups
Reaction to earnings/guidance:
NYSE:BLK , NYSE:MS
Other news:
NASDAQ:LQDA soars after a global settle
SPY Is Trading Above 779.37 Premarket, CPI Decides The Close.SPY Is Trading Above 779.37 Premarket, CPI Decides The Close.
SPY is trading near 779.70 premarket, just above the 779.37 August high it has traded through on three sessions in the past week without a close above. A new hourly bullish announcement printed at 779.32 in the 4 am ET hour, and the hourly structure is impulse continuation to the upside, with the traffic light yellow and a high-sweep anti-signal active. On the 4H the structure is in transition with a bearish tilt and the light is gre
$SPY & $SPX — Levels for Wednesday, October 14, 2026🔮 AMEX:SPY & SP:SPX — Levels for Wednesday, October 14, 2026
📊 Key U.S. Economic Data (ET)
8:30 AM | Core CPI m/m | Forecast: 0.2% | Previous: 0.3%
8:30 AM | Core CPI y/y | Forecast: 2.5% | Previous: 2.4%
8:30 AM | CPI m/m | Forecast: 0.6% | Previous: 0.4%
8:30 AM | CPI y/y | Forecast: 3.6% | Previous: 3.4%
⚠️ For informational purposes only. Not financial advice.
📌 #CPI #Inflation
Same SPY chart. Why do the VWAP lines disagree?VWAP depends on where its calculation begins . Change the starting point and you change the history included in the average.
It adds each bar’s source price multiplied by volume, then divides by total volume since the anchor. Here the source is HLC3: the average of each bar’s high, low and close.
Session VWAP starts again each trading session. It answers a question about that session’s volume-weighted price history.
Week VWAP starts again at the beginning of the trading week. Later sessions
SPY: busy closing volume is not a direction signalSPY’s closing half-hour looks busy. That is not enough to choose a side.
The native Session Block Profile table on this 15-minute SPY chart uses 30-minute New York session blocks. It shows 60 completed sessions and seven excluded sessions. Read the 15:30–16:00 row:
• Volume: 2.78x
• Range: 0.91x
• Efficiency: 0.44
These are historical medians. Range and volume are normalized against each session’s typical block before aggregation. The volume reading is not a claim that the current bar traded
Spy at a Crossroads : Breakout Energy or Another Bull Trap💹 SPDR S&P 500 ETF Trust | 15-Minute Outlook
SPY is showing a sharp rebound from the demand zone, with buyers pushing price towards overhead supply. The next move depends on whether bulls can turn this recovery into a sustained breakout—or sellers step in again.
🔑 THE LEVELS THAT MATTER
📍 Current Price: $778.06
⚪ POC / Key Pivot: $777.71
🔴 Supply Zone: Around $778.00–$778.20
🔵 Demand Zone: Around $777.15–$777.40
🟢 BULLISH PLAY | Buyers Take Control
A decisive 15-minute close above the supply
Research 13.10.2026🌏 Markets:
AMEX:SPY -0.61 -0.08%(pre/m)
NASDAQ:QQQ -5.38 -0.72%(pre/m)
🆕 Economic News:
Wall St futures mixed as a chip selloff weighs on the Nasdaq while big banks kick off Q3 earnings season
08:15 USA – ADP Weekly Employment Change
10:00 USA – Existing Home Sales
13:00 USA – Fed Barkin Speech
14:00 USA – Monthly Budget Statement
16:00 USA – Fed Collins Speech
📈 Gap Ups
Reaction to earnings/guidance:
NYSE:GS , NYSE:UNH
Other news:
NASDAQ:FRMI jumps after signi
SPY Is Holding Under 779.37 Ahead Of CPI.SPY Is Holding Under 779.37 Ahead Of CPI.
SPY is trading near 777.45 premarket, under the 779.37 August high it has traded through and closed under in three sessions this past week - Tuesday, Friday and Monday. Monday's range was 777.05 to 779.40. On the hourly the structure is impulse continuation to the upside and the traffic light is yellow, while the last hourly announcement was bearish. On the 4H the structure is turning to a bearish tilt in the current bar, the light is green and the last
SPY: a level is not an entrySPY has a previous-day high at 779.42 and a weekly open at 778.78. Those lines tell us where price sits. They do not tell us that a setup exists.
This is the completed October 12 regular-session example on a 15-minute chart. Daily Sweep Pro reports “No trade: no daily control.” Its entry, stop and target fields are empty.
The useful habit: read the reason before turning a chart level into a trade. Here, daily structure does not supply the directional control this tool requires. Being below the
SPY: big closing volume compared with what?SPY’s final 15-minute bar on October 12 looks large beside the preceding bars. The clock changes the comparison.
On this TradingView feed, the completed 15:45 bar shows 580.4K volume versus a 728.4K median for the same clock slot across 60 earlier complete sessions. Relative volume is 0.80x.
Practical check: compare 15:45 with earlier 15:45 bars before calling the close unusual. A large bar beside quiet midday bars does not settle that question.
The Time-of-Day Volume Normalizer shown here ma
$SPY & $SPX — Levels for Tuesday, October 13, 2026🔮 AMEX:SPY & SP:SPX — Levels for Tuesday, October 13, 2026
📊 Key U.S. Economic Data (ET)
6:00 AM | NFIB Small Business Index | Forecast: 98.1 | Previous: 98.7
8:15 AM | ADP Weekly Employment Change | Previous: 23.8K
10:00 AM | Existing Home Sales | Forecast: 3.95M | Previous: 3.98M
3:45 AM | Fed Speaker: Waller
1:00 PM | Fed Speaker: Barkin
4:00 PM | Fed Speaker: Collins
⚠️ For informational purposes only. Not financial advice.
📌 #SPY #SPX #StockMarket #EconomicData
Elliott Wave Analysis: SPY Bullish Cycle Yet to CompleteThe short‑term Elliott Wave view in the S&P 500 ETF (SPY) indicates that the instrument remains in an incomplete bullish sequence. This favors additional upside in the near term. The pullback to 749.90 marked the end of wave ((iv)), and the ETF has since advanced into wave ((v)). The rise from that level is forming a five‑wave diagonal. At present, only three swings higher have developed.
From the September 17 low, wave i concluded at 775.14. A corrective decline in wave ii then ended at 758.79