SPY 760 Breakout or 750 Retest? July 13
SPY is coming into the week with the daily trend still bullish, but price is sitting directly below an important resistance zone around 755.65–760.
The 15-minute chart shows a strong move from 748.10 into 755.65, followed by tight consolidation near the highs. That is constructive, but I would not chase calls directly into several stacked GEX resistance levels.
For me, the main question is whether SPY can accept above 755–756 and continue toward 758–760, or reject and rotate back toward the 753–750 support zone.
Daily Chart
The daily structure remains bullish with price continuing to form higher lows above the rising trendline from the April low.
SPY recently recovered from the 720 area and is now retesting the upper part of the larger rising structure. The previous high around 758.45 is the first major daily resistance.
A daily close above 758.45–760 would confirm another breakout and could allow SPY to continue making new highs.
The larger trend remains healthy while price stays above the recent rising support structure. The first major daily support is around 720, followed by 695. The larger chart would only begin showing meaningful weakness if those areas start failing.
15-Minute Chart
The 15-minute chart shows SPY recovering from 748.10 and trending higher into 755.65.
After reaching the high, price began consolidating around 754.80–755 instead of selling off sharply. That tells me buyers are still holding the move, but they have not cleared resistance yet.
The immediate pivot is 755.
A clean break above 755.65–756 could push SPY toward 757, 758 and the stronger 759–760 resistance area.
If SPY continues rejecting near 755–756 and loses 753, the next downside test would be the overnight level around 751.88 and then 750.
Key Levels
Resistance: 755, 755.65–756, 757, 758, 758.45, 759, 760
Support: 754, 753, 751.88, 750, 748.10, 746, 745.59, 740
GEX Positioning
The GEX chart shows several call levels stacked closely between 755 and 760.
The first nearby level is 755, followed by 756, 757 and 758. The largest visible call concentration appears around 759, making 758–760 the most important upside resistance zone.
Because GEX is positive, SPY could remain pinned near 755 unless buyers bring enough volume to push through the call walls. This can create slow movement, failed breakouts and premium decay while price stays inside the range.
The main support and high-volume level is around 750.
That makes 750 the most important downside pivot. As long as SPY stays above it, the broader intraday structure remains constructive.
Below 750, the next put levels are around 746 and 740. A confirmed break under 750 could allow volatility to increase as price moves away from the positive gamma area.
Bullish Scenario
For the bullish setup, I want SPY to hold above 754–755 and break 755.65–756 with volume.
A 15-minute close above 756 followed by a successful retest would give buyers a better chance of pushing toward 757 and 758.
The stronger breakout confirmation would come above 758.45.
Above 758.45, I will watch 759 and 760.
If SPY accepts above 760, the market could begin another price-discovery move into new highs.
Bearish Scenario
For the bearish setup, I will watch for repeated rejection between 755.65 and 758.
If SPY rejects this area and then loses 754, the short-term momentum would begin weakening.
Below 753, I will watch the overnight level around 751.88 and then the main 750 high-volume level.
A confirmed 15-minute close below 750 could open the move toward 748.10 and 746.
If 746 fails, the next downside levels would be 745.59 and the larger 740 put wall.
Trade Considerations
SPY is currently trading directly below several GEX resistance levels, so I would avoid chasing the first move above 755.
For calls, I want to see a clean break, hold and retest above 755.65–756.
For puts, I want to see rejection from 756–758 followed by a loss of 753 and 751.88.
The opening range and VWAP will be important. If SPY breaks resistance but immediately loses VWAP, the move could become a failed breakout. If SPY pulls back but continues holding above VWAP and 753, buyers may still be building for another attempt.
Options Outlook
The chart shows IV Rank around 28.6 and average implied volatility near 15.1, so SPY options are not carrying extremely elevated volatility.
However, positive GEX and the closely stacked levels between 755 and 760 could still create slow price movement and 0DTE premium decay.
The cleaner directional opportunity may come after SPY confirms above 756 or breaks below 750 rather than while it remains trapped between those levels.
Conclusion
SPY remains bullish on the daily chart, but price is approaching an important resistance cluster.
Above 756, I will watch 757, 758, 759 and 760.
Below 753, I will watch 751.88, 750, 748.10 and 746.
The main decision range this week is 750–760. A confirmed break above 760 could continue the larger uptrend, while losing 750 could create a deeper rotation toward the lower GEX support levels.  Long
Long
Weekly Bias — 13 JulyNASDAQ:QQQ is still in balance, but AMEX:SPY is closer to breaking out
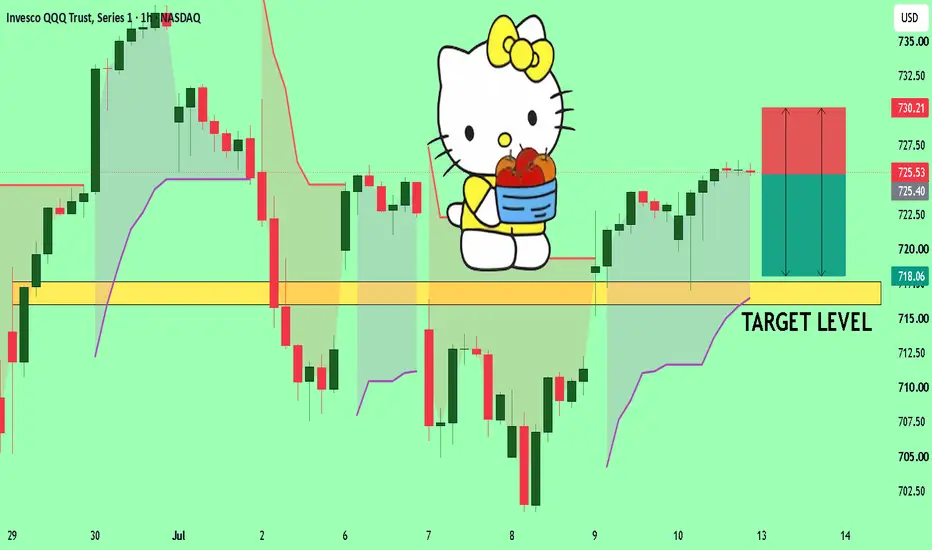
NASDAQ:QQQ is sitting almost exactly at fair value ($720–$726)
Upside becomes harder without new buyers
Downside becomes harder without aggressive sellers
This explains why NASDAQ:QQQ has felt "stuck"
The 50d EMA is major confluence support
Previous swing lows
Prior liquidity sweep
Lower Bollinger band
Psychological $700
Neither a bearish or bullish trend, but in balance
The larger pool is below & that's why I still think a downside sweep remains possible before earnings
If bulls finally reclaim $730, price can move quickly
If $705 breaks, there may not be much demand until the the 100d EMA
Bullish
Only if $730 closes → $735 → $741 → $748
I would use $725–$730 calls with 17 July expiration only after confirmation above $730
Initial stop/invalidation would be back below $725
Bearish
If $719 fails → $705 → $700 → $685
I would look at $720 or $715 puts (depending on where NASDAQ:QQQ opens) with 17 July expiration, but only after a confirmed loss of $719 or a rejection from $730
My first profit target would be $705–$700 because that is where buyers are most likely to respond
I'd be watching the bond market just as much as price this week
If the 10Y yield pushes decisively above 4.6%, it would increase the odds of NASDAQ:QQQ breaking below the $719–$705 support cluster, particularly given the lack of momentum
Conversely, if yields retreat back toward 4.4%–4.5% while NASDAQ:QQQ reclaims $730, the bearish case weakens significantly because the macro headwind for large-cap growth would ease just as price escapes its month-long compression
This is probably the highest-event-risk week we've had in several months given 3 volatility catalysts that all interact
Mid-East escalation (oil & yields)
CPI (inflation/rates)
Warsh testimony (Fed reaction function), with major bank earnings also beginning
Mid-East
The geopolitical news matters primarily through oil
If the conflict remains contained, oil may initially gap higher Monday, but fade
Equities often recover quickly after the first reaction
If the conflict expands & energy infrastructure or the Strait of Hormuz becomes materially disrupted, oil likely rises further
Inflation expectations increase
Yields could remain elevated or move higher
Growth stocks face additional valuation pressure
CPI
This is probably more important than the geopolitical headlines for the week's trend
If headline & core both come in cooler than expected, yields likely fall
NASDAQ:QQQ should outperform
Descending range likely resolves higher
$725 → $730 → $741 → $748
If inflation surprises higher
The market immediately asks, is Warsh becoming more hawkish?
This is dangerous for tech
Likely path:
$725 → $719 → $710 → $705
A hot CPI combined with elevated oil prices would reinforce the narrative that inflation is proving sticky
Warsh
Warsh matters because markets are still learning his policy reaction function
His testimony comes shortly after CPI, so the 2 events can reinforce, or offset each other
Soft CPI + balanced testimony = very bullish
Hot CPI + hawkish testimony = probably the worst outcome for NASDAQ:QQQ
NASDAQ:QQQ is still sitting almost exactly at the high-volume acceptance area, $725 — why it's been so frustrating because it's sitting at fair value
Above $730, very little resistance
If buyers can reclaim $730 → $735 → $741
Price could move surprisingly quickly
Below $705, there is another air pocket
$705 → $690 could happen faster than many expect if support fails
I don't actually think CPI is the only risk
It's oil → inflation expectations → Warsh → 10Y yield → NASDAQ:QQQ
If oil spikes & the 10Y pushes above its recent highs, NASDAQ:QQQ 's technical support becomes much more vulnerable
Initial downside sweep to $705–$710, then recovery (40%)
Fits the technical compression & support picture
Upside breakout above $730 toward $741–$748 (30%)
Requires cooler inflation or a drop in yields
Continued $720–$730 chop into earnings (20%)
Dealers keep the market pinned despite catalysts
Breakdown below $705 toward the 100d EMA ~$685 (10%)
Needs multiple bearish factors to align like hotter inflation, sustained higher yields & poor market reaction
This is one of those weeks where the reaction is more important than the headline
A hot CPI followed by NASDAQ:QQQ holding $719–$720 would suggest much of the bad news was already priced in
A soft CPI followed by NASDAQ:QQQ failing at $730 would tell you buyers still lack conviction despite favorable news
With 3 major catalysts clustered together, I'd let the first 15–30 minutes after the cash open establish whether institutions are accepting or rejecting the move before committing to short-dated premium since on event-heavy weeks, confirmation often provides a better edge than trying to predict the initial direction  Long
Long
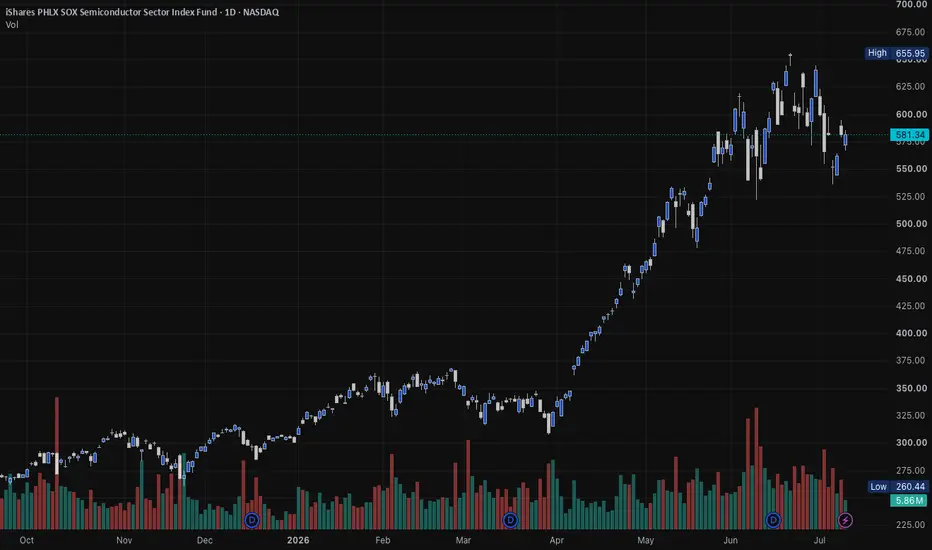
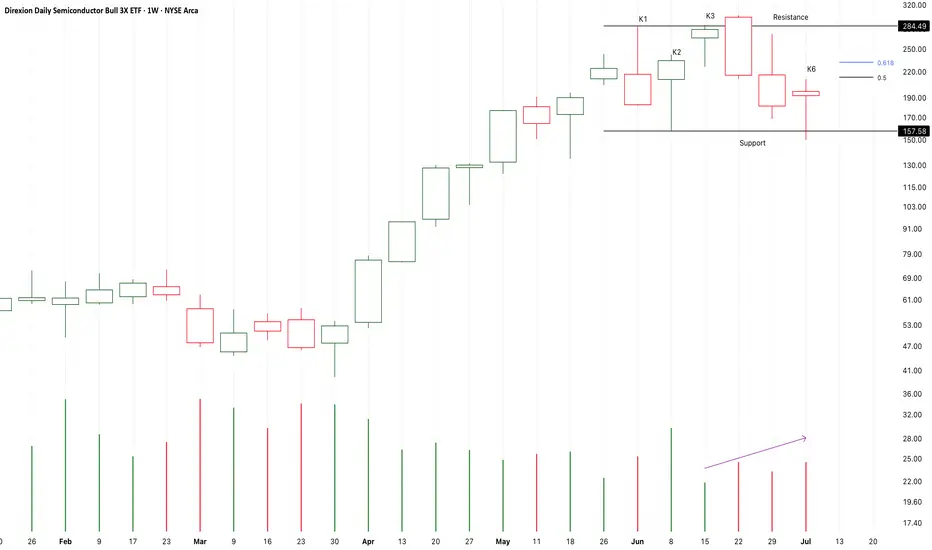
The semis melt-up the blocks did not confirmThe options tape screamed AI and semis all week - aggressive, one-sided call buying, the crowd chasing hard in names like SNDK, NBIS, MRVL, and MDB. But DarkFlow's institutional block read tells the opposite story in the same complex: the equipment and index names, the AMAT and SOXX group, were net distributed off-exchange all week, sold into every bit of that strength. The single largest block sale on the entire tape was not even a chip name. It was JPM, quietly hitting the exit while headlines pointed elsewhere.
The single-name tells sharpen it. AAPL looked call-heavy on the surface, but those calls were being sold, not bought - supply dressed up as demand. NFLX was the mirror image: the crowd was dumping it while the blocks quietly accumulated.
That divergence is the whole story. When the crowd is chasing calls while institutions quietly sell the complex into that strength, it is distribution into euphoria, not accumulation. The macro agrees: tightening financial conditions - firmer yields, a stronger dollar, weaker gold - are a direct headwind to exactly these high-multiple names.
The read: this looks like a late, crowded move in the semis, with the patient money using strength as an exit rather than an entry. Fading strength is favored over chasing it here; a genuine turn in the block distribution would be the tell that this read is wrong.
Not financial advice. A flow-and-blocks observation from DarkFlow's own record.  Short
Short
Top IVR/IV Underlyings in Broad Market, ETF's This WeekI've really been incredibly lazy of late screening the market for top IVR/IV underlyings to sell premium in, so thought I'd get off my duff for a change and do some "work" ... .
Here are the underlyings in broad market and the ETF space with highly liquid options ranked in descending order by IVR (implied volatility rank, i.e., where IV is relative to where it's been over the past 52 weeks):
Broad Market:
QQQ (60.1 IVR/25.0% IV)
EFA (31.1/13.9%)
SPY (27.8/14.9%)
IWM (20.0/20.3%)
DIA (19.5/13.6%)
For broad market premium selling, I generally look to sell premium where IVR>50 and 30-day IV is >21, so I'd probably only consider selling premium in the Q's here.
Illustration: QQQ August 28th (47 DTE), 676/786/2 x 790/795, 3.22 credit on a buying power effect (BPE) of 6.78, 47.5% ROC at max, 23.7% at 50% max. Generally, I'm looking to get one-third the width of the widest wing in credit, so this would be a marginal trade here.
ETF's:
SMH (Semiconductors) (88.1/58.5%)
EEM (Emerging Market) (83.6/38.9%)
EWY (Japan) (81.0/81.0%)
URA (Uranium) (61.1/52.5%)
XLE (Energy) (57.2/25.8%)
With ETF's, my cut-off's are >50 IVR, >35% 30-day IV, so SMH, EEM, EWY, and URA would be viable candidates; XLE would not because its IV is <35.
Illustrations:
SMH August 21st (40 DTE), 520/530/720/730 iron condor, 3.37 credit on BPE of 6.63, 50.8% ROC at max, 25.4% at 50% max. 20 delta short option legs.
EWY August 21st (40 DTE), 145/155/230/240 iron condor, 3.75 credit on BPE of 6.25, 60.0% ROC at max, 30.0% at 50% max. 23 delta short option legs.
Naturally, after hours quotes are showing wide bid/mid/ask, so will have to price these out during regular market hours.  Short
Short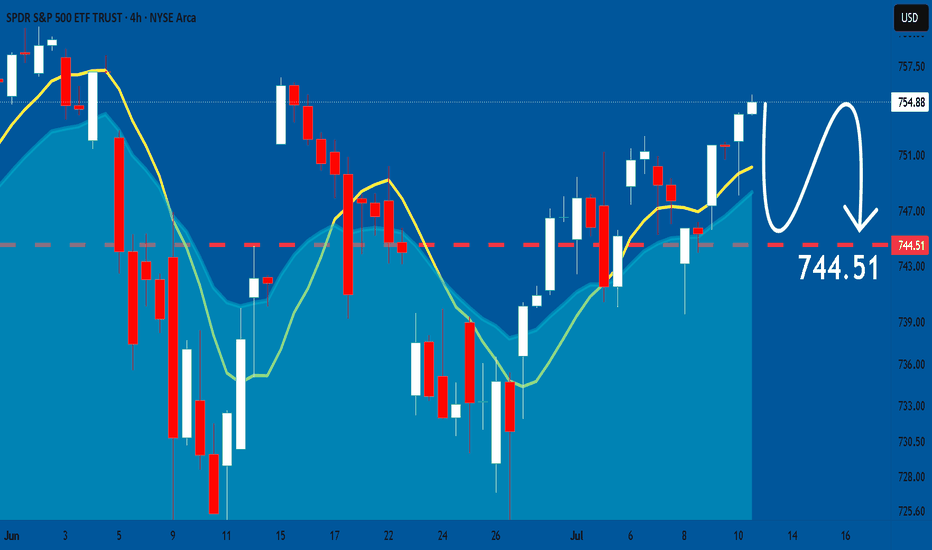
Short 
 Education
Long
 Short
Short
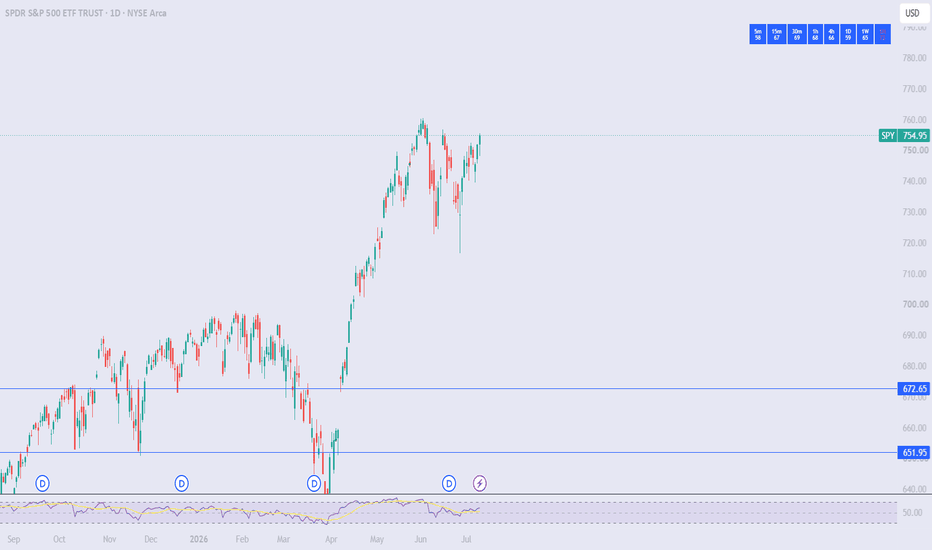
SPY Week of 7/13 SPY has been grinding higher inside a rising channel, but price is now pressing into the key 755.59–760.40(ATH) resistance zone. The chart is showing a tight consolidation just below ATH territory, which tells me the market is still biased bullish, but also very likely to keep chopping and teasing both sides before choosing a real direction.
I've mapped out three scenarios for the coming sessions:
🟢 Bullish Scenario
If SPY can hold above 755.59 and cleanly break through 760.40, that opens the door for a push into fresh ATH territory. A strong reclaim above that level would likely trigger momentum continuation toward the 765+ area, with the trend channel still supporting higher highs. Global tension and uncertainty haven’t broken the uptrend yet, so bulls stay in control as long as price keeps making higher lows.
🔴 Bearish Scenario
If SPY loses 754.89 and then 751.95, the market could start rolling back toward 745.57 and 740.71 support. A failure to hold that lower support zone would tell me the recent move was just a squeeze before a sharper retracement. In that case, 733 and even the high 720s come back into play fast.
🟡 Sideways Scenario (My Lean)
This is the scenario that frustrates everyone. SPY likely continues to ping-pong between roughly 751.95 and 760.40, with 754.89 acting like the magnet in the middle while price teases ATH without committing. That kind of chop is brutal for options holders because theta decay and IV swings can wipe out premium even when the direction eventually stays bullish.
My Outlook
If I had to rank the probabilities today:
🟡 Sideways (my current lean)
🟢 Bullish breakout
🔴 Bearish
I’m leaning sideways first, bullish second, and bearish last unless SPY loses the 751.95/745.57 support stack. If 760.40 gets reclaimed with follow-through, I’ll shift more aggressively bullish; if 751.95 breaks, the bearish case gets much more real.
As always, the Heavy Diligence Options Signals Indicator will be my primary tool for entries and exits. While these scenarios provide the broader roadmap, the indicator is designed primarily for day trading on shorter timeframes, helping identify higher-probability Call and Put opportunities. Combining those signals with key technical levels helps improve risk management instead of simply guessing the next move.
Disclaimer: This is only my interpretation of the current chart and is not financial advice. Always do your own research, wait for confirmation, and manage your risk before entering any trade. Markets Will DOUBLE - then TRIPLE in the next 20 years.Are you ready for what's next?
I see so many analysts posting content that flips from bullish to bearish every few days.
It must be impossible for people to try to trade efficiently when you are always trying to catch trends that have happened already.
In my opinion, the trick to staying ahead of the market trends is to have incredible analytical research and specialized tools to help everyone really understand what is happening in the US/Global markets.
That is why I have spent decades building specialized tools, Custom Indexes, and other utilities to help me plan my trades based on information derived directly from price.
In this video, I show you some of my custom indicators, a specialized Fibonacci modeling system, and try to share with you why I believe the US markets will first DOUBLE, then experience a moderate 25-35% pullback, then move into an incredible 100% rally before the end of 2028.
The reality is this. If you want to stay ahead of the markets, you must find tools, techniques, and reliable indicators that can help you really understand what price is going to do.
No one is 100% perfect at predicting price, but I like to think my specialized tools/technique give me a superior advantage over others. I'm not chasing trends "after they happen". I'm usually 3-10+ days ahead of the markets in most cases.
Either way, I hope you enjoy this video and that is pushes you to consider trying to find the best solutions for your trading. There are some very good tools available to help you. You just need to spend the time to investigate what works best for you.
Remember, right now, the markets (SPY) wants to rally above $845, then try to break above $911. There is no reason to consider these other "the market is topping" predictions. The data says the markets want to rally higher.
Get some Long

QQQ / NDX Weekly Outlook – Week 27 of 2026 (06-10 JUL)QQQ / NDX WEEKLY MARKET OUTLOOK
Last Week's Recap
The scalp position we initiated on Tuesday following the Chop Zone breakout was executed successfully and closed for a profit.
1 Trade | 1 Win
(For reference, I have included last week's outlook on the right.)
UA CAPITAL EXECUTION/MANAGEMENT RECAP
Week 26 of 2026 marked another profitable week for UA CAPITAL, extending our streak to 13 consecutive green weeks. We have now gone the entire year without a single red week.
Markets spent the first half of the week grinding slowly higher. In our Weekly Market Outlook, we identified the 725–709 area as a Chop Zone, supported by a major gamma wall with significant options positioning. Because price was trapped inside this range, we explained that we would avoid initiating new positions until the market committed to a directional breakout. As a result, we stayed on the sidelines on Monday.
On Tuesday, the breakout finally arrived. Members inside the UA CAPITAL Trading Desk were immediately notified through our chat, and we entered intraday scalp positions across SPY, QQQ, and Nasdaq futures. The trade was closed the same day for a solid profit ahead of Wednesday's Employment data.
The execution was confirmed using SPY while both SPY and QQQ positions were managed together through our CC Model. We entered around 743.5 and exited near 747.5.
The CC Model has become one of the most valuable execution frameworks inside the Trading Desk. By combining confirmation from correlated indices instead of relying on a single chart, it significantly improves trade quality while filtering out many false breakouts. If you have not read about it yet, I previously published a dedicated TradingView post explaining the complete framework.
On Wednesday we intentionally stayed flat. Thursday's Non Farm Payroll report represented a major macro event, and we believed preserving capital until the uncertainty cleared was the higher probability decision.
The only positions we opened were VIX call options as portfolio hedges against our existing spot holdings and swing long positions. After the employment report came in stronger than expected on Thursday morning, we exited those VIX calls for a small loss since the sharp selloff we had hedged against never materialized. That loss simply became the cost of insurance, which is exactly how proper portfolio hedging should work.
The stronger employment report pushed markets modestly higher during Thursday's premarket session. Since none of our predefined index scenarios were triggered, we avoided index trades entirely.
Instead, we shifted our attention toward equities.
Equities Play
Over the past week I explained that capital was likely rotating out of semiconductors and memory names into large cap technology. This rotation unfolded almost exactly as anticipated.
In Thursday's premarket update, I informed the Trading Desk that I planned to build long exposure in AAPL, MSFT, and GOOGL.
At the market open we executed exactly that plan.
Our AAPL and MSFT positions generated strong profits, while GOOGL was stopped at breakeven.
AAPL rallied approximately $13, delivering a gain of around 4.4%.
MSFT advanced roughly $6, producing a gain of approximately 1.6%.
The profits generated from these large cap positions more than justified avoiding unnecessary index exposure.
Meanwhile, semiconductor names such as MU sold off exactly as expected. However, most of the decline occurred during premarket trading, preventing attractive short entries after the open.
Overall, it was another successful week. Although the Risk Index continued to anticipate a potential retracement, the stronger than expected NFP report temporarily relieved downside pressure. Instead of forcing index trades, we adapted to changing market conditions and generated profits through sector rotation, while also capturing a successful SPY breakout trade earlier in the week.
This Week's Scenarios / Prediction
Risk Index
This oscillator reads macro conditions and converts them into a technical risk framework. It was developed internally at UA CAPITAL and remains the primary indicator I use for both short term and long term positioning decisions.
The Risk Index is currently signaling a neutral to slightly bearish short term outlook. Additional downside remains possible over the near term. However, the longer term structure continues to remain firmly risk on, meaning bullish opportunities are still expected once price reaches our higher probability demand zones.
Our approach this week remains straightforward. We will primarily look for short opportunities from the designated swing area while remaining prepared to buy confirmed reactions from our key demand levels. The long term bias continues to favor the bulls.
Scenarios / Strategies
Short Scenario
Swing Area (730)
This level also represents a major Call Wall where sellers may become active.
Trigger: Price retests the area and produces a bearish one hour rejection close.
Targets: 725 → 720 → 716
Invalidation: Hourly close above 735.
Long Scenario 1
KEY Level 1 (716)
This is the first major demand zone. If price reaches this level and confirms support, call options can be used to establish long exposure.
Trigger: Price reaches the level and produces a bullish hourly close back above the zone.
Targets: 720 → 724 → 729
Invalidation: Hourly close below 710.
Long Scenario 2
Put Wall (700)
Trigger: Price reaches the level and produces a bullish hourly close back above the zone.
Targets: 704 → 709 → 715 → 720
Invalidation: Daily close below 700.
Long Scenario 3
KEY Level 2 (692) This is the second major demand zone. If price reaches this level and confirms support, call options can be used to establish long exposure.
Trigger: Price reaches the level and produces a bullish hourly close back above the zone.
Targets: 700 → 704 → 709 → 715
Invalidation: Daily close below 681.
Position Management Rules
1. Entry model: Aggressive entry after a one hour candle close above or below the designated level. Conservative entry after a daily candle close above or below the designated level.
2. Take profits in stages because market reversals can happen quickly.
3. After the first target is reached, move all remaining stop losses to breakeven and convert the position into a risk free trade.
4. A reaction from the level must be confirmed. We do not predict price. We react to price.
5. A daily close below the designated bounce zone equals stop loss.
Notice: Starting a fresh, high frequency track record for SPY, QQQ, and core equities on TradingView. Moving forward, all institutional research, weekly outlooks, and mid week updates will be tracked consistently right here.
This analysis is for educational purposes only and reflects my personal opinion. It is not financial advice.