ETF market
Market Analysis - June 7th 2026I didn't post an update last week since little had changed since the prior update. Friday's session was interesting. The session produced a persistent downward movement, however it did not meet my criteria for a long volatility trade (long puts) for several reasons.
1. 0dte options chain did not show any clear dealer edges. Put/Call volume across strikes was stable.
2. My Volatility indicators showed that Volatility was already priced high when the market opened and did not reprice decisively enough to suggest true dealer rotation.
3. Futures re-hedged prior to the open, the imbalance was already gone.
4. Raw Put/Call ratio was subdued
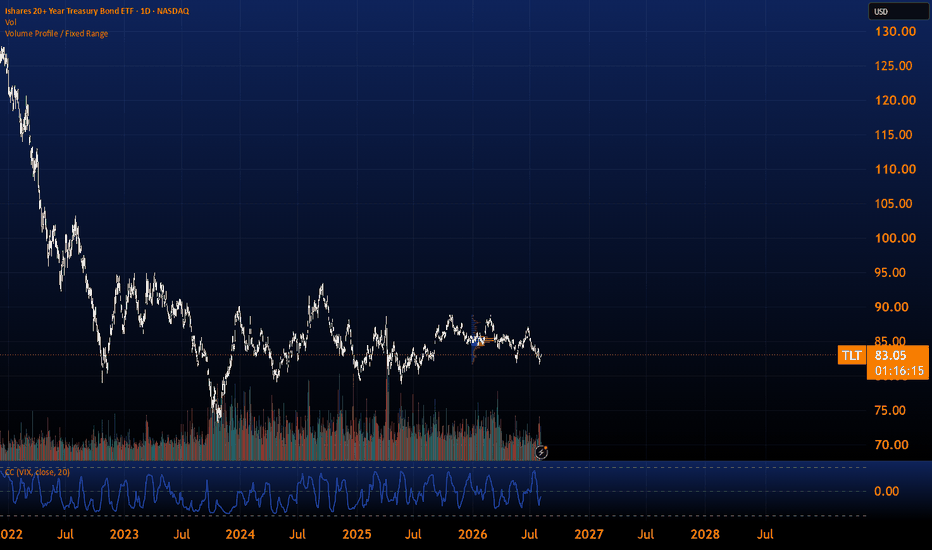
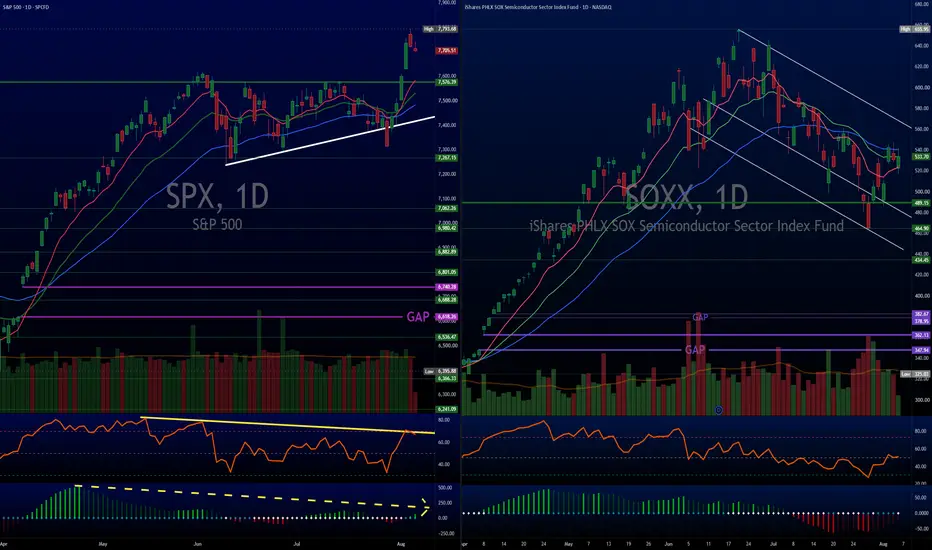
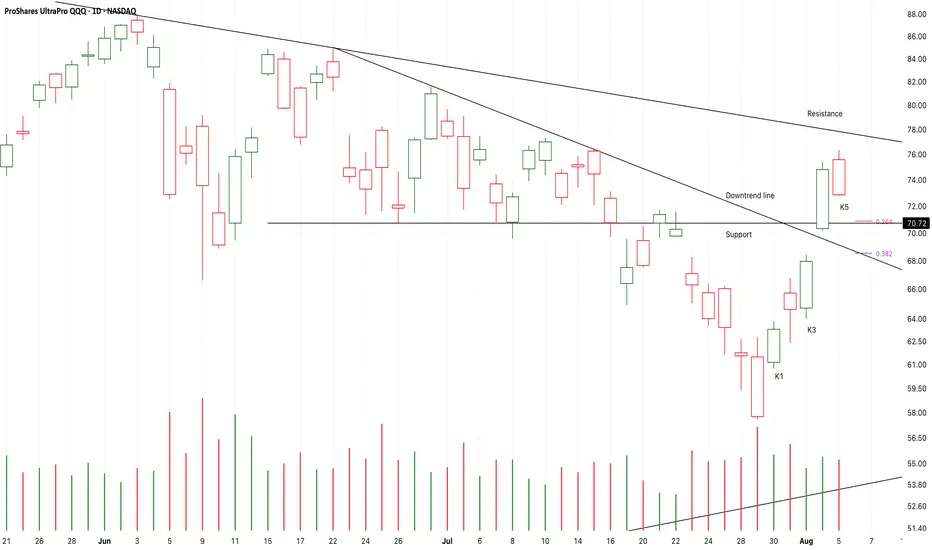
Still, the session produced a move that was consistent with the Macro regime (weakening treasury demand, strong dollar), making it worth watching for signs of continued weakness and a change in dealer behavior. Equities are reacting late, so it is possible that Macro improvement in the short run can support continued equity strength, so I will be watching tech AMEX:XLK closely for any signs of support.
If the options chain starts of show signs of liquidity concentration on days where the market has room to move, I will be looking to day trade long puts.
Macro Dashboard
FX Dashboard
Stock Dashboard (Long Alpha)
Volatility Dashboard (Long Vega)
SPY June 18: Will 733 Hold or Break?
SPY enters June 18 sitting directly on a critical support zone after one of the sharpest selloffs in recent weeks. The market lost multiple support levels in a short period of time, and sellers remain firmly in control heading into tomorrow's session.
The recent breakdown below the 758 High Volume Level completely shifted market structure. While price has found temporary support near 733-735, the broader trend remains bearish until buyers can reclaim major resistance overhead.
Technical Structure
The 15-minute chart shows a clear bearish trend with lower highs, lower lows, and persistent downside momentum. After failing near 758, SPY lost support at 755, then accelerated lower through multiple support zones without meaningful buyer participation.
The selloff eventually pushed price into the current 733-735 support region, where buyers have finally attempted to stabilize the decline.
Volume expanded significantly during the breakdown, suggesting institutional selling rather than normal profit-taking activity.
As long as SPY remains below 748 and especially below 758, bears maintain control of the short-term trend.
Key Levels to Watch
Support
733.00
730.00
725.00
720.00
Resistance
740.00
742.00
743.00
745.00
748.00
758.00
763.00
765.00
770.00
Positioning Map Breakdown
The positioning map shows SPY trading directly above the major support zone at 733.00, making this the most important level heading into June 18. This area currently represents the final major support before the next downside target near 730.
The most important control level remains the 758.00 HVL (High Volume Level). This level previously acted as support but has now become major resistance following the breakdown. For bulls to regain momentum, SPY must eventually reclaim and hold above 758. Until that occurs, rallies are likely to be viewed as relief bounces within a larger bearish structure.
Above current price, resistance begins near 740, followed by a heavy resistance cluster between 742 and 748. This entire zone is packed with positioning resistance and will likely attract sellers on any bounce attempt. Above that sits the HVL at 758, followed by larger upside targets at 763, 765, and 770.
Below current price, support sits at 733, followed by 730. If sellers successfully break 733, the positioning map suggests downside momentum could accelerate because support becomes increasingly limited underneath current levels.
The battle between 733 support and 748 resistance will likely determine SPY's next major move.
Bullish Scenario
Bulls need to defend the 733 support area and quickly reclaim nearby resistance.
A move above 740 would be the first sign that selling pressure is slowing. Continued strength above 742, 743, and 745 could trigger short covering and open the door toward 748.
If buyers reclaim 748, momentum could improve significantly and potentially target the HVL at 758.
Bullish Targets
740.00
742.00
743.00
745.00
748.00
758.00
Bearish Scenario
The current trend remains bearish.
Failure to hold 733 would likely bring immediate pressure toward 730. A breakdown below 730 could expose 725 and potentially 720.
If sellers remain aggressive, SPY could experience another wave of liquidation as bears maintain control of the trend.
Bearish Targets
730.00
725.00
720.00
Trading Plan
For Calls:
Wait for SPY to reclaim 740 and hold above that level. Additional confirmation would come from a move above 742 and improving volume. Aggressive traders may attempt a bounce from 733, but confirmation remains important given the strength of the current downtrend.
For Puts:
As long as SPY remains below 748, bears retain the advantage. A clean break below 733 could provide continuation opportunities toward 730 and lower. Strong selling volume on a breakdown would strengthen the bearish case.
Final Thoughts
June 18 is shaping up to be a critical session for SPY. The market is sitting directly above a major support zone while the broader trend remains bearish.
The key battle zone sits between 733 support and 748 resistance. Bulls need to defend support and reclaim the resistance cluster to shift momentum back in their favor. Bears will focus on breaking 733 and extending the decline toward 730, 725, and potentially 720.
The first reaction around the 733 support area will likely provide the clearest clue regarding the market's next directional move.
XOVR: Manipulation Before ExpansionNASDAQ:XOVR is showing a clean weekly bullish continuation setup.
The chart is not interesting because price is simply moving up. It is interesting because of how price behaved before the current push.
We had an active bullish sequence, with the projected ABC target still sitting above price. That means the move has room left if buyers continue to defend the structure.
After the sequence became active, price corrected back into the BC area and created a descending corrective channel. This is where many traders usually get trapped. Some buy too early at the first reaction. Others short the breakdown once the correction looks heavy.
But the cleaner signal came after price manipulated the main trendline area, respected the deeper reaction zone, formed a breaker block, and then broke out of the corrective channel.
That matters because the channel break shifts the chart from “possible bounce” into a stronger continuation structure.
My read is simple:
Price formed an active bullish sequence.
Price returned into BC.
Trendline liquidity was manipulated.
A breaker block formed.
The corrective channel broke.
The ABC target remains unreached.
As long as price holds above the protected structure, I’m watching for continuation toward the liquidity draw first, then the higher ABC target zone.
I’m not interested in chasing a weekly candle after the breakout. The cleaner opportunity would be a controlled pullback into the breaker / value area, where risk can be defined properly and the reward still makes sense.
For me, this setup is about patience. I don’t want the first obvious trendline touch. I want the manipulation, the reclaim, the breaker, and then the channel break.
Liquidity first. Confirmation second. Entry last.
Not financial advice — just my chart study.
SPY FREE SIGNAL|LONG|
✅SPY swept sell-side liquidity into a major ICT demand level and tapped a discount array. A bullish displacement from this zone could target nearby inefficiencies and resting buy-side liquidity overhead.
—————————
Entry: 736.41$
Stop Loss: 731.49$
Take Profit: 743.12$
Time Frame: 4H
—————————
LONG🚀
✅Like and subscribe to never miss a new idea!✅
Weekly Bias — 8 JuneAll 3 indices produced the same pattern simultaneously, which significantly increases the odds this was a meaningful institutional distribution event
Long-duration growth vs 10Y yields rolled over sharply
VIX exploded +40%, breaking above its 10-day average
NDX/VXN ratio collapsed, showing volatility expanded faster than price fell
SMH/QQQ remains in a secular uptrend, but posted a meaningful reversal from an extreme relative-strength peak
This looks more like a positioning flush/de-grossing event than the beginning of a bear market
NASDAQ:QQQ printed new swing high near $748.65
Immediate rejection
Large bearish displacement candle
Close below the 10d MA
Clear liquidity sweep → MSS (market structure shift)
Bulls chased the breakout above prior highs & were trapped
If $690 breaks, dealers likely chase downside toward $670–$650
Volume ~100M shares
Largest volume in weeks
Tells us this was distribution volume, not normal profit-taking
RSI collapsed from 70+
Stochastic collapsed from overbought
MACD histogram accelerated lower
Momentum deterioration is occurring faster than price
That is a short-term bearish divergence confirmation
Resistance
$722
$740
ATH
Support
$705 (78.6%)
$694
$669 (61.8%)
$652 (50%)
Fair Value
Current fair value area $693-$705
Aligns with 78.6% retracement, prior breakout area & dealer gamma concentration
AMEX:SPY structure is slightly healthier than NASDAQ:QQQ
AMEX:SPY remains above 50d MA
Major trend support, so the higher timeframe remains bullish despite the sharp reversal
Resistance
$742
$746
$760
Support
$730
$714
$697
AMEX:IWM failed at $292.74, swept highs & immediately reversed → bull trap
If AMEX:IWM loses $274, expect broader risk-off behavior
Support
$281
$274
$266
Mega-cap leadership is revealing
NASDAQ:GOOGL — only major name that recovered intraday
Relative strength leader
NASDAQ:WMT — defensive money rotating-in
Institutional safety trade
NASDAQ:AVGO — still dealing with earnings damage
Semis remain under pressure
NASDAQ:TSLA — most vulnerable chart
NASDAQ:NVDA — still stronger than NASDAQ:AVGO , but momentum rolling over, failed near highs & RSI & MACD deteriorating
NASDAQ:SMH massively outperformed for months
Semiconductor leadership is being harvested
Institutions are taking profits
Relative momentum likely cools for several weeks
Likely leadership rotation
The market is paying for downside protection
NASDAQ:QQQ ATM IV ~26.7%
Puts are carrying slightly richer demand
Downside protection is being purchased
Definitely not upside chasing
AMEX:SPY ATM IV ~14.5%
Very modest skew
Institutional hedging exists, but not extreme
AMEX:IWM ATM IV ~21.5%
Skew appears balanced
VIX 16 → 22+
Nearly 40% spike
This is a volatility expansion regime
Long premium becomes more attractive
Short premium becomes less attractive
Bullish (60%)
Initial panic lower
Test $700 NASDAQ:QQQ , then stabilization
Bounce into $715-$722
Followed by another decision point
Bearish (25%)
Lose NASDAQ:QQQ $690, then target $670–$652 rapidly
Immediate reclaim $722 NASDAQ:QQQ & $742 AMEX:SPY (15%)
If that occurs, Friday becomes a failed breakdown
Then highs can be retested
Given VIX expansion, large volume flush & support near $700
The highest expectancy setup is not chasing puts after a 5% drop unless NASDAQ:QQQ closes below $690
Instead, bullish mean-reversion from NASDAQ:QQQ $695-$705
Target $720-$725
Invalidation on a daily close below $690
Then target $670–$652 with stop back above $705
Friday's move was confirmed by volume, RSI, MACD, VIX expansion & deterioration in the growth-vs-yields relationship; however, the HTF remains intact while NASDAQ:QQQ holds $690-$700, which makes this area the most important level for the coming week & a successful defense likely produces a reflex rally, while a failure opens the door to a much deeper retracement toward $670-$650
GLD Week of June 8See levels and key areas for this week:
After you click the link, click “Grab this Chart” at the bottom/right of the chart or Load Live Bars on far middle-right.
“Grab this Chart” opens a copy of the chart environment, but it doesn’t automatically save as a permanent layout in your dashboard. Once the chart opens, you need to manually save it as your own layout by clicking the cloud/save icon at the top of TradingView , “Save As”, name the layout. After that it will show up in your saved layouts/dashboard going forward.
USO Week of June 8See levels and key areas for this week:
After you click the link, click “Grab this Chart” at the bottom/right of the chart or Load Live Bars on far middle-right.
“Grab this Chart” opens a copy of the chart environment, but it doesn’t automatically save as a permanent layout in your dashboard. Once the chart opens, you need to manually save it as your own layout by clicking the cloud/save icon at the top of TradingView , “Save As”, name the layout. After that it will show up in your saved layouts/dashboard going forward.
SMH Week of June 8See levels and key areas for this week:
After you click the link, click “Grab this Chart” at the bottom/right of the chart or Load Live Bars on far middle-right.
“Grab this Chart” opens a copy of the chart environment, but it doesn’t automatically save as a permanent layout in your dashboard. Once the chart opens, you need to manually save it as your own layout by clicking the cloud/save icon at the top of TradingView , “Save As”, name the layout. After that it will show up in your saved layouts/dashboard going forward.
Always Keep an Eye on the Volume: A Tip for New Traders📊 Always Keep an Eye on the Volume: A Tip for New Traders
Hey everyone! 👋
When you start trading, it’s easy to get blinded by flashing price charts and complex indicators. But there is one foundational tool that tells you the *truth* behind any price move: **Volume**.
Think of price as the car, and volume as the fuel. A car can’t go far without gas, and a price trend can't sustain itself without volume.
### Why Volume Matters (The Core Concept)
Volume represents the total number of shares or contracts traded during a specific time. It tells you how much "institutional weight" or smart money is behind a move.
### 💡 Two Practical Rules for Beginners:
1. **The Breakout Confirmation (High Volume):** If the price breaks above a major resistance level on **high volume**, it means big players are buying. This is a high-probability trade.
2. **The Fakeout Warning (Low Volume):** If the price breaks a level but volume is **very low**, be careful. It’s likely a "bull trap" or "bear trap." The move will likely fail because there is no fuel behind it.
> **Key Takeaway:** Never trust a price breakout that happens on low volume. Always wait for volume validation.
---
### 🛠️ Your Action Step for Today
Open up your current chart on TradingView, press **Indicator (fx)**, and search for **"Volume"** (the built-in version). Look at your last three trades—did the volume support your entry?
Let me know in the comments below if you've ever been caught in a low-volume fakeout!👇
#TradingTips #TechnicalAnalysis #Volume #BeginnerTrader #PriceAction
SPY: Long Signal Explained
SPY
- Classic bullish setup
- Our team expects bullish continuation
SUGGESTED TRADE:
Swing Trade
Long SPY
Entry Point - 737.47
Stop Loss - 733.35
Take Profit - 744.77
Our Risk - 1%
Start protection of your profits from lower levels
Disclosure: I am part of Trade Nation's Influencer program and receive a monthly fee for using their TradingView charts in my analysis.
❤️ Please, support our work with like & comment! ❤️
SPY Structure Update (Daily Chart)SPY remains in a constructive trend environment despite today's pullback, with the broader moving average structure continuing to hold.
The 10, 20, 50, and 200 EMAs remain positively aligned
Price continues to trade above all major moving averages, keeping the larger trend structure intact
While short-term momentum has weakened, the overall trend remains constructive until key support areas begin to fail
Momentum conditions have cooled:
RSI is currently near 49, reflecting a notable loss of short-term momentum following the recent decline
The move from overbought conditions back toward the midpoint suggests momentum is being reset rather than fully rebuilt
OBV has begun to pause, showing slight downward pressure, though participation has not yet deteriorated into a meaningful distribution phase
This creates a structure where trend remains constructive, but momentum and participation warrant closer monitoring.
What I'm Watching 👀
Whether RSI can stabilize and begin rebuilding from current levels
If OBV can hold recent gains or begins showing deeper signs of distribution
How price reacts around the rising 10, 20, and 50 EMA support cluster
Whether participation returns on any recovery attempt or continues to weaken
At the moment, the broader trend remains intact, but momentum has clearly cooled. The next clues will likely come from how RSI and OBV behave as price interacts with key support areas.
⭐ Final Clarity Note ⭐
This is a structure-based observation, not a prediction — focused on trend alignment, momentum behavior, participation, and liquidity positioning across key structural levels.
SPY - Long term movement probably projectionCorrections could be in sight.
(DYDD)
There could be a correction in sight with some retrace in the making.
Three support levels are mentioned where the pullbacks could head towards.
Looking at shorts in the meanwhile on the possible retrace till it reaches target levels.
XLE downtrend until june 19th 2026None of this is facts, it is all the creation of my brain, this is not financial advice, this is just me looking at numbers and creating stories that may or may not actually happen.
Thesis:
Trump wants to reduce the weight of the 39T debt, how? Can't pay it back so what then? Reduce the value of the debt!
How? By creating and maintaining higher inflation... so that the debt loses it's value.
Ok. What raises prices thus inflation? Tariffs and oil prices.
Ok tariffs done, mess up oil supply, Venezuela, Canada, Iran done.
Now how to control interest rate levels, be chummy with the FED.
Result, inflation is high while low or stable interest levels.
Low interest and high inflation = money needs to be invested as stocks rise with inflation while money loses value.
Huge inflow in the economy from people pulling money out of money markets... euphoric uptrend resumes, feeding into all the crazy IPOs until January... when things can violently turn around.
...
So, what does this mean for XLE? well... price drops = euphoric market as "fears" of interest rate hikes drop...
Technicals... well head and shoulder pattern detected... coinciding with the biggest IPO in history and the new fed chair going in... so this CANNOT go up or else the whole playbook dies and all hope goes in the drain.
XLE dropping = massive inflow into SPCX and markets... 15th June FED meeting confirms rate unchanged... euphoria once more.
June 19th ish... end of the downfall of oil... slow reversal as the markets realize the oil shortages... but still no fear yet as rates will remain unchanged...
then comes September/October... possible market drop again... Then Halloween effect then switch into Christmas rally...
Then if inflation is too high 6-7-8-9-10%+, the fed will have no choice but to start raising rates.
Retail traders will say... I SAW THIS BEFORE IN JUNE HA HA I WILL BUY THE DIP... and smart money will gladly sell their shares into retail strength...
I cannot see further than that but I could also be massively wrong and ignorant about element X or Y or Z which I cannot know or foresee in advance since I'm just a little peon in the game.
Quant Perspective: Downtrend Phase Over — waiting for "Buy"**Post-Market Banter | June 5, 2026 | Teahouse Keeper Edition**
--- AMEX:SOXL NASDAQ:QQQ CBOE:DRAM AMEX:IWM
## 1. Tonight’s Tape: Green Panic, Red Pain
Friday's close made me double-check if my phone was in eye-comfort mode.
- **SPY** -2.6% (polite)
- **QQQ** -4.77% (faceplant)
- **NVDA** -6.16% (leather jacket couldn't absorb the hit)
- **KORU** -41.89% — This isn't a drop. This is falling off a building, missing every ledge, and hitting a power line on the way down.
But the most dramatic move was **VIX** spiking nearly 29% to close at 21.51. Meanwhile, **SVIX** (short VIX ETF) cratered -6.97%. Adding insult to injury, **SPLV** (low volatility ETF) gained +1.42% — the only broad-based green on the screen.
**Teahouse take:** When SPLV is the MVP, smart money is hiding. When VIX surges and SVIX collapses, vol bulls are betting on more fear. Translation: **Not yet panic, but everyone's already looking for the exit.**
---
## 2. Quant Perspective: Downtrend Phase Over — But Don't Scream "Buy"
The hottest quant chat this week isn't which model made bank, but **"We covered shorts. Now what?"**
Multiple quant strategies reportedly fully closed short positions by Friday afternoon. Risk desks are slowly tilting long — but haven't hit the gas. Current status: **Sitting in cash, watching. Not full risk-on.**
That distinction matters. "Downtrend over" means shorting now has poor risk/reward. "Sitting in cash" means no long signal yet. This is a "can't fall much further" bet, not a "we're going up" bet.
Models auto-took profits on Friday's drop. When vol explodes and price deviates too far, trend followers naturally exit shorts. Not because algos understand Powell better than you — but because price action hit their exit rules.
**Teahouse translation:** Quant says "short chapter closed" — not "bull market is back." Think of a boxing round ending. Both sides go to their corners. Whether the next round is more pain or a comeback depends entirely on the referee (the Fed).
---
## 3. NFP "Shocks" the Street: Fed Civil War Erupts
The sole villain of tonight's story: **the blowout NFP report**.
- **May nonfarm payrolls:** +172,000 (vs. +80,000 expected)
- **Unemployment rate:** 4.3%
Markets froze. So much for "economy slowing" and "Fed rescue cuts."
**Then the Fed started fighting in public:**
- **Hammack (hawk):** "It may soon be appropriate to act on rates."
- **Hassett (dove, WH advisor):** "Fed shouldn't hike — still room to cut."
The White House and Fed openly bickering — better than *House of Cards*. Traders immediately pulled forward rate-hike expectations from March to January.
**Teahouse gossip:** New Chair Kevin Warsh debuts June 17. The first dot plot could flip the table. Morgan Stanley warns June FOMC may be the biggest FX catalyst of the year. The market's real fear isn't "no cut" — it's a **sudden hawkish hike**, because this NFP gives the Fed plenty of ammo.
---
## 4. Korea "Crash": KORU -42% — Accident or Inevitable?
Looked at **KORU -41.89%** three times. Not a decimal error.
- **KOSPI** plunged another **12.06%** Friday (after -7.24% Thursday) — **largest single-day drop in history**.
- Samsung Electronics -20%+ over two days.
- SK Hynix crushed.
- KRW/USD at **lowest since 2009**.
**Why?**
1. **Tech weight problem** — Samsung + SK Hynix = ~40% of KOSPI. Semiconductors sneeze, Korea goes to ICU.
2. **US-Iran stalemate** — Risk-off zero.
3. **Leveraged ETF death spiral** — KORU is 3x. Index down ~20% in two days → leverage decay + panic discount → -40% horror show.
**Teahouse gossip:** Jensen Huang lands in Korea *tonight*. Schedule says BBQ with tech leaders to talk AI, plus his first variety show appearance. Is he putting out fires or pouring gasoline? Korean bagholders staring at KORU might find that BBQ hard to digest. Meanwhile, SK Group chairman just met TSMC's C.C. Wei — both agreed to deepen next-gen HBM and advanced packaging cooperation. Great news — but the stock already collapsed. Too little, too late.
---
## 5. Semiconductor "Massacre": Broadcom Gets 100% — Wall Street Wants 200%
**SOXL** (3x semiconductor long) -30.78% — joined KORU in the loser's lounge. The Philadelphia Semiconductor Index itself dropped nearly 6%, levered up to 30%+.
But tonight's top billing doesn't go to NVDA. It goes to **Broadcom (AVGO)**.
AVGO fell 12%+ post-earnings (down over 14% pre-market). Why? AI semiconductor revenue +143% YoY. Q3 guide $16B (+200% YoY). Full-year AI chip sales guide $56B. **And Wall Street threw them out anyway.**
**One reason only:** Wall Street doesn't want 100%. It wants 200%.
CEO Hock Tan merely *reiterated* the FY2027 >$100B AI revenue target — no raise. In the five weeks pre-earnings, AVGO rallied >65% from lows, adding >$300B in market cap. Any guide below "full-spectrum blowout" triggers profit-taking.
**Teahouse take:** Deutsche Bank, Citi, GS, JPM — all 41 firms kept ratings, some raised targets. DB even upped PT to $515 (from $430), calling this a "communication-driven pullback." But markets don't care. In a high-valuation environment, "good but not great" is a sin. Broadcom's fate tells you one thing: **AI chip's "golden narrative" has reached the stage where only beating expectations keeps you alive.**
---
## 6. Gold, Silver, Crypto: All on Their Knees
NFP + rate-hike expectations = nightmare for all zero-yield assets:
- **Silver** -7%
- **Gold** -3% (spot below $4,400)
- **Bitcoin** -5%
- **Ethereum** -10%
**SLV** -8.08% (even worse than gold). Simple logic: US dollar and Treasury yields rip higher → zero-yield assets get dumped. Add a UK internal report warning oil may stay at $100 through 2028, and inflation fears refuse to die → real rates rise → precious metals double-smashed.
**Teahouse gossip:** The Boston Fed just published research saying oil's damage to the US economy is much smaller than in the 1970s. Curious timing — paving the way for hikes? If oil shocks aren't so scary anymore, the Fed has more room to act.
---
## 7. Weekend Banter Bites: SpaceX, Apple, Tesla, and the US Gov Buying AI Stocks?
Markets got crushed, but weekend gossip didn't stop:
1. **SpaceX & Google cloud deal** — includes 110k Nvidia GPUs, CPU, memory. Morgan Stanley projects SpaceX revenue reaching **$3.4T by 2040**. But Rob Arnott warns: mega-IPOs (SpaceX, Anthropic, OpenAI) will drain liquidity from other stocks for years.
2. **Anthropic IPO sprint** — easing tensions with Trump administration, accelerating listing.
3. **US government to buy AI company stakes?** — Rumor: Washington considering taking equity in major AI firms via "voluntary" transfers, with returns funding public goods. If true, OpenAI and Anthropic valuation models need rewriting. **National team stepping in — bullish or bearish?**
4. **Apple AI pivot** — New Siri reportedly uses Google Cloud + Nvidia Blackwell B200. WWDC 2026 next week — Apple looks ready for a big AI move.
5. **Tesla Robotaxi truly driverless** — Barclays notes Tesla removed safety monitors from some Austin Robotaxi fleets. Stock didn't react (+ down 1.24% Thursday).
6. **JPMorgan flips on Tesla** — longtime bear quietly swapped analysts. New analyst tripled the price target. Musk one step closer to trillionaire status?
7. **Dell major shareholder exits** — Silver Lake affiliate dumped ~$72M of Dell stock June 2. Great AI server story — but not great enough to stop PE from cashing out.
---
## 8. Monday Outlook: Three Scenarios After the Downtrend Ends
Quant short phase is over. But bounce or chop? Teahouse Keeper sees three scripts:
### Scenario A: Low-open, High-close (60%)
- Monday opens -0.5% to -1% (digesting Korea + NFP aftershocks)
- Algorithmic buying steps in → quant short-covering vacuum gets filled
- SPY support 735-737 → rebound target 745-750 (Thursday's high zone)
- **Rationale:** Oversold RSI, short phase ended, NFP bad news priced into Friday's 4.77% drop in QQQ
### Scenario B: Low-open, Low-close (30%)
- KOSPI opens another 5%+ lower
- Fed officials keep hawkish weekend chatter
- SPY opens -1% with no bounce → tests 730
- **Rationale:** Korea problems unresolved, June 17 FOMC uncertainty weighs, VIX >25 kills bounce scripts
### Scenario C: High-open, High-close (10%)
- Weekend surprise catalyst (e.g., US-Iran breakthrough, Jensen drops a bombshell)
- SPY opens +1%+ → trends higher all day
- **Rationale:** Pure luck. Don't bet on it.
---
## 9. Key Monday Levels: First 30 Minutes Decide Everything
| Observation | Bullish Signal | Bearish Signal |
|---|---|---|
| **KOSPI** | Stable/rebound at open | Opens -3%+ |
| **VIX** | Opens high, fades below 20 | Rips above 25 |
| **SPY 735 support** | Touches then bounces | Breaks with volume |
| **Semis (NVDA/AVGO)** | Low open, high close | Continues dumping, no bids |
| **10Y Treasury yield** | Falls (cut hopes return) | Rips to 4.5%+ |
**Teahouse pre-market plan:**
- If SPY opens near 735 and Korea isn't crashing → small long test, stop at 733
- If VIX opens above 25 → sit on hands, don't catch knives
- If SPY gaps up → wait for a pullback, don't chase
---
## 10. Final Word: "Downtrend Over" Is a Flashlight, Not a Searchlight
Friday's tape was simple: **NFP lit the fuse on every bearish story.** But when markets fall, bad news gets amplified. When they rise, bad news gets ignored.
**SPLV +1.42%** → smart money hiding. **SVIX -6.97%** → vol bulls betting on more fear. Combined: not yet despair. Real bottoms often come when **VIX spikes to 30+ and everything sells off indiscriminately**.
Quant says "downtrend phase over." That's not a "buy the dip" horn. It's a "stop shorting" warning. The market is like walking through a dark forest with a torch. You don't know if ahead is prey or predator. But you do know that anyone still short is probably walking in front of the algos.
If Monday bounces, **take the gift**. SPY 745-750 is heavy resistance (Thursday high + moving averages). If it gets there on weak volume → trim. True trend longs wait for June 17 FOMC clarity **or** VIX >30 "extreme panic" levels.
**Final teahouse saying:**
> "When KORU drops 40%, you think it's buying the dip. But it's actually liquidating your kitchen. When Broadcom scores 100% and gets kicked out, it means Wall Street switched to a 200-point grading scale. Quant says the downtrend is over — you can believe that. But quant never tells you when the uptrend starts. That part, you have to guess yourself."
Have a great weekend. And Monday morning — steady hands. ☕️
---
*Disclaimer: This is purely the Teahouse Keeper's banter, based on public news and market gossip. Not investment advice. Markets are risky, bottoms are slippery.*
Stock Market Forecast | BTC TSLA NVDA AAPL AMZN META MSFT0:00 - Market Update Intro: QQQ, SPY, Bitcoin & Mag 7
An overview of this week's technical analysis layout covering the major stock market indices, crypto, and mega-cap tech sectors.
0:13 - Macro Overview & Market Data Analysis
Analyzing critical market data including sector rotation, dark pool prints, economic catalysts, and the latest AAII sentiment metrics.
5:03 - QQQ Chart Technical Analysis CME_MINI:NQ1!
Breaking down the QQQ tech ETF chart to see if bears can confirm a daily head-and-shoulders pattern or if a healthy weekly consolidation is underway.
7:45 - SPY Chart Technical Analysis CME_MINI:ES1!
Examining the SPY S&P 500 ETF price action to locate major support zones fueled by defensive sector rotation into healthcare and financials.
8:26 - Magnificent 7 Overview
A strategic look at the broader Mag 7 index weightings to determine if mega-cap tech support levels can keep the overall market afloat.
8:46 - Bitcoin (BTC) Technical Analysis
Unpacking Bitcoin's failed channel breakout, high-volume relative weakness, and potential liquidity grab on the monthly macro time frame.
11:56 - Tesla (TSLA) Stock Chart
Pinpointing the key 380 support level on the Tesla stock chart after a heavy Friday drop to see where bulls might step in for a bounce.
13:13 - Meta (META) Stock Analysis
Evaluating Meta's chart structure and the recent capex spending rumors regarding stock offerings that triggered a 5.5% pullback.
14:36 - Amazon ( NASDAQ:AMZN ) Stock Chart
Analyzing Amazon's weekly bull flag breakdown and mapping out the core horizontal support levels down to the 236 zone.
16:01 - Microsoft (MSFT) Stock Analysis
Tracking Microsoft's failed breakout above the 430 resistance level and what it means for major software sector momentum.
17:14 - Google (GOOGL) Stock Chart
Assessing Google's healthy chart retracement and gap-fill range following the market panic over equity offering news.
18:14 - Apple (AAPL) Stock Analysis
Highlighting Apple's clear relative strength and continuous uptrend structure as the market rewards its lower AI capex strategy.
19:00 - Nvidia (NVDA) Stock Chart
Locating the absolute must-hold 200 support channel on the Nvidia stock chart to gauge the long-term health of the semiconductor sector rally.
Renaissance IPO ETF: Bull Hits A WallThe Renaissance IPO ETF is a thematic exchange-traded fund that tracks the performance of the largest and most liquid newly public U.S. companies before they are added to major core indices.
It offers a diversified, rules-based approach to investing in the U.S. IPO market, eliminating the risk of single-stock ownership.
Strategy and Methodology
Selection: Captures the biggest and most economically significant newly listed U.S. companies. New issues are added on a "fast-entry" basis (e.g., around the fifth day of trading) or during quarterly reviews.
Weighting: Weighted by float-adjusted market capitalization, with a hard cap limiting any single stock to a maximum of 10%.
Technical Points
The technique indicates that AMEX:IPO ETF has reached its key resistance, that is nearly 3 1/2 - year peak not seen since December 2021 respectively.
You must no wonder why such active IPO activity is happening now.
SPY Set To Grow! BUY!
My dear subscribers,
This is my opinion on the SPY next move:
The instrument tests an important psychological level 737.40
Bias - Bullish
Technical Indicators: Supper Trend gives a precise Bullish signal, while Pivot Point HL predicts price changes and potential reversals in the market.
Target - 746.95
About Used Indicators:
On the subsequent day, trading above the pivot point is thought to indicate ongoing bullish sentiment, while trading below the pivot point indicates bearish sentiment.
Disclosure: I am part of Trade Nation's Influencer program and receive a monthly fee for using their TradingView charts in my analysis.
———————————
WISH YOU ALL LUCK
The Ability to Trade or the Market's Throughput Capacity?The Classical View
In classical trading, liquidity is usually defined as the ability to buy or sell an asset quickly at a price close to the current market price.
The easier it is to enter or exit a position without significantly affecting price, the more liquid the market is considered to be.
In this framework, liquidity is primarily a measure of trading convenience.
The Operator's View
If the market is viewed as an order-matching system, liquidity takes on a different meaning.
Liquidity is the volume of available opposing orders sufficient to execute a trade of a given size within acceptable limits of price movement and execution time.
In this framework, liquidity becomes a measure of the market's current throughput capacity.
The classical approach asks:
How easy is it to buy or sell?
The operator's approach asks a different question:
How much volume can the market process right now?
The distinction may appear subtle, but it leads to a very different way of looking at market behavior.
Result or Mechanism?
A classical trader typically observes the outcome:
narrow spreads;
low slippage;
fast execution.
From this, a conclusion is drawn:
the market is liquid.
The operator's perspective focuses on the mechanism behind that outcome:
how much volume is available in the order book;
how that volume is distributed;
how quickly liquidity disappears;
how quickly it replenishes;
how much volume is actually available for execution.
The object of observation is no longer the price itself, but the execution process.
Liquidity vs Volume
This is perhaps the most important distinction.
In the classical view, volume and liquidity are often treated as closely related concepts.
High volume is commonly interpreted as a sign of high liquidity.
From an operator's perspective, they are fundamentally different.
Volume describes what has already happened.
Liquidity describes what can still be executed.
A market may show extremely high trading volume while simultaneously offering very little available liquidity if opposing orders have already been consumed.
Static or Dynamic?
In the classical approach, liquidity is often viewed as a characteristic of an instrument.
For example:
EUR/USD is liquid.
A small-cap stock is illiquid.
In the operator's approach, liquidity is a regime-dependent characteristic.
It can change dramatically:
at market open;
during news releases;
during consolidation;
during impulsive moves;
during low-activity periods.
The question therefore becomes not:
Is this instrument liquid?
but rather:
Is the market liquid under current conditions?
Visible vs Real Liquidity
Classical analysis often assumes that visible liquidity roughly reflects actual liquidity.
From an operator's perspective, this assumption can be dangerous.
Displayed volume may:
disappear before execution;
represent only part of the available interest;
be significantly smaller than hidden liquidity.
As a result, liquidity analysis must consider:
order lifetime;
cancellation rates;
hidden liquidity;
actual executed volume versus displayed volume.
Liquidity and Price Movement
In the classical approach, liquidity is usually treated as a market characteristic.
In the operator's approach, liquidity becomes one of the drivers of price movement.
Price does not move simply because the market "wants" to move higher or lower.
Price moves when the rate of liquidity consumption exceeds the rate of liquidity replenishment.
This is not the perspective of a market analyst.
It is the perspective of an operator observing the mechanics of execution.
Conclusion
Both approaches describe the same phenomenon, but from different levels of abstraction.
The classical approach views liquidity as the ability to execute a trade quickly near the current market price.
The operator's approach views liquidity as the market's current throughput capacity and focuses on the mechanisms that allow that capacity to expand, contract, disappear, or recover.
The difference is not merely semantic.
It is the difference between observing the outcome and understanding the process that produces it.
SPY | 26' Q2 | May | Day Charttop down analysis from yearly timeframe to Daily Timeframe.
All levels of interest are color coded line and label.
Some labels will be a different color from the line. This means the timeframe started on the color of the label and was adapted down to the lower timeframe.
Pink Vertical lines are Quarters which helps me frame the market structure and see price action better.
** T.A explained **
Multiple Time-Frame Analysis; Color Code | Strength favors the higher timeframe.
Yearly timeframe = black
Monthly timeframe = pink
weekly = grey
daily = red
4hr = orange
1hr = yellow
15min = blue
5min = green if they are shown. (Level visibility on intervals is set to timeframe the level was found on and below to keep chart view organized.)
Ranges defined
A Range = two or more consecutive color candles (2+ in a row, same color creates a range)
There are two types of ranges - Accumulation Ranges &
Distribution Ranges.
*A single candle is a range on a lower timeframe. Mark the candle and then find the range / level on a lower timeframe aka "Range Finding".
Some people use boxes and call this boxing finding the zone - supply & demand zones - and marking the entire range top to bottom. This is acceptable but introduces risk by increasing probability of orders getting filled.
Candle Science further defines the zone / range into levels. So. after finding a range, identify and label the first and last candle of the range.
This is Candle Science. Everything has a default expectation and users thinking is guided by IF/THEN statements.
Below are the default expectations for each range and the first and last candle within the range.
DISTRIBUTION RANGES:
When price is above a distribution range its default expectation is to support price accumulation.
The first distribution candle in a distribution range is labeled as the BackSide Candle (BS).
Expectation = strong reaction to price. Look for price action to create long wicks reaching to or away from level. A steep angle trend is expected to form so Fair Value Gaps are expected to form on the timeframe of the level and lower timeframes.
If a steep angle trend is not forming, and long wicks are not being created then the idea is that liquidity is not there, confidence in the level is low. Price Action may then be looking for more liquidity to and seek it out at the FrontSide Candle.
FrontSide (FS) Candle = The last distribution candle in a distribution range.
Expectation = create a low angle accumulation trend reversal.
3 bar reversal patterns laddering up
like the distribution candles are the rungs of an accumulation ladder. price uses the top side of the BackSide Candle or the top side of the FrontSide Candle as support. They are used in bull flags to break distribution trends.
IF price fails to gain a BackSide or FrontSide level THEN they act as RESISTANCE. But we will then train our eyes to look at the bottom side of Accumulation Ranges because they have a default expectation as Resistance.
When Price is below an accumulation candle, the bottom side of the accumulation candle is the level of resistance.
ACCUMULATION RANGES DEFINED:
Inverse BackSide Candle (Inv.BS) = the first accumulation candle in an accumulation range.
Expectation. = strong reaction to price. long wicks reaching to or away from level. Creates a steep angle distribution trend. Usually create F.V.G's and impulsive, volatile moves like the BackSide Candle.
Inverse FrontSide Candle (Inv.FS) = The last accumulation candle in an accumulation range.
Expectation = reversal, create a low angle distribution trend. The bottom side of the accumulation candles are used as resistance levels.