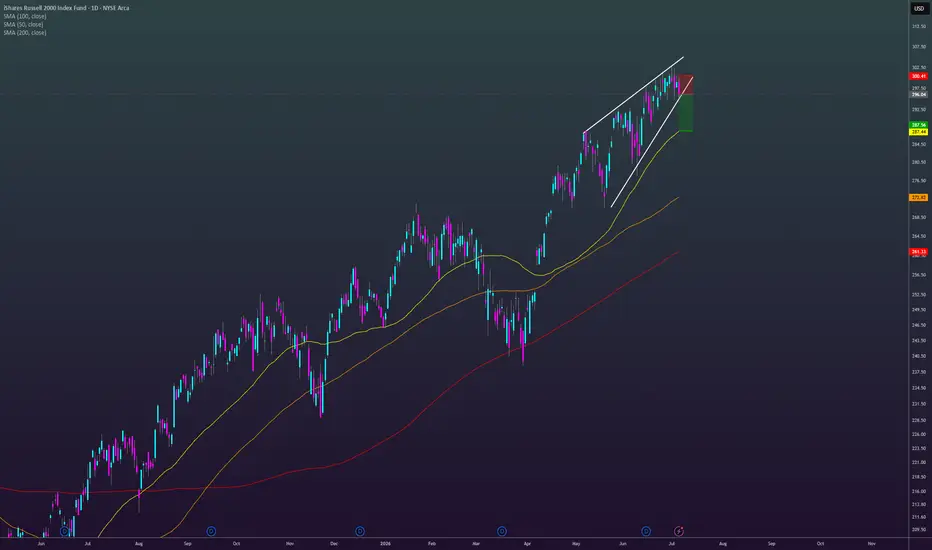
ETF market
Education Series Post No. 001 - Why Price Respects LevelsMost traders believe support and resistance are simply lines drawn on a chart.
They’re not.
👉 They represent real positions, real risk, and real decisions made by traders.
Understanding this is the foundation of price action.
⸻
🧠 What a “Level” Actually Is
A level is a price where:
• Traders previously entered positions
• Orders are still resting
• Risk is clearly defined
👉 It’s not a line… it’s a cluster of positioning
⸻
⚖️ The Psychology Behind Levels
At any key level, there are three primary groups of traders:
😬 1. Trapped Traders
• Entered at the wrong price
• Now holding losing positions
• Looking for a way out
⸻
🔁 2. Break-Even Traders
• Previously in profit or loss
• Waiting for price to return
• Looking to exit at no loss
⸻
⚡ 3. New Participants
• Entering based on the level
• Adding fresh liquidity
• Driving new movement
⸻
👉 When price returns to a level, all three groups act at the same time.
⸻
🔥 Why Price Reacts at Levels
Price doesn’t react because of the line itself.
It reacts because of orders and liquidity.
At key levels:
• Stop losses are triggered
• Positions are closed
• New trades are opened
• Liquidity becomes available
👉 This creates reaction and movement
⸻
🔄 The Role Flip (Support → Resistance)
Support and resistance don’t magically change.
Here’s what actually happens:
• Traders buy support
• Price breaks below
• Those buyers become trapped
When price returns:
• They sell to exit at break-even
• That selling creates resistance
👉 This is known as a role flip
⸻
📉 Resistance Example (Above Price)
When price pushes into resistance:
• Buy stops above the level get triggered
• Late buyers enter
• Price fails to continue higher
👉 Those buyers become trapped
As price falls:
• Stops are hit
• Longs exit
👉 This fuels downside movement
⸻
📈 Support Example (Below Price)
When price breaks below support:
• Sell stops are triggered
• Shorts enter aggressively
But if price reverses:
• Shorts are forced to cover
• New buyers step in
👉 This creates a liquidity-driven reversal
⸻
🧠 Market Mechanics (Advanced Insight)
Price moves because:
👉 Orders require liquidity to execute
Liquidity is found:
• Above highs (buy stops)
• Below lows (sell stops)
• Around key levels
👉 Institutions target these areas to fill positions
⸻
🚨 Common Trader Mistakes
❌ Treating levels as “magic lines”
❌ Ignoring trader positioning
❌ Entering without understanding context
❌ Failing to recognize trapped traders
⸻
🧩 Professional Mindset
Instead of asking:
👉 “Is this support or resistance?”
Ask:
👉 “Who is trapped here?”
This question reveals:
• Where liquidity exists
• Where risk is positioned
• Where price is likely to move
⸻
🔑 Bottom Line
📍 Levels = positioning
📍 Reactions = liquidity
📍 Moves = trapped traders
⸻
📈 Price does not move randomly.
It moves based on:
👉 risk, liquidity, and human behavior
Are you bullish on crypto?? BMNR / BMNG Trade IdeaNo fundamental or deep technical analysis today - just vibes.
I think we're do a breakout to the upside, so I'm entering my speculative trade idea here. Bullish on Ethereum and Bitmine for this week.
BMNG Calls, $2 Strike, 6/18 Expiry.
No stop loss, take profit when ETH hits $2,900+.
SPY Daily/Weekly TA**SPY — SPDR S&P 500 ETF Trust**
**Daily & Weekly Chart Breakdown**
*Monday 5/4/26 – Intraday*
---
### 🔍 Key Observations (Daily + Weekly Confluence)
• SPY is currently trading around **~717–718**, sitting just under **all-time highs (~724–725)**.
• The most important context right now:
➡️ **We are still in a bullish continuation environment**
➡️ **Higher highs and higher lows remain intact on higher timeframes**
• Current price action is:
• Tight consolidation just under highs
• Slight pullback after extension
• Holding above key breakout structure
🚨 **This is NOT a reversal structure — it is consolidation at highs**
---
### 📊 Key Levels to Watch
**Immediate Resistance**
• **721 – 725** → ATH resistance zone
• Break above → continuation into **750+ measured move zone**
**Support Below**
• **716 – 714** → immediate support / consolidation floor
• **708 – 702** → key breakout structure
• **696 – 690** → major support (daily 50EMA area)
---
### 📈 Technical Breakdown
This is a **textbook bullish continuation structure**:
• Strong impulsive move up
• Followed by tight consolidation
• Holding above prior breakout levels
On the weekly:
➡️ Clean uptrend intact
➡️ No loss of structure
➡️ No lower high formed
Key principle:
👉 **Do NOT confuse consolidation or minor retracements with reversals**
Reversals require:
• Breakdown of structure
• Lower highs + lower lows
• Loss of key higher timeframe support
We do NOT have that.
---
### 📊 Volume & Trend Notes
• Volume expanded on the upside move
• Current pullback volume is lighter → **healthy digestion**
Trend:
• **Short-term: bullish consolidation**
• **Higher timeframe: strong bullish continuation**
---
### ✅ Trading Plan
#### Bullish Scenario (Primary)
Trigger: **hold above 714 OR break above 725**
Targets:
• PT1: **725 (ATH break)**
• PT2: **740**
• PT3: **750+**
Stop Loss:
• **below 708**
---
#### Bearish Scenario (Pullback Only)
Trigger: **loss of 714 with continuation**
Targets:
• PT1: **708**
• PT2: **702**
• PT3: **690**
Stop Loss:
• **back above 718–720**
---
### 📌 Summary
SPY is in **bullish continuation at all-time highs**.
• This is consolidation, not reversal
• Market remains strong until **higher timeframe structure breaks**
🚨 The biggest mistake traders make here:
**Trying to call tops in a strong trend**
➡️ Respect the trend
➡️ Let structure break before flipping bias
Do not mistake consolidation and minor retracements as market reversals — that is what consistently blows accounts in strong trending markets.
EWG Short: The $110 Oil Reality CheckContext: After closing my NVDA position at break-even, I am opening a swing short position on the German ETF (EWG). In my view, the market's reaction at the end of the week is based on a false optimism that ignores the brutal reality of the commodities market.
1. False Positivity and the Logistics Trap
On Friday, the market reacted positively to reports of a potential "Hormuz Protocol," suggesting that ships could pass through the strait in exchange for a fee (a toll of approximately $2 million per tanker). While indices took a "quick breath" rallying about 4%, I believe this is merely a brief gasp for air before the next leg down.
Tolls vs. Insurance: Even if the "faucet stays open," insurers (Lloyd’s, etc.) will continue to view this area as a War Risk Zone. Insurance premiums will drop very slowly, meaning a permanent increase in logistical costs for German industry.
Economic Pressure: The German industrial model (EWG) is not built to compete long-term with the USA or China under current input prices, tolls, and high insurance premiums.
2. Monitoring the "Divergence" – Oil vs. Equities
While the indices have seen a 4% relief rally over the last 2-3 days, oil has moved upward at a much more aggressive pace. Specifically on Friday, we witnessed an extremely aggressive move to the upside that managed to hold its close at these highs until the final trading bell.
Crude Oil WTI Jun '26 (CLM26): $98.04s (+7.88%)
Crude Oil Brent Jun '26 (QAM26): $109.03s (+7.78%)
Crude Oil WTI May '26 (CLK26): Here we are already at $111.54s (+11.41%).
Looking at the May contract price, I see absolutely no reason to celebrate. Oil is telling a completely different story than the one equity optimists are trying to paint.
3. Geopolitical Deadlock and the "Trump Trap"
I suspect the market is overestimating Trump’s ability to "strike a quick deal." The Iranian mentality does not play by Western economic rules; honor and retaliation often outweigh dollars.
I expect Trump will likely declare some form of "victory" (e.g., claiming we don't need their oil anyway) and gradually pull back, leaving Europe—which is entirely dependent on this route—in a state of uncertainty.
In my opinion, the Iranians will use every opportunity to show that Western intimidation doesn't work. Attacks on ships could resume at any time.
4. Technical Levels and Profit Target
Since the start of the conflict, the ultimate low for this derivative (EWG) was approximately $38 USD, representing a -14.30% drawdown. Currently, we are sitting at -10%.
I believe we are headed to retest those maximum lows. I am prepared to take profit, or at least partial profit, at that $38 level.
While some might argue that the -14% level was the "ultimate fear" and that the current -10% has already priced in the situation, I find that unlikely. As long as oil remains this high, a -10% drawdown is not a strong enough floor and likely opens the door for further downside. We are currently dreaming that oil will drop in the coming months, but soon we will have to face reality.
5. Risks and Trade Execution
The primary risk to this trade would be a rapid de-escalation or a total end to the conflict—scenarios I consider highly improbable right now.
I chose the EWG derivative over shorting the DAX directly because it allows me to trade in USD and aligns with US market hours. I am using this bounce to buy May 15 $42 Put options (ITM).
Why ITM: I want intrinsic value to protect me against weekend "chop" and time decay over the long holiday.
Swing Thesis: I expect that by Tuesday morning, when Frankfurt wakes up to the reality of Brent over $110, the bubble of "good news" will burst.
Conclusion: I am betting on commodity market data against temporary equity sentiment. If oil isn't dropping even after news of a "protocol," the equity market will eventually have to capitulate.
Markets Research 04.05.2026🌏 Markets:
AMEX:SPY −0.42 −0.06%(pre/m)
NASDAQ:QQQ +0.85 +0.13%(pre/m)
🆕 Economic News:
TWO MISSILES HIT A US WARSHIP NEAR JASK ISLAND AFTER IT IGNORED IRAN’S WARNINGS — FARS NEWS
-- Information is still being verified. More details in the “Additional (Macro / Geopolitics)” section.
10:00 USA – Factory Orders
📈 Gap Ups
Reaction to earnings/guidance:
NYSE:TSN NYSE:HESM
Other news:
NASDAQ:ASRT today announced that, on May 1, 2026, ASRT and Garda Therapeutics entered into an Amended and Restated Agreement and Plan of Merger, pursuant to which Garda has increased its offer to acquire all outstanding shares of Assertio to $21.80 per share in cash with no contingent value right.
NASDAQ:RLYB said Candid terminated their March 1, 2026 merger agreement on May 3, 2026 after Candid entered a permitted alternative transaction with $UCB. Under a waiver signed May 1, 2026 among Rallybio, Candid and UCB, Rallybio waived certain notice rights, enabled the $50 million termination fee and expense reimbursement to be paid the first business day after termination, and agreed to mutual releases upon receipt of funds.
NASDAQ:PN To Acquire The Rest of Nanjing Cesun Power for About $20.2M
NASDAQ:CNSP Announces Oversubscribed $22.5 Million Private Placement Financing
NYSE:GBTG today announced that it has entered into a definitive agreement to be acquired by Long Lake Management for $9.50 per share in an all-cash transaction valued at approximately $6.3 billion.
NASDAQ:CELC reported encouraging results from its Phase 3 trial for its proposed breast-cancer treatment.
NYSE:BB Stock Wrapped Its Best Month In Five Years. Blackberry’s QNX Moves Into Industrial AI Core, which is becoming an important base for self-driving and autonomous machines.
In a Sunday announcement, NYSE:GME put forward a non-binding proposal to purchase all of NASDAQ:EBAY outstanding shares at $125 apiece, with the consideration divided equally between cash and GameStop common stock, placing eBay's undiluted equity value at roughly $55.5 billion.
South Korean shares jump 5% to record high as chipmakers rally: KRX:KOSPI AMEX:KORU NYSE:PKX
NASDAQ:COIN , NASDAQ:MSTR , and Other Crypto Stocks Get a Boost as CRYPTOCAP:BTC Rallies
NASDAQ:NBIS said it agreed to buy Eigen AI for about $643 million in cash and stock. The acquisition is set to deepen Nebius' artificial intelligence push by folding Eigen AI's inference and post-training optimization tools into Nebius Token Factory, its platform for managing production AI workloads. The company also said the transaction may expand its U.S. footprint, with Eigen AI's founding team expected to help build an engineering and research presence in the San Francisco Bay Area.
📉 Gap Downs
Reaction to earnings/guidance:
NYSE:NCLH NASDAQ:TWST NASDAQ:AXSM
Other news:
Shares of European giants are falling amid a potential escalation of the Middle East conflict between Iran and the US: NYSE:TKC BME:BBVA AMEX:PSLV NYSE:UL NASDAQ:ASML $BUD.
NASDAQ:QCOM Is Maintained at Neutral by JP Morgan Price Target Raised to $160.00/Share From $140.00
-- NASDAQ:QCOM Maintained at Neutral by UBS / Price Target Raised to $170.00/Share From $150.00
A trial is slated to begin in New Mexico on Monday that will test the state’s claims that NASDAQ:META 's Facebook, Instagram and WhatsApp platforms harmed young users’ mental health and its bid for a court order forcing the company to make changes.
‼️ Additional
AI chipmaker Cerebras ( NASDAQ:CBRS ) is kicking off its IPO roadshow with a $115–$125 share price target / The NASDAQ:NVDA rival is seeking to raise as much as $3.5 billion and achieve a valuation of up to $26.6 billion on the Nasdaq
The cannabis stock pump is over. NASDAQ:AKAN shares are selling off ahead of Monday’s open.
NASDAQ:XNDU - dump after the pump.
📋 List of tickers involved:
AMEX:SPY NASDAQ:QQQ NYSE:TSN NYSE:HESM NASDAQ:ASRT NASDAQ:RLYB NYSE:UCB NASDAQ:PN NASDAQ:CNSP NYSE:GBTG NASDAQ:CELC NYSE:BB NYSE:GME NASDAQ:EBAY KRX:KOSPI AMEX:KORU NYSE:PKX NASDAQ:COIN NASDAQ:MSTR CRYPTOCAP:BTC NASDAQ:NBIS NYSE:NCLH NASDAQ:TWST NASDAQ:AXSM NYSE:TKC BME:BBVA AMEX:PSLV NYSE:UL NASDAQ:ASML NYSE:BUD NASDAQ:QCOM NASDAQ:META NASDAQ:CBRS NASDAQ:NVDA NASDAQ:AKAN NASDAQ:XNDU
Best regards – hi2morrow team.
I'll roundhill you!!!!Been training/trading since 2018.
Made millions of mistakes so I assume I'm getting close to making less..🕺
I mean who doesn't love Ram?
Anyway I decided against doing the pure play with a memory stock because they're just two psychologically High to attract fresh investors..
So I chose this mofo.
Looking to double my investment I don't think that's too much ask.🙏
FOOD - agriculture play - bad weather is' a cominFOOD - agriculture play - bad weather is' a comin
cant seem to take out options on this, but you can easily find an instrument that does. ask ai how.
COCOA is on my mind. its been down for awhile, the bad weather that is most prob coming will kick in psychologically soon (after the current production glut is pushed through). then the tide will change.
expecting the move up here to be more violent than the last cycles general momentum.
el nino godzilla
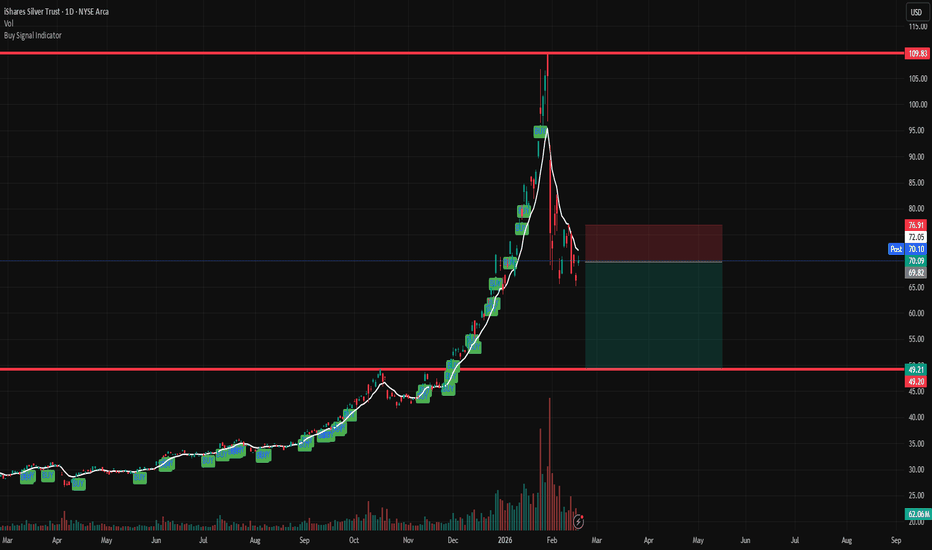
abrdn Silver ETF Trust (NYSE: SIVR)When concerns about inflation intensify or stock markets lose momentum, investors often turn their attention to silver as a time-tested safe haven. The abrdn Silver ETF Trust (NYSE: SIVR) provides one of the most direct and efficient ways to gain exposure to silver’s price movements without the complications of storing physical metal or managing futures contracts. By holding actual silver bullion in secure vaults, the fund gives investors a simple, transparent link to the commodity’s spot market. Still, the central question for investors is whether SIVR’s lower costs and structure make it a smarter hedging tool compared to its larger rival, the iShares Silver Trust (NYSEARCA: SLV).
The Role of SIVR in a Portfolio
SIVR is designed to mirror the daily fluctuations in silver’s spot price, providing pure exposure to the metal itself rather than to the shares of mining or refining companies that might be influenced by factors other than silver prices. This makes SIVR particularly attractive to investors who want to use silver as a portfolio diversifier or inflation hedge. Because silver often behaves differently from stocks and bonds, adding it to a portfolio can help moderate risk during periods of economic uncertainty or rising consumer prices.
Silver also benefits from its dual nature as both a monetary asset and an industrial commodity. Over the past year, these characteristics combined to produce striking gains. SIVR climbed an impressive 139%, riding the momentum of resurgent industrial demand in areas such as electric vehicles, solar panels, and electronics, alongside a wave of investment-driven buying as inflation worries and a weaker U.S. dollar drew capital into precious metals. The interplay between silver’s industrial uses and its safe-haven appeal amplified price swings, sending both the physical metal and the ETF sharply higher.
How SIVR Compares to Its Larger Rival
One of SIVR’s strongest selling points is its cost efficiency. The ETF carries an expense ratio of 0.30%, which is about 40% lower than the category heavyweight SLV. For long-term investors, this difference adds up: on a $10,000 investment, SIVR saves roughly $20 annually, and those savings compound over time to create meaningful cost advantages for buy-and-hold portfolios. Both SIVR and SLV closely track the price of silver because they are physically backed by bullion, so their performance is nearly identical.
The distinction lies mainly in scale and liquidity. SLV, as the much larger fund, holds several times more assets under management—providing tighter bid-ask spreads, greater trading volume, and enhanced price stability during sharp market swings. These liquidity advantages benefit traders or large institutional investors who value execution speed. For smaller, long-term investors, however, SIVR’s fee advantage may outweigh those considerations, especially since daily tracking differences have been minimal.
Understanding the Tradeoffs
Silver’s volatility is both its appeal and its challenge. The metal’s price can fluctuate far more sharply than typical equity indices, and SIVR reflects that turbulence one-for-one. In early February 2026, for example, SIVR tumbled 7% in a single week as global risk appetite shifted. Such reversals highlight the need for investors to maintain conviction during bouts of price weakness and to size silver positions appropriately within a broader portfolio context.
Liquidity can also be an issue during volatile periods. SIVR’s smaller asset base means that trading volumes may thin out in stress conditions, causing wider bid-ask spreads that increase transaction costs for active traders. For investors who buy and hold the ETF over longer horizons, this is a minor inconvenience, but short-term traders should approach SIVR’s lower liquidity with caution.
In addition, SIVR produces no yield—unlike stocks with dividends or bonds with interest payments, silver holdings don’t generate ongoing income. All returns depend on changes in silver prices, which means periods of flat or negative performance are not uncommon. Investors should therefore treat SIVR as a tactical position or inflation hedge, rather than a core portfolio asset.
Bottom Line
The abrdn Silver ETF Trust (SIVR) occupies a valuable niche for investors seeking direct, low-cost access to physical silver. Its efficiency makes it a compelling alternative to SLV, particularly for those focused on long-term cost savings. However, silver’s inherent volatility, lack of income, and SIVR’s moderate liquidity require investors to approach with discipline and a clear strategy.
For diversified portfolios, a modest allocation to SIVR can serve as both a defensive hedge against inflation and a tactical bet on industrial demand growth—a way to benefit from silver’s unusual dual role as both a critical industrial material and a centuries-old store of value.
REMX - inevitable REMX - inevitable
options are quite cheap. small risk. big reward.
the thesis is very simple. the west needs western production. fear will drive this one at least around the long term yellow trend line. war may drive it far above. and thats not even mentioning the green tech and robots...
lots of charts look exactly like this. global macro rotation into resources.
when the commodities/sandp500 ratio hits .9, time to begin exiting and waiting for the inevitable implosion.
gl
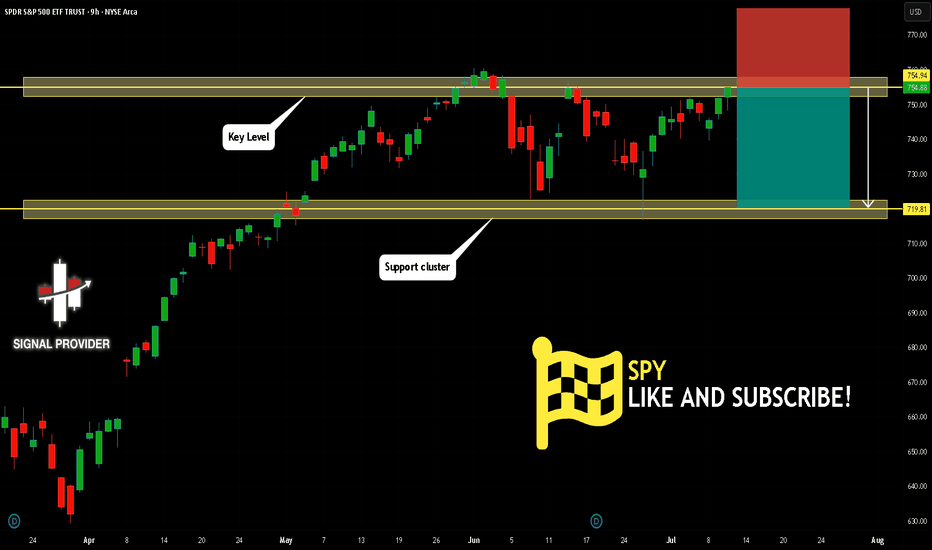
SPY: Short Signal with Entry/SL/TP
SPY
- Classic bearish pattern
- Our team expects retracement
SUGGESTED TRADE:
Swing Trade
Sell SPY
Entry - 720.56
Stop - 723.14
Take -716.03
Our Risk - 1%
Start protection of your profits from lower levels
Disclosure: I am part of Trade Nation's Influencer program and receive a monthly fee for using their TradingView charts in my analysis.
❤️ Please, support our work with like & comment! ❤️
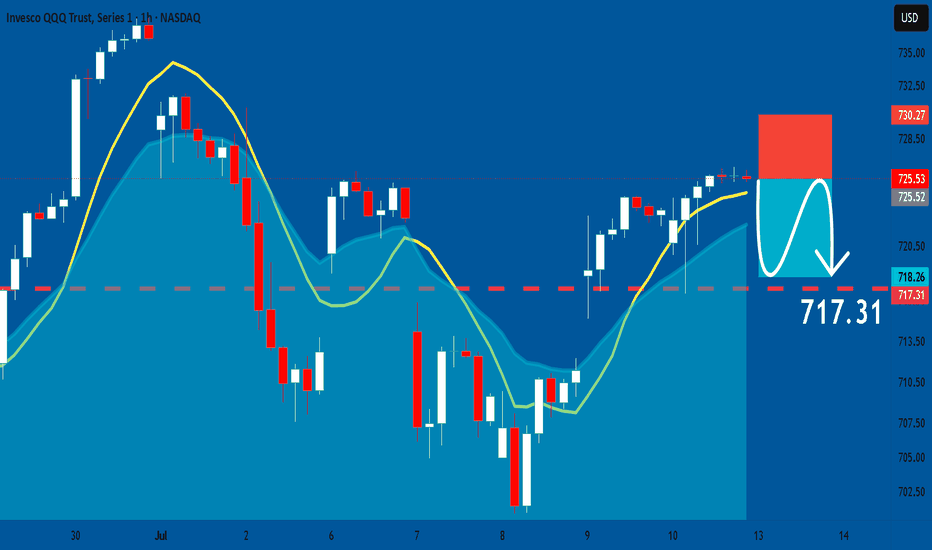
QQQ Set To Fall! SELL!
My dear friends,
My technical analysis for QQQ is below:
The market is trading on 674.14 pivot level.
Bias - Bearish
Technical Indicators: Both Super Trend & Pivot HL indicate a highly probable Bearish continuation.
Target - 667.54
Recommended Stop Loss - 677.80
About Used Indicators:
A pivot point is a technical analysis indicator, or calculations, used to determine the overall trend of the market over different time frames.
Disclosure: I am part of Trade Nation's Influencer program and receive a monthly fee for using their TradingView charts in my analysis.
———————————
WISH YOU ALL LUCK
Weekly Bias — 4 MayWe’re seeing broad risk-on continuation, but it’s not clean — it’s late-stage expansion behavior, not early trend
NASDAQ:QQQ is leading, extended above prior range highs
AMEX:SPY is confirming, but lagging slightly
AMEX:IWM is participating → confirms breadth (important), but still below relative expansion vs NASDAQ:QQQ
Combination = trend intact, but maturity increasing
Clear MSS (market structure shift) occurred off the ~$555 low → impulsive leg higher
Current move = trend continuation leg, not accumulation
However, now above prior distribution (February–March range)
Price is trading in premium on HTF → early distribution risk area
Volume is declining into highs (visible across QQQ/SPY + internals)
This is thin participation markup
Strong price
Weak commitment
This often precedes either grind higher (gamma support), or fast rejection once liquidity is taken
Obvious buy-side liquidity at $675–$680 ( NASDAQ:QQQ high) → currently being tapped
This isn't clean breakout structure — it's a liquidity sweep candidate
Inefficiency/imbalance at $638–$630 (VAH area)
~$614 (mid value/breakdown pivot)
$595 (VAL/origin of move)
If we lose momentum, first magnet = $638, then $614 = key structural line
Across megacaps
NASDAQ:NVDA , NASDAQ:META showing early momentum stall
NASDAQ:AAPL , NASDAQ:MSFT steady, but not accelerating
Distribution behavior (price up, momentum breadth flattening)
This move likely coincides with stable yields, but at these levels, NASDAQ:QQQ is very rate-sensitive again
If yields rise, tech will mean revert quickly into value ($638–$614)
We're deep in premium (above value)
Fair value for continuation needs acceptance above $675; otherwise, expect rotation back toward $630–$610
AMEX:IWM confirming = bullish, but still isn't expanding aggressively
This is not euphoric expansion, it's controlled
Expected move (1σ) based on current structure + realized vol compression ~±18–22 pts ( NASDAQ:QQQ equivalent ~2.5–3%) over short-term swing window
Upside $690–$700
Downside $650 → $638 → $614
Given price behavior
Likely positive gamma environment below ~$670
Above that transitioning toward neutral → negative gamma pocket
Explains controlled grind up
Potential for volatility expansion if rejected from highs
Tech still driving absolute price higher, but underperforming broad market structurally → this is a major divergence
Price ( NASDAQ:QQQ ) ↑
Relative strength ↓
Semis are crowded leadership
When this rolls → NASDAQ:QQQ loses its engine
Any lower high here = risk-off trigger for NASDAQ:QQQ
Market isn't hedged aggressively — still in “controlled optimism,” but protection demand creeping in
Breadth improved from March lows, but just recovering → mid-cycle, not fresh breakout
QQQ rally is happening despite high yields
NASDAQ:QQQ ↑ while yields remain elevated → positive divergence vs macro reality
These usually resolve by NASDAQ:QQQ pulling back, or yields collapsing (less likely short-term)
3 conflicting forces
1. Bullish
Strong trend/momentum
Breadth improving
Positive gamma grind
2. Bearish
NASDAQ:QQQ relative weakness vs AMEX:SPY
Narrow leadership (semis only)
Software breaking down
Elevated yields
Thinning volume into highs
3. Neutral
Vol not panicking
Positioning crowded, but not extreme
Index pushing highs, leadership narrowing, momentum flattening internally & macro not confirming — markets either blow-off top, or fail fast after liquidity sweep
SPY Structure Update — DailyEMA stack remains in strong alignment, with the 10/20/50/200 all trending upward and showing clear curvature. Structure continues to reflect constructive momentum across all key moving averages.
Price is holding above the stack, reinforcing trend strength rather than extension failure at this stage.
RSI is steady at 71, signaling sustained participation without immediate signs of exhaustion, but still within a zone where continuation vs. cooling becomes important to monitor.
OBV has been trending higher since March 30th, confirming accumulation behind the move. Recent behavior shows it holding gains rather than rolling over, which supports underlying strength.
What I’m watching:
Whether price continues to hold above the 10/20 EMA cluster (short-term momentum control)
RSI behavior near current levels (continuation vs. divergence)
OBV for continued confirmation vs. flattening
⭐ Final Clarity Note ⭐:
Structure remains constructive with aligned trend, participation, and volume. As long as price holds above the EMA stack, the current trend structure stays intact.