IWM: Value Area to Value Area — What Comes Next?IWM: Value Area to Value Area — What Comes Next?
IWM closed today near all-time highs after moving from yesterday’s Value Area into today’s Value Area — another example of what I like to call a “box-to-box” movement .
For now, price is resting inside its new area of comfort.
Tomorrow could be interesting. We have Core PPI, PPI and Initial Jobless Claims , so the market may simply be waiting for new information before deciding its next move.
Looking at the larger move, IWM started this swing around 297.81, near the VAL from the August 4 opening auction, and reached 303.39 today, printing a new all-time high.
That entire move left a footprint.
Using a Volume Profile over the swing, we can see that price broke above an important Value Area around 301.78, moved higher, and established a new area of value near the highs.
Scenario 1 — Rotation Lower
If price fails to continue higher, **301.78** becomes an important level to watch.
A rotation back toward that level would make sense as a retest of the previous value boundary. Below it, the high-volume area around **301.00–301.30** could become another potential destination where price may find acceptance again.
Scenario 2 — Continuation Higher
IWM can certainly continue making new highs.
However, this is not a move I would personally chase. Above the current highs, we have very little previous value structure to use as a reference.
I prefer opportunities where the market gives me a clear destination rather than chasing price into unexplored territory.
Tomorrow's opening price relative to today's close and current Value Area should give us the first important clue.
Context first. Direction second.  Long
Long
SPY — PPI Prep + AOA Framework UpdateI probably won’t trade tomorrow, but I wanted to put this together anyway because the structure is too interesting not to map.
PPI hits tomorrow at 8:30 AM ET.
The important thing for me is not predicting whether PPI is good or bad.
It’s understanding what price is sitting inside **before** the catalyst arrives, and what would matter after the initial reaction.
The AOA framework is evolving
Testing the new **Active AOA** this week helped me realize it can do more than simply show where current price agreement is developing.
It can also help us identify which historical AOAs deserve more weight.
I’m starting to think about them in three classes:
**Standard AOA**
A historical price level where candles previously showed meaningful agreement or reaction.
**Zone AOA**
A broader area rather than one exact line — basically what I’ve called the “chop box.” Price has repeatedly negotiated inside the region, so treating it as a zone makes more sense than pretending one dollar value controls everything.
**Major AOA**
An agreement level that keeps reappearing across multiple sessions and continues influencing price when revisited.
That’s where the Active AOA has been useful.
As it migrates through the market, we can look back and see which levels repeatedly became the active agreement area.
Those repeated Active AOA locations can help us decide which static AOAs deserve promotion to **Major AOA** status.
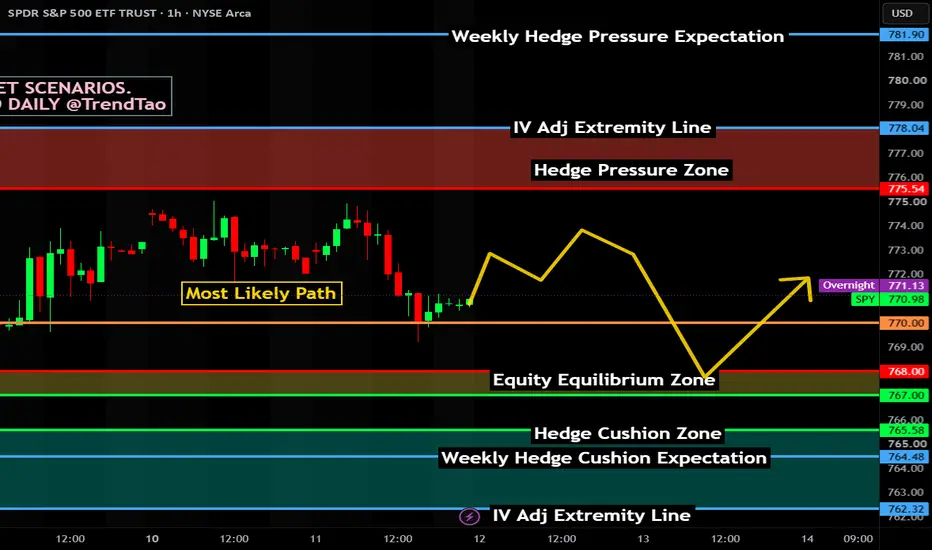
On this chart, the ~$771, ~$772 and especially ~$773 areas have repeatedly shown up in the conversation.
That helps explain why the yellow scenario deserves real respect here.
SPY isn’t sitting in empty space.
It is sitting inside an established agreement structure.
Tomorrow's scenarios
Green — bullish expansion
If PPI is constructive and price accepts above the upper structure, ~$775–776 becomes the important breakout conversation.
The key word is **accepts**.
I’m much less interested in the first PPI spike than whether price can hold above the structure after the excitement settles.
Yellow — continued negotiation
If PPI is basically another nothingburger, I can easily see SPY continuing to rotate around the current AOA structure.
That means more negotiation around ~$772–774, false breaks, and traders getting chopped up trying to force direction where the market hasn’t chosen one.
Structurally, this remains a very reasonable outcome.
Red — bearish expansion
If PPI materially changes the inflation story and sellers gain control, I’m watching ~$771 first.
Below there, ~$768 becomes the larger structural test, with ~$765 beneath it.
But even in the bearish scenario, I’m not interested in predicting or chasing a straight-line collapse.
A violent move into one of those major areas could create exactly the kind of **overreaction setup** we like to study.
### Thursday may create Friday's structure
One other reason these paths extend into Friday:
Tomorrow’s reaction may not finish tomorrow.
If PPI creates a meaningful move and the market **accepts** the new range, Friday may simply inherit that structure.
Good catalyst → breakout → acceptance could give Friday a higher base.
Bad catalyst → breakdown → acceptance could give Friday a lower base.
And a violent Thursday move that **fails** at structure could set up an overreaction unwind into Friday.
So Thursday may provide the catalyst.
Friday may trade the acceptance.
That’s the purpose of these scenarios.
Not to tell you where SPY is going.
To know what matters if it gets there.
Preparation > Prediction.
 Long
Long
 Short
Short
 Long
Long
You Decided To Trade Before You Opened The ChartYou Decided To Trade Before You Opened The Chart
"I haven't been trading for 4 days. This setup kinda looks like it fits my trading plan if I look hard enough. Yes it fits my trading plan!"
How many times have you waited for a setup that never came, or you're simply just bored waiting for your setup to come? What did you do next? Did you continue waiting? Or did you argue with yourself to make a setup fit your trading plan?
Since my last payout on 25 July, I only opened 4 trades. You will think that I have a lot of trades given that I trade on the 1-minute timeframe. No. I'm waiting for very specific setup to occur.
The Decision Came First
You feel uneasy not trading for a few days. You have already decided that you want to take a trade today. Not taking a trade feels like you're not trading nor being productive at all.
That decision has already clouded your judgement. Your trading plan has been placed aside with this decision.
When you're at the chart, you stop looking for reasons to stay out of the market. You start to look for reasons to jump into the market.
You argued your way into making the trade a right one by force-fitting your decision matrix.
That decision changes what the chart is for. It stops being the thing that tells you whether your context exists. It becomes the thing you search until you find something you can defend.
Those are two different jobs. One of them filters you out. The other one supplies you.
You can feel which one you're doing. When you're looking at the chart from a filtering lens, most days end with nothing. When you're looking at the chart from a "I want to trade today" lens, most days end with a trade, and every one of them had a reason at the time.
The Standard Moves Quietly
Nobody sits down and decides to lower their standard. It slips slowly, and every single time, there is a reason attached to the lowering of standard.
The context isn't there on the higher timeframe, so you drop to where the move looks cleaner. The setup isn't complete, so you take the part of it that is. You wanted 3 conditions, you have 2, and the third one is basically there if you look hard enough.
Watch the language you use on yourself. "Close enough." "Good enough for a small one." "I'll size down."
That last one is the most expensive. Sizing down feels like risk management while you are in the middle of breaking a rule.
By the time you open the trade, you have a real reason. It's just a reason you built after you wanted the trade, not before.
So ask yourself this. Could you have screenshotted that setup before entry, one photo, and had it stand on its own? Or was it a chart you had been staring at for two hours, talking yourself into?
Most of my forced trades never had a clean photo behind them. They had a story.
4 Trades Only
I took a payout on 25 July. As of 11 August, I only took 4 trades. That's an average of 1 trade every 3 days. Mind you, I am trading on the 1-minute timeframe.
You might be wondering why did I take so little trades even when I'm trading on the 1-minute timeframe. Entry model appears everywhere. The key is waiting for the right context before I start looking for a trade. I use a 3-timeframe alignment before I can take a trade.
Yes this means a lot of waiting. I have gone through a month of waiting without taking any trades because the context wasn't right.
In trading, you get paid for trading your trading system, not by forcing trades. Yes you can get lucky wins here and there by forcing trades. But in the long run, you're more likely to lose than win because you're trading a random system that has an unknown expected value. When drawdown eventually comes, you will be scared because you do not know whether it's due to a normal variance or due to the forced trades having negative expectancy.
What The Forced Trade Actually Costs
The forced trade doesn't only cost you the loss. You pay commission on it, you pay the spread, and down on the lower timeframes those costs are a bigger share of a smaller move.
Then there's the part that never shows up on a statement. Every forced trade lands in your journal next to the real ones. Your win rate reads lower than your system's. Your average drawdown reads bigger.
So when you sit down to review, the data can't answer the question you're asking it. You wanted to know whether your setup works. You've now contaminated your dataset.
Count Them Tonight
Open your last 30 trades.
For each one, answer a single question honestly. Did you forced a trade or would you not have taken this trade?
Now mark every trade where the answer is yes and add up what that group did on its own. Not the whole account. Just that group.
If it's negative, you don't have a strategy problem. You have a set of trades that were never part of your strategy, sitting inside your results and making them unreadable.
Stay consistent. Stay safe.  Long
Long
Research 12.08.2026🌏 Markets:
AMEX:SPY +1.49 0.19%(pre/m)
NASDAQ:QQQ +4.32 0.60%(pre/m)
🆕 Economic News:
08:30 USA – Core Inflation Rate / CPI
10:30 USA – EIA Crude Oil/Gasoline Stocks Change
14:00 USA – Monthly Budget Statement
📈 Gap Ups
Reaction to earnings/guidance:
NASDAQ:CRWV NASDAQ:SMCI NASDAQ:NBIS NASDAQ:LITE NASDAQ:VELO NYSE:EROC NYSE:HRB NYSE:CAVA NASDAQ:GLBE NASDAQ:ATRO NYSE:AADX NASDAQ:MRX NASDAQ:TRMB NASDAQ:FLY NASDAQ:FRVO NASDAQ:ALM
Other news:
Optical stocks rises in symphaty to NASDAQ:LITE earnings: NYSE:COHR NYSE:NOK NYSE:GLW NASDAQ:AAOI NASDAQ:AXTI
U.S. memory stocks rose after reports that Singapore's sovereign wealth fund Temasek is planning to invest in Samsung Electronics and SK Hynix: NASDAQ:SKHY NASDAQ:MU NASDAQ:SNDK NASDAQ:WDC AMEX:KORU
Intel Corp. NASDAQ:INTC CEO Lip-Bu Tan is exploring new ways to stack CPUs and memory components, an approach that could help the chipmaker better manage ongoing memory shortages and add further legs to its spectacular rally this year.
📉 Gap Downs
Reaction to earnings/guidance:
NSE:BETA NASDAQ:LQDA NASDAQ:TSHA NASDAQ:OCTV NASDAQ:IMNM NYSE:EAT NASDAQ:MLYS NASDAQ:NN NYSE:AMCR NYSE:PAGS NYSE:FNV NASDAQ:QNT SET:KTB
Other news:
Berenberg cut Novo Nordisk NYSE:NVO rating to Hold and trimmed its target to 35$, citing rising obesity competition as Eli Lilly’s NYSE:LLY Foundayo nears diabetes approval, pressuring 2H26.
‼️ Additional
Trump has shifted to a new strategy against Iran.
-- The administration has abandoned active diplomatic efforts, but has also refrained from military action.
-- It has now begun using a strategy of economic strangulation against Iran, based on waiting and sanctions. — The Atlantic
Ahead of the midterm elections, Trump is considering lowering the capital gains tax and easing rules on real estate sales — BBG.
Oracle NYSE:ORCL is preparing for a new wave of layoffs — The Insider.
🏢 IPO
NYSE:FOIL – Londian Wason New Energy Tech
Company produces electrolytic copper foil used in lithium-ion EV batteries, plus flexible copper-clad laminates used in EV batteries, 5G, consumer electronics and energy storage. Londian Wason is one of the world’s largest lithium battery copper foil producers by capacity and market share, with major customers including CATL, BYD, LG Energy Solution, Samsung SDI and Panasonic.
Price: $22.00 per ADS
ADS Sold: 4.3M
Raised: $94.3M
Market Cap: ~$1.71B
LTM:
Revenue: $1.87B
Net Income: $12.2M
Key point:
IPO was upsized and priced at the top of the range, but profitability remains thin relative to revenue.
Comparable public companies: NYSE:WOLF , NYSE:ALB , NYSE:LAC , NYSE:MP , NASDAQ:QS , NASDAQ:ENVX
NASDAQ:VOGX – Vogenx
Company develops drugs for endocrine and metabolic disorders, mainly post-bariatric hypoglycemia and gastroparesis. Lead candidate mizagliflozin is an oral SGLT1 inhibitor being tested in a Phase 2B study for post-bariatric hypoglycemia. The same drug may also be studied for gastroparesis and GIP-dependent Cushing’s Syndrome, subject to funding and future regulatory steps.
Price: $13.00
Shares: 6.3M
Raised: $81.3M
Market Cap: ~$166.9M
LTM:
Revenue: $0
Net Income: -$1.56M
Key point:
Company has never generated revenue and remains highly early-stage, with only one main clinical asset licensed from Kissei Pharmaceutical.
Comparable public companies: NASDAQ:VKTX , NASDAQ:ALT , LSE:TERN , NASDAQ:MIRM , NASDAQ:MDGL , OMXCOP:ZEAL
📋 List of tickers involved:
NASDAQ:CRWV NASDAQ:SMCI NASDAQ:NBIS NASDAQ:LITE NASDAQ:VELO NYSE:EROC NYSE:HRB NYSE:CAVA NASDAQ:GLBE NASDAQ:ATRO NYSE:AADX NASDAQ:MRX NASDAQ:TRMB NASDAQ:FLY NASDAQ:FRVO NASDAQ:ALM NYSE:COHR NYSE:NOK NYSE:GLW NASDAQ:AAOI NASDAQ:AXTI NASDAQ:SKHY NASDAQ:MU NASDAQ:SNDK NASDAQ:WDC NASDAQ:INTC NSE:BETA NASDAQ:LQDA NASDAQ:TSHA NASDAQ:OCTV NASDAQ:IMNM NYSE:EAT NASDAQ:MLYS NASDAQ:NN NYSE:AMCR NYSE:PAGS NYSE:FNV NASDAQ:QNT SET:KTB NYSE:NVO NYSE:LLY NYSE:ORCL NYSE:FOIL NYSE:WOLF NYSE:ALB NYSE:LAC NYSE:MP NASDAQ:QS NASDAQ:ENVX NASDAQ:VOGX NASDAQ:VKTX NASDAQ:ALT LSE:TERN NASDAQ:MIRM NASDAQ:MDGL OMXCOP:ZEAL
Best regards – hi2morrow team.
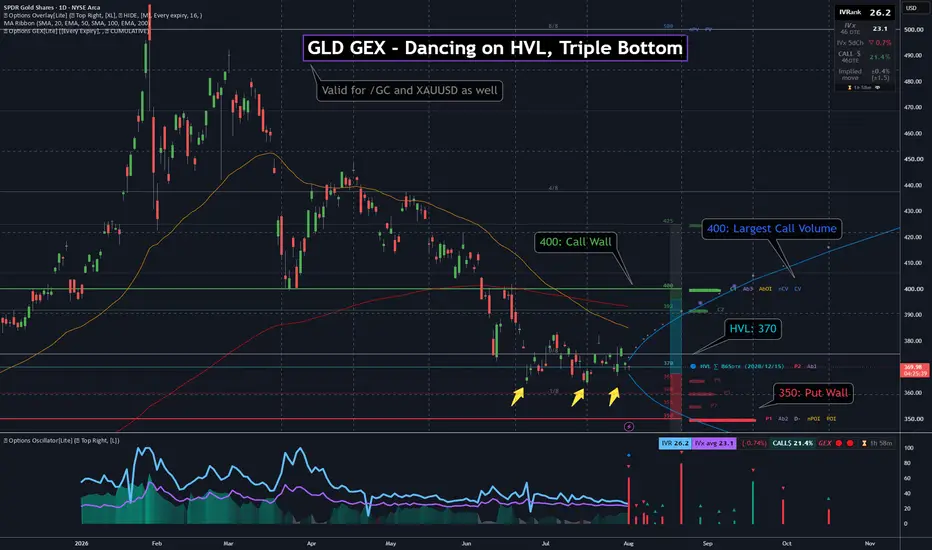
GLD GEX - Dancing on HVL, Triple BottomGLD has carved a triple bottom into the mid-360s / high-360s and is now dancing on the HVL at 370 — the gamma flip. Spot at 370.35 sits just above that pivot, so the tape is still in a positive GEX regime , but only by a hair.
That makes 370 the story: not a random round number, but where absolute gamma (Ab1), the #2 put wall (P2), and the regime line stack together. Price has defended this zone three times. The upside magnet is the 400 call wall (C1) ; the structural floor is the 350 put wall (P1) .
🔶 Regime Context 🔶
Spot is holding above HVL 370 , so the framework stays supportive — but GLD is living on the flip line, not safely extended above it. A clean loss of 370 would flip the regime read and reopen the path toward the put wall cluster below.
🔶 Options Structure Context 🔶
👉 400 – C1 (highest call NETGEX wall)
That is the primary upside reference on this 46 DTE cumulative map. The strongest call flow also landed at 400 ( CV + nCV ) — so the wall and the near-dated call volume peak rhyme.
👉 392 – C2 | 380 – C3 — intermediate call walls on the way up.
🔶 Downside Structure 🔶
👉 370 – HVL / Ab1 / P2 / D−
Confluence at 370:
HVL — gamma flip / regime pivot
Ab1 — largest absolute gamma
P2 — #2 put wall
D− — largest negative delta exposure peak
That is why the triple-bottom defense here matters: it is a multi-metric reaction zone, not just chart pattern geometry.
👉 350 – P1 / POI / nPOI
Confluence at 350:
P1 — highest put NETGEX wall
POI — highest put open interest
nPOI — net put OI peak
Together, 350 is the clear downside put-wall floor if 370 fails.
👉 360 – P3 — next put wall between HVL and P1.
🔶 Options Sentiment 🔶
CALL$ 21.4% (46 DTE) means call options at an equivalent distance from spot are priced 21.4% higher than the corresponding puts — mild call pricing skew , not an extreme bid.
🔶 Key Structure to Watch 🔶
370 — HVL / Ab1 / P2 — hold = triple-bottom thesis alive
400 — C1 call wall + CV/nCV — upside level
350 — P1 / POI — put-wall floor if HVL breaks
For now, GLD is a HVL hold + triple bottom structure inside a clean 350–400 GEX box.
The key question is whether 370 keeps absorbing dips and price can build toward 400 — or whether a break below HVL opens the slide into the 350 put wall. MARKET RECAP ANALYSIS: QQQ, SPY & NVDA – WHAT YOU NEED TO WATCHThe market pulled back today as traders reacted to rising geopolitical tensions, higher oil prices, and uncertainty around future Federal Reserve policy. SPY (S&P 500) slipped from recent record highs, while QQQ (Nasdaq 100) saw increased selling pressure as mega-cap technology stocks weakened. Nvidia (NVDA), one of the market's most influential AI stocks, remained in focus as investors evaluated its role in the next leg of the AI rally. With NVDA carrying significant weight in both SPY and QQQ, every move in the stock has the potential to impact the broader market. The key question now is whether this pullback is simply a healthy pause before another breakout or the beginning of a deeper correction. In this video, we break down the critical support and resistance levels, institutional money flow, bullish and bearish scenarios, and the setups traders should watch heading into the next trading session.
#StockMarket #MarketRecap #SPY #QQQ #NVDA #Nvidia #StockMarketToday #Trading #DayTrading #SwingTrading #Investing #StocksToWatch #TechnicalAnalysis #OptionsTrading #AIStocks #Nasdaq #SP500 #StockAnalysis #MarketNews #TradeBestPits #WealthBuilding #FinancialFreedom #MoneyMindset #BullMarket #BearMarket #WallStreet Short

 Long
Long
Automated Trade Alerts Need a System-State Audit TrailAn automated trade alert is an output. It is not an audit trail.
To evaluate an automated process, separate four layers:
1. Observation: What market data did the system read, and at what timestamp?
2. Decision: What rule or model converted that observation into an eligible setup—or rejected it?
3. Execution: Was an order proposed, submitted, acknowledged, partially filled, filled, cancelled, or left uncertain?
4. Reconciliation: Does the internal position and order ledger match the broker’s record after fees, partial fills, and delayed updates?
Without these layers, a chart marker can create false certainty. A “buy” label may represent only an idea. A submitted order may never have reached the venue. An ambiguous timeout may hide a fill. Retrying before reconciliation can duplicate exposure.
A neutral system-state checklist
Before interpreting any automated action, record:
- instrument and session;
- source timestamp and data age;
- paper or live execution mode;
- model or rule version;
- eligibility and invalidation conditions;
- position-size and loss limits;
- order identifier and state transitions;
- partial fills, costs, and slippage;
- stop or kill-switch state;
- broker reconciliation time.
Data health should also be explicit. “Current,” “stale,” “reconnecting,” and “no new data” are materially different states. A frozen last value should never be presented as a current one.
Why refusals belong in the record
A complete audit trail includes actions the system declined to take. Risk-cap refusals, conflicting evidence, closed sessions, stale inputs, and unresolved prior orders affect the opportunity set. Removing those states makes the remaining trades look more selective and more certain than the actual process.
Performance review should therefore use the complete distribution: wins, losses, refusals, inactive periods, costs, drawdown, and timestamps. Isolated outcomes cannot establish robustness.
Invalidation
Trust in the process weakens when mode labels disappear, timestamps are missing, state transitions cannot be reconstructed, broker records disagree with the internal ledger, or stale data continues to drive actions. It strengthens when an independent reviewer can replay the same evidence chain and reach the same recorded state—even if the trade lost money.
Educational information only; not investment advice. Automated systems can fail, data can be delayed, and orders can behave differently from simulations. Trading involves risk of partial or total loss. Education 
Long 
Long 
Research 11.08.2026🌏 Markets:
AMEX:SPY +1.05 0.14%(pre/m)
NASDAQ:QQQ +2.01 0.28%(pre/m)
🆕 Economic News:
08:15 USA – ADP Employment Change Weekly
10:00 USA – Existing Home Sales
16:30 USA – API Crude Oil Stock Change
📈 Gap Ups
Reaction to earnings/guidance:
NASDAQ:RIOT NYSE:BW NYSE:NIQ NYSE:SE NYSE:FLOC NASDAQ:LEGN NASDAQ:PLUG NYSE:CAH NYSE:ALC NASDAQ:BBIO NASDAQ:ETOR NYSE:BHVN NYSE:ARMK NYSE:ACHR NASDAQ:ASTS NASDAQ:SFD NASDAQ:CDNL
Other news:
Anthropic signed a $9 billion deal with Riot Platforms NASDAQ:RIOT , a miner that is also actively shifting its focus from mining to AI.
NASDAQ:SKHY Reportedly Revives China NAND Plant After 4-Year Pause, Days After $39B Korean Fabs Investment
Argus Analyst moved NASDAQ:SNDK rating to Buy from Hold, PT - $1,600, pointing to improved valuation after a recent selloff and expectations for continued demand in the memory market /
Energence Utah Partnership Positions Senmiao NASDAQ:AIHS to Pursue Digital Infrastructure Development, with 100 MW Targeted During the Initial Two-Year Development Phase
NYSE:LLY Eli Lilly’s weight-loss drug, received its first European approval in the UK.— Foundayo
📉 Gap Downs
Reaction to earnings/guidance:
NASDAQ:LIF NYSE:ONON NASDAQ:RKLB NYSE:AMTM AMEX:SVM NYSE:VG NYSE:TME NASDAQ:ESLT NYSE:BG NASDAQ:USAR NYSE:HIMS NYSE:ACM NASDAQ:MIDD NYSE:BKD NASDAQ:RUM NYSE:JBS NASDAQ:DJT NASDAQ:QUBT NASDAQ:UPWK
Other news:
NASDAQ:FA Announces Launch of Secondary Offering of 12,500,000 shares
Intel FTMO_OANDA:INTC plans to increase the size of its secondary offering to more than $20 billion from $15 billion. The placement could be priced at $95 per share or higher. The order book for Intel’s SPO is oversubscribed several times — BBG.
‼️ Additional
Nvidia NASDAQ:NVDA signed an agreement with the largest Wall Street firms to raise $500 billion to finance AI infrastructure development — WSJ.
-- Giants including Apollo Global Management NYSE:APO , Blackstone, BlackRock, Brookfield Asset Management, Goldman Sachs, and KKR have agreed to help the company raise financing.
-- The deal could be announced as soon as today.
📋 List of tickers involved:
NASDAQ:RIOT NYSE:BW NYSE:NIQ NYSE:SE NYSE:FLOC NASDAQ:LEGN NASDAQ:PLUG NYSE:CAH NYSE:ALC NASDAQ:BBIO NASDAQ:ETOR NYSE:BHVN NYSE:ARMK NYSE:ACHR NASDAQ:ASTS NASDAQ:SFD NASDAQ:CDNL NASDAQ:SKHY NASDAQ:SNDK NASDAQ:AIHS NYSE:LLY NASDAQ:LIF NYSE:ONON NASDAQ:RKLB NYSE:AMTM AMEX:SVM NYSE:VG NYSE:TME NASDAQ:ESLT NYSE:BG NASDAQ:USAR NYSE:HIMS NYSE:ACM NASDAQ:MIDD NYSE:BKD NASDAQ:RUM NYSE:JBS NASDAQ:DJT NASDAQ:QUBT NASDAQ:UPWK NASDAQ:FA FTMO_OANDA:INTC NASDAQ:NVDA NYSE:APO
Best regards – hi2morrow team.