QQQ / NDX Weekly Outlook – Week 33 of 2026 (17-21 AUG)QQQ WEEKLY MARKET OUTLOOK
QQQ Weekly Recap Outlook
Price first rejected from the Flip Zone at Wednesday's open, activating the Short Scenario.
We took the short setup and captured a 3.6-point, 0.5% move to the downside. We took three partial profits according to the plan, with the remaining position stopped at entry.
Then, on Thursday, price broke out above the Flip Zone and activated Long Scenario 3 after retesting the Flip Level.
The retest entry delivered a 2.5-point, 0.34% move to the upside. We took two partial profits, with the remaining position stopped at entry.
Two trades were taken this week, and both were closed in profit.
A very profitable week overall.
(For reference, I have included last week's outlook on the right.)
Weekly Execution Metrics
Total Trades Activated: 5 (excluding open running equities)
Winning Trades: 5
Losing Trades: 0
Win Rate: 100% (on closed or partially closed sequences)
Index Options: 1 Trade (1 Win — QQQ)
Futures Desk: 4 Trades (3 Wins — NQ, 1 Win — ES)
Tactical Equities: 4 Plays (1 TP, risk-free runner; 3 Open)
Precious Metals: 1 Play (Silver, Open)
Result: Another green week.
This Week's Scenarios / Prediction
Risk Index
This oscillator reads macro conditions and converts them into a technical risk framework. It was developed internally at UA CAPITAL and remains the primary indicator I use for both short-term and long-term positioning decisions.
Long term: Risk on
Mid term: Risk on
Short term: Risk on
The overall market structure remains risk on across all three time horizons.
However, macro liquidity risks remain an important source of downside vulnerability. If negative macro news flow emerges, we could see sharp flushes lower despite the current risk-on structure.
For this reason, we will continue to prioritize disciplined execution, confirmation at key levels, and aggressive profit-taking as positions move in our favor.
Scenarios / Strategies
Long Scenario 1
Demand 1 (730)
This is the first major demand zone. If price reclaims this level with a confirmed 1-hour bullish candle close, long exposure can be considered. An aggressive approach can also be used following a confirmed 15-minute bullish candle close.
Trigger: Price must test the level and produce a bullish 1-hour candle close back above the zone.
Targets: Take partial profits after every $1 advance.
Invalidation: 1-hour candle close below 727.
Long Scenario 2
Demand 2 (718)
This is the second major demand zone. If price reclaims this level with a confirmed 1-hour bullish candle close, long exposure can be considered. An aggressive approach can also be used following a confirmed 15-minute bullish candle close.
Trigger: Price must test the level and produce a bullish 1-hour candle close back above the zone.
Targets: Take partial profits after every $1 advance.
Invalidation: 1-hour candle close below 714.
Long Scenario 3
Flip Level (738)
This is the Flip Level for QQQ to watch. If price breaks above this level with a confirmed 4-hour candle close and subsequently retests the level, a long setup can be considered.
Trigger: Price must break above the level and produce a bullish 1-hour candle close back above the zone. An aggressive approach can also be used following a confirmed 15-minute bullish candle close.
Targets: Take partial profits after every $1 advance.
Invalidation: 4-hour candle close below 736.
Short Scenario 1
Main Supply (741.5)
This area represents the primary supply zone and the upper boundary of the current trading range. A confirmed rejection from this level could provide a tactical short opportunity.
Trigger: Retest of the zone followed by a 1-hour bearish rejection candle. An aggressive approach can also be used following a confirmed 15-minute bearish rejection candle.
Targets: Take partial profits after every $1 decline.
Invalidation: 4-hour candle close above 744.
Position Management Rules
1. Entry model: Unique for every scenario. Read each setup carefully before entering.
2. Take profits in stages because market reversals can happen quickly.
3. After the first profit target is reached, move all remaining stop losses to breakeven and convert the position into a risk-free trade.
4. A reaction from the level must be confirmed. We do not predict price. We react to price.
5. Invalidation levels are unique for each scenario. Read them carefully.
6. SPY & QQQ charts use RTH (Regular Trading Hours). ES & NQ charts use ETH (Electronic Trading Hours).
This analysis is for educational purposes only and reflects my personal opinion. It is not financial advice.
 Long
Long
SPY / SPX Weekly Outlook – Week 33 of 2026 (17-21 AUG)SPY / SPX WEEKLY MARKET OUTLOOK
SPY Weekly Recap Outlook
We didn't take any trades on SPY this week because none of the key levels or scenarios we had mapped out were triggered.
(For reference, I have included last week's outlook on the right.)
Weekly Execution Metrics
Total Trades Activated: 5 (excluding open running equities)
Winning Trades: 5
Losing Trades: 0
Win Rate: 100% (on closed or partially closed sequences)
Index Options: 1 Trade (1 Win — QQQ)
Futures Desk: 4 Trades (3 Wins — NQ, 1 Win — ES)
Tactical Equities: 4 Plays (1 TP, risk-free runner; 3 Open)
Precious Metals: 1 Play (Silver, Open)
Result: Another green week.
This Week's Scenarios / Prediction
Risk Index
This oscillator reads macro conditions and converts them into a technical risk framework. It was developed internally at UA CAPITAL and remains the primary indicator I use for both short-term and long-term positioning decisions.
Long term: Risk on
Mid term: Risk on
Short term: Risk on
The overall market structure remains risk on across all three time horizons.
However, macro liquidity risks remain an important source of downside vulnerability. If negative macro news flow emerges, we could see sharp flushes lower despite the current risk-on structure.
For this reason, we will continue to remain disciplined around key levels and prioritize aggressive profit-taking as the market moves in our favor.
Scenarios / Strategies
Long Scenario 1
Flip Zone (775.25)
This is the first major demand zone. If price reclaims this level with a confirmed 1-hour bullish candle close, long exposure can be considered. An aggressive approach can also be used following a confirmed 15-minute bullish candle close.
Trigger: Price must test the level and produce a bullish 1-hour candle close back above the zone.
Targets: Take partial profits after every $1 advance.
Invalidation: 1-hour candle close below 774.
Long Scenario 2
Demand (770)
This is the second major demand zone. If price reclaims this level with a confirmed 1-hour bullish candle close, long exposure can be considered. An aggressive approach can also be used following a confirmed 15-minute bullish candle close.
Trigger: Price must test the level and produce a bullish 1-hour candle close back above the zone.
Targets: Take partial profits after every $1 advance.
Invalidation: Daily candle close below 767.
Position Management Rules
1. Entry model: Unique for every scenario. Read carefully.
2. Take profits in stages because market reversals can happen quickly.
3. After the first profit target is reached, move all remaining stop losses to breakeven and convert the position into a risk-free trade.
4. A reaction from the level must be confirmed. We do not predict price. We react to price.
5. Invalidation levels are unique for each scenario. Read them carefully.
6. SPY & QQQ charts use RTH (Regular Trading Hours). ES & NQ charts use ETH (Electronic Trading Hours).
This analysis is for educational purposes only and reflects my personal opinion. It is not financial advice.
 Long
Long
Long 
Long 
Long 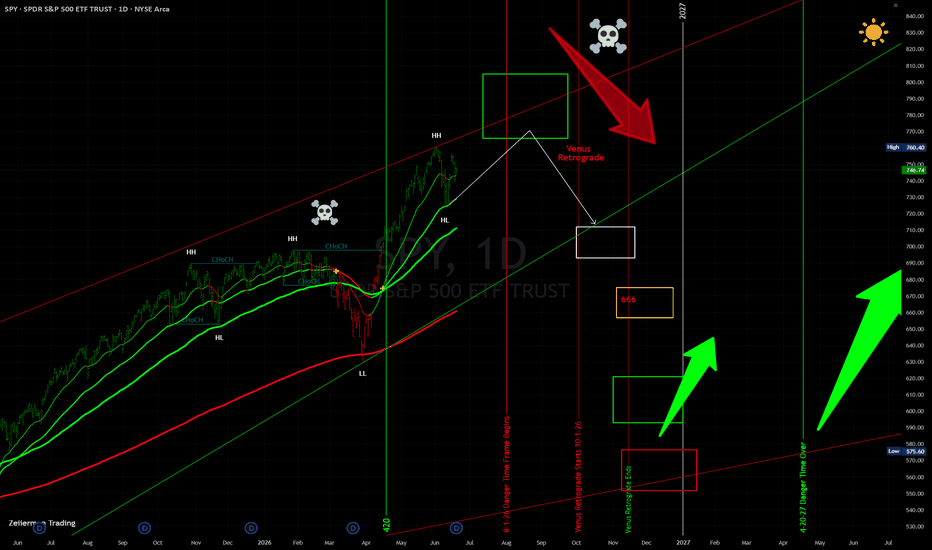
Long 
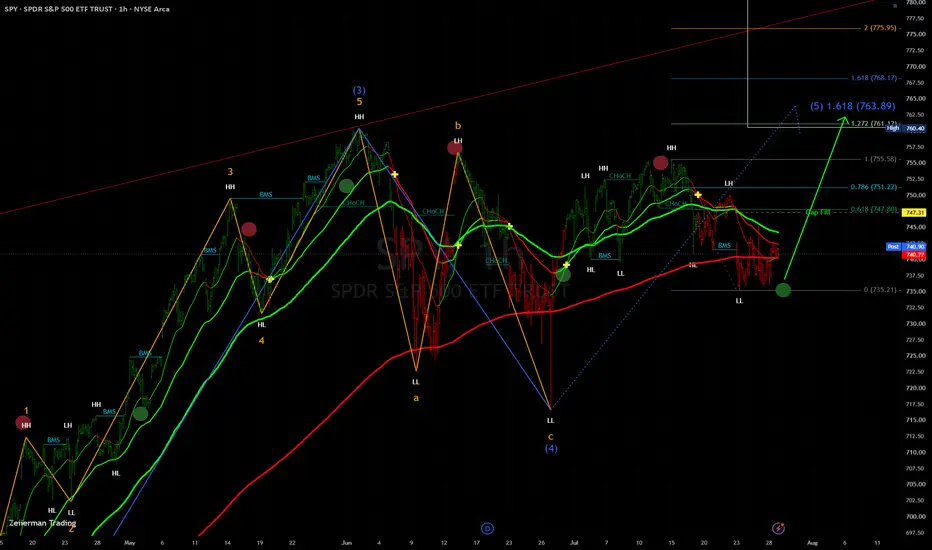
XLB: Large Consolidation Is Building a Higher-Low StructureSniper Alpha has identified a large consolidation developing in XLB, the Materials Select Sector SPDR ETF.
Although price remains inside a broad sideways structure, the internal structure is beginning to improve. XLB has already formed a higher low, followed by a higher high, while the latest pullback is still holding above the major horizontal support area.
This suggests that buyers may be gradually gaining control beneath the descending resistance line.
The main areas to watch are:
Descending trendline resistance
Recent swing-high zone around $52–$53
Major structural support near $49.50–$50.00
A confirmed breakout above the descending resistance, followed by acceptance above the recent highs, could allow XLB to attempt a move toward higher price levels.
Sniper Alpha Framework
Sniper Alpha starts with the sector, reads the price structure, and waits for confirmation before taking action. Improving higher lows and higher highs put XLB on the watchlist, but the breakout still needs to be confirmed.
If XLB continues strengthening, Sniper Alpha will look for individual Materials stocks showing stronger momentum and cleaner setups than the ETF.
No confirmation, no trade. Wait for structure. Respect risk. Long 
VOO TRACKS EVERYTHING THAT IS TRADED IN THE USA.I AM IMPLYING THAT THE MARKETS WILL RALLY VERY HARD.
The Impact of Tariffs and Monetary Policy on VOO and the U.S. Economy
The Vanguard S&P 500 ETF (VOO) has been experiencing significant growth, mirroring the strength of the U.S. economy and the shifting landscape of global finance16. This upward trajectory can be attributed to several interconnected factors, including changes in monetary policy, the implementation of tariffs, and their effects on liquidity and investment patterns.
Central Bank Policies and the Carry Trade
Recent adjustments in interest rates by central banks worldwide have been made to align with the United States' monetary stance24. These changes have implications for the carry trade, where investors borrow in low-interest-rate currencies to invest in higher-yielding assets. The recalibration of interest rates globally could be contributing to increased capital flows into U.S. equities, benefiting funds like VOO.
Tariffs and Domestic Liquidity
The implementation of tariffs by the Trump administration, while controversial, may have unexpected positive effects on U.S. liquidity. Unlike the issuance of Treasury bills, which requires interest payments to foreign buyers, tariff revenues remain within the U.S. economy. This retention of capital can lead to increased domestic liquidity, potentially boosting equity values through direct investment or improved lending conditions for companies1.
The Money Multiplier Effect
Tariff revenues deposited in U.S. banks can trigger a significant money multiplier effect. Through fractional reserve banking, each dollar of tariff revenue could theoretically expand into much larger amounts of credit availability. This process, known as reflation, can stimulate economic activity without necessarily causing inflation5.
Shift from Treasuries to Equities
The influx of tariff revenue may reduce the government's reliance on Treasury bill issuance for funding. This shift could lead to a reorientation of investment patterns, with both domestic and foreign investors potentially increasing their allocation to U.S. equities. For countries seeking to anchor their currencies to dollar-denominated assets, U.S. equities may become an increasingly attractive alternative to Treasuries3.
Global Implications
The changing dynamics of U.S. fiscal and monetary policies have far-reaching effects on global markets. Smaller economies, in particular, may find themselves needing to adjust their currency management strategies, potentially leading to increased investment in U.S. equities as a means of stabilizing their own currencies2.
Inflation Considerations
It's important to note that while the stock market, including VOO, has seen significant nominal gains, the real value of these gains must be considered in light of inflation. With prices having roughly doubled, the purchasing power of investment returns has been affected, underscoring the importance of robust equity performance5.
In conclusion, the current rally in VOO and the broader U.S. equity market can be seen as a result of complex interplay between monetary policy, fiscal measures such as tariffs, and global economic dynamics. As these factors continue to evolve, they are likely to shape the trajectory of U.S. equities and the global financial landscape in the coming years.
 Long
Long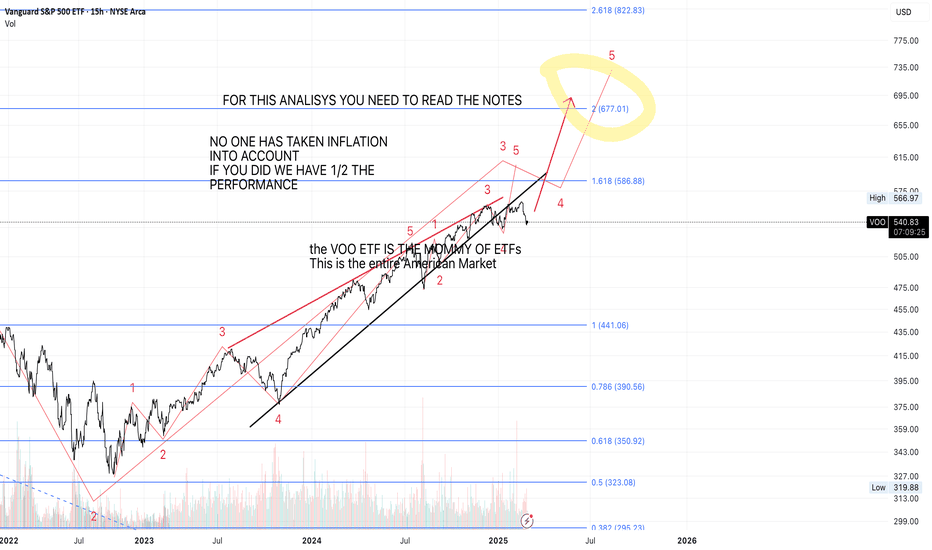
Long 
Short 
Long 
Short 
Long 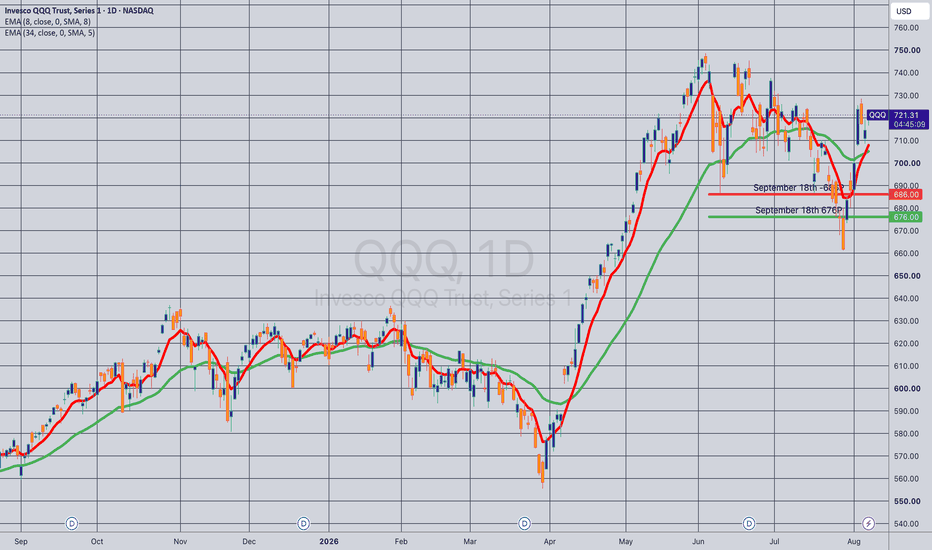
 Long
Long
Research 21.08.2026🌏 Markets:
AMEX:SPY +3.57 0.47%(pre/m)
NASDAQ:QQQ +5.60 0.79%(pre/m)
🆕 Economic News:
CRYPTOCAP:BTC has surged 23% over the past two days, while NASDAQ:MSTR is up 35% and NASDAQ:COIN has gained 27%.
📈 Gap Ups
Reaction to earnings/guidance:
NASDAQ:ROST NYSE:BKE NYSE:BEKE NYSE:BJ NYSE:UI
Other news:
AMEX:GDXU — the Gold Miners 3X Leveraged ETN — has surged more than 50% over the past three days.
-- Another sign that investor interest is shifting from one group of risk assets to another: NYSE:HMY NYSE:GFI NASDAQ:HYMC NYSE:NEM NYSE:AEM NYSE:WPM NYSE:AU and others
Nomura, in its latest Asia ex-Japan Daily Research Summary on Friday, highlighted stronger-than-expected operating performance at NASDAQ:NTES NetEase.
NASDAQ:SKHY considers building memory chip plant in Japan, Hankyoreh reports
NASDAQ:JUNS pumping after 1/75 split
NASDAQ:SPCX : Following the lock-up expiration, $45 billion worth of SpaceX shares will become available for trading.
Spotify NYSE:SPOT increased its share buyback program by $1.5 billion.
📉 Gap Downs
Reaction to earnings/guidance:
NASDAQ:OSIS
Other news:
NYSE:BABA Falls as AI Spending Surges 75% and Profit Misses
NYSE:GSK shares kept at neutral by Citi as unproven phase III pipeline curbs long-term growth
‼️ Additional
UBS Global Wealth Management raised its year-end S&P 500 target to 8,100.
Most analysts are bullish on European equities, with a further 10% gain expected by the end of this year — BBG.
China is rapidly narrowing the gap with the US in AI — BBG.
The USD continues to weaken against major currencies.
-- BofA: A failed intervention in the US bond market risks triggering a sharp decline in the dollar.
-- The stakes are now very high for Bessent, as he needs to preserve market stability ahead of the November US midterm elections.
-- BESSENT: THE SIZE OF BUYBACKS OF LONG-DATED BONDS COULD EXCEED THE $4 BILLION ANNOUNCED YESTERDAY.
🔁 Business Combination / De-SPAC
NASDAQ:RFAI – RF Acquisition Corp II / Nanyang Biologics
Nanyang Biologics is a Singapore-based early-stage biotech using AI to discover drug candidates from natural compounds. Its Vecura / DTIGN platform supports a preclinical pipeline led by NB-A002, an experimental oncology therapy targeting ILF2. The company also has cardiovascular and mental health programs, but currently has no approved drugs and no meaningful commercial revenue.
Expected New Ticker: $NYB
Key points:
Nanyang remains a highly speculative preclinical biotech; valuation is based mainly on future pipeline and AI-platform potential rather than an established commercial business
Net Loss: ~$7.22M for the six months ended March 31, 2026
Cash: ~$0.89M as of Sept. 30, 2025
Low-float setup:
Around 3.998M public RFAI shares remained after an earlier redemption
Holders subsequently submitted preliminary redemption requests for 3.956M shares
If nearly all requests remain in place, the remaining public float could theoretically fall to roughly 42K shares
Final redemption amount and float are not yet confirmed because requests can still be withdrawn
Comparable public companies: NASDAQ:RXRX , NASDAQ:SDGR , NASDAQ:ABCL , NASDAQ:TEM , NASDAQ:CRSP , NASDAQ:BEAM
📋 List of tickers involved:
CRYPTOCAP:BTC NASDAQ:MSTR NASDAQ:COIN NASDAQ:ROST NYSE:BKE NYSE:BEKE NYSE:BJ NYSE:UI NYSE:HMY NYSE:GFI NASDAQ:HYMC NYSE:NEM NYSE:AEM NYSE:WPM NYSE:AU NASDAQ:NTES NASDAQ:SKHY NASDAQ:JUNS NASDAQ:SPCX NYSE:SPOT NASDAQ:OSIS NYSE:BABA NYSE:GSK NASDAQ:RFAI $NYB NASDAQ:RXRX NASDAQ:SDGR NASDAQ:ABCL NASDAQ:TEM NASDAQ:CRSP NASDAQ:BEAM
Best regards – hi2morrow team.
 Long
Long
 Long
Long
Long