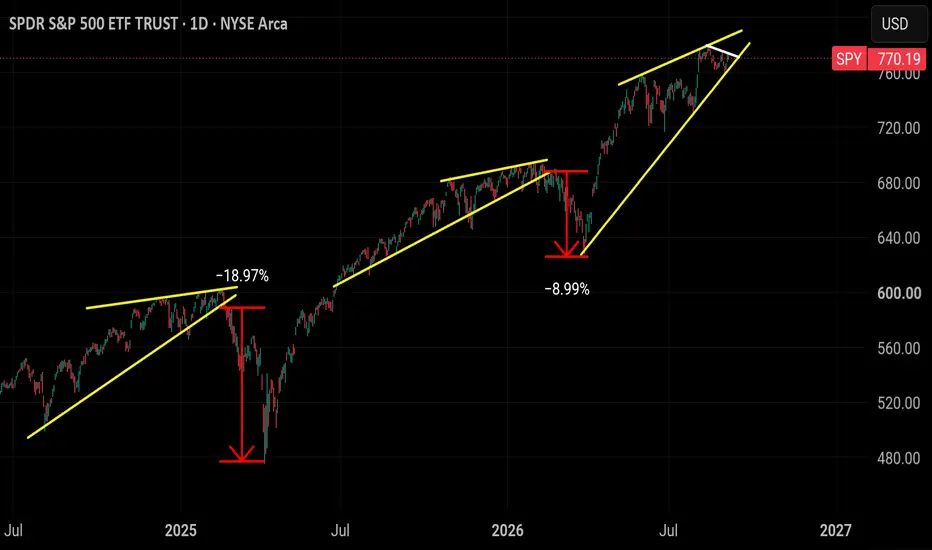
Short
Short
QQQ | Weekly Structure | $750 Area Could Unlock the Final Wave 5Thesis:
QQQ remains in the final stage of the bull cycle that started more than six years ago. The larger structure is still intact and, in my view, one more Wave 5 extension remains possible. The key resistance is now around the $750 area. If that level breaks and flips to support, I would expect the final leg of this cycle to extend toward the $850-$860 area.
Context
- Weekly timeframe
- Last week's stronger US jobs data pushed rate expectations higher and added pressure to long-duration assets
- This week the main macro focus shifts to PPI on Thursday and CPI on Friday
- CPI is the main near-term catalyst I am watching
- QQQ is still trading within the final stage of the larger bullish structure
- I am not a buyer at current prices
What I see
- The larger Wave III completed before the sharp Wave IV correction
- That correction held the long-term structure and price subsequently resumed higher
- The 0.618 Fib extension around $656 has acted as important support
- That area is also converging with the rising 50-week MA around $648
- Price remains above both levels, keeping the primary bullish count intact
- The next major resistance sits around the $750 area
- The final 2.618 Fib extension sits around $859
What matters now
- $650 area is the key weekly support area
- The $750 area is the main resistance that needs to break
- A clean breakout followed by a successful retest would confirm the next stage of Wave 5
- If that happens, I would expect the final extension toward approximately $850-$860
- A hotter inflation reading would likely put renewed pressure on yields and technology
- The larger bullish structure remains valid while the major weekly supports continue to hold
Buy / Accumulation zone
- I am not interested in buying QQQ around current prices
- The current move is already in a late stage of the larger cycle
- My long-term accumulation area remains significantly lower, approximately $450-$350
- The 200-week MA currently sits around $479
- That is the type of correction where I would start becoming interested again
- During major corrections, TQQQ is the instrument I have historically used to build higher-beta Nasdaq exposure
- I would only consider deploying significant cash there after a major reset
Targets
- Key support: approximately $656-$648
- Bull Case breakout: approximately the $750 area
- Final Wave 5 target zone: approximately $850-$860
- 2.618 Fib extension: approximately $859
- Long-term accumulation zone: approximately $450-$350
Market context
I still don't believe this cycle has completed, although we are clearly much closer to the end than the beginning.
From current levels, the final Wave 5 would offer roughly another 20% of potential upside if the structure continues to develop as expected. That is meaningful, but it does not make QQQ attractive to me as a new long-term entry here.
My focus at this stage is to see whether the $750 area can be reclaimed and whether the final extension develops.
At the same time, I am already looking ahead to the much larger opportunity that could appear after this cycle eventually resets.
The $450-$350 area is where that conversation becomes interesting for me.  Long
Long
QQQ: volume node tests, breaks and retestsThe useful part of a volume node is how price behaves when it comes back.
On QQQ's September 3–4 five-minute chart below, weekly and monthly high-volume areas overlap around 716.4–719.2. That gives us a common zone to track through several different reactions. The main chart provides a 15-minute overview; the detailed five-minute snapshot preserves the configuration used for these approximate levels.
On September 3, price rallies into the zone from below. Pullbacks repeatedly approach its lower edge and recover. Those reactions give the area a case for potential support.
On September 4, price breaks above the upper boundary and reaches roughly 721.8. It then falls back inside. The break did not establish lasting support above the zone.
Later, price revisits the lower portion, recovers again and rotates toward the upper boundary by the close. The same node remains relevant after the breakout: first as an area price reclaims, then as a range it leaves, re-enters and tests again.
This is how I read confluence: mark the overlap, then watch the response. A retest that holds supports one interpretation; sustained trade below the lower boundary would weaken it. Repeated tests do not guarantee that the next one holds.
Charted with Volume Profile Node Map (VPNM) , displaying shared weekly/monthly nodes as boxes. The profiles share underlying trading history; overlap alone does not establish a higher probability of success. Volume is estimated from OHLCV data. This is a historical chart study, with approximate prices. Auto row calibration can change the displayed boundaries with the chart interval.
 Long
Long
Monday Night Market Report — Week of Sept. 8–11The broad setup heading into Tuesday is cautious, not panicked.
The biggest macro issue remains the same:
Strong jobs + elevated energy prices + inflation risk + higher-for-longer rate pressure.
Oil remains elevated as geopolitical tension continues around the Strait of Hormuz, and that matters because energy is feeding directly into the inflation conversation just days before PPI and CPI.
Last week’s strong employment report also complicated the rate outlook and increased the importance of this week’s inflation data.
The Weekly SPY Battlefield
SPY finished Friday around 769.47, sitting immediately below a dense structural area around 770–771.
That gives us a clean opening map.
771 is the first major upside decision area.
Above that:
773 PDH → 774 Projected AOA
If buyers reclaim and hold that ladder, the Green scenario opens toward roughly 776–778.
Below current price:
769 is the immediate hinge.
A sustained loss of that area puts 766 → 765 into play, where we have another meaningful cluster of projected structure.
If that entire area fails, the Red outer scenario extends toward approximately 762.
Yellow — Current Base Case
Right now, Yellow is the most probable scenario in my view.
But that does not mean I expect SPY to simply move sideways all week.
Yellow can still involve a meaningful move in both directions.
We could see:
Drop first → recover later
or
Run first → give it back later
As long as the week ultimately remains contained within the broader negotiation structure, that still fits the Yellow thesis.
That is why I like this scenario map better than forcing a directional prediction.
The market can change on a dime.
And the biggest mistake we could make this week is refusing to adjust our approach when the evidence changes.
A scenario is a preparation tool, not something we marry.
Green Scenario
Green starts with a reclaim of 770–771.
From there, I want to see acceptance rather than a quick rejection.
The next tests are:
773 → 774
If those areas are reclaimed and held, especially alongside cooler inflation data or easing pressure from yields and energy, the market could expand toward the 776–778 region.
Those are outer scenario boundaries, not guaranteed targets.
Red Scenario
Red starts with a meaningful loss of 769.
From there, 766–765 becomes the next major battlefield.
I would expect negotiation there rather than assuming a straight-line selloff.
If that structure fails, downside expansion toward approximately 762 becomes possible.
The downside tail still deserves respect because a hot inflation print would arrive on top of elevated energy prices, strong employment data and renewed rate concerns.
Key Catalysts
This is a back-loaded week.
Wednesday
Apple’s major product event could matter more for QQQ and mega-cap sentiment than SPY broadly.
Thursday — 8:30 AM ET
PPI
This is the first major macro test of the week.
Thursday also brings the ECB decision and major earnings including ORCL and ADBE, which could influence software and AI sentiment.
Friday — 8:30 AM ET
CPI
This is the biggest scheduled event of the week.
With energy prices elevated and the jobs report already strengthening the hawkish side of the argument, CPI could easily determine whether the week stays Yellow or finally expands into Green or Red.
Current Read
Going into Tuesday:
Yellow > Red > Green
But that weighting is temporary.
If price reclaims 771–774 and begins accepting above it, Green deserves more weight.
If 769 fails and sellers begin accepting below it, Red deserves more weight.
And if SPY spends the week whipping between both sides without establishing a new regime, Yellow wins regardless of whether we dropped first or rallied first.
Preparation > Prediction.
The market does not owe us consistency with tonight’s map.
Our job is to recognize when the evidence changes and change with it. Long 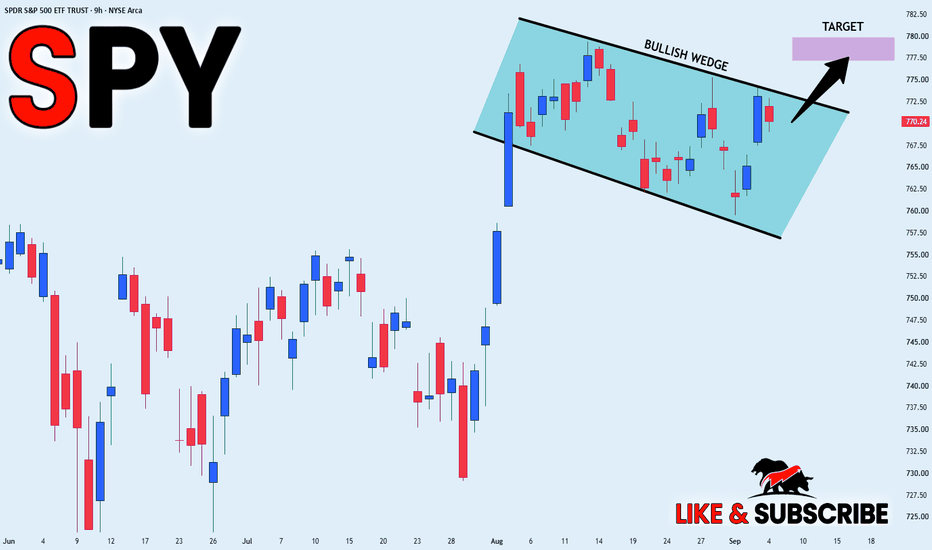
QqqGoing over Qqq and majority of major techh sectors.
Here are the sectors along with the major stocks influencing them.
AMEX:XLC - NASDAQ:GOOGL , NASDAQ:META
Weekly chart
Stuck beneath the weekly 50ma.
Push and pull between Googl and meta is keeping this sideways.
Daily chart
Stuck under the daily 200ma but keeps bouncing off the 50ma. Like I said , they sell googl when this tags the 200ma and pump meta when it hits the 50ma support.
My guess is its not enough capital to pump both..
For this week they'll probably continue with the googl dump and Meta pump.
AMEX:XLY - NASDAQ:TSLA and NASDAQ:AMZN
Honestly this sector looks the worse short term
Weekly chart
Headed back to support or near July lows
Rejected weekly 20/50ma last similar to NASDAQ:TSLA , coincidence? Nope.
Daily chart
I think NASDAQ:TSLA pulls this back down to support
CBOE:MAGS
Weekly chart,
Stuck in the middle of a major wedge almost near ATH
Monthly candle of June, look at the volume there; it will be selling pressure up there until it gets over 72.00. I just don't see a catalyst this month that will push it over that volume
Daily chart
I think we start the week with some light selling and pick up with some heavy selling next week.
CBOE:IGV
Software sector - NASDAQ:MSFT , NYSE:ORCL , NYSE:CRM , NASDAQ:PLTR
I know everyone think software is back but there is still some hurdles
Weekly chart
Rising wedge retest last week at the high.
Daily chart
We closed right on top of the 20ma.. so I can't predict the next move, what I will say is ,
Over 106 and we head back to 111
Below 103.50 and 94 comes
Have to just see how this plays out, they haven't been pumping Chips and software together so if they pump Chips this week then the bear scenario will come
CBOE:DRAM - memory sector
NASDAQ:SNDK NASDAQ:MU
Honestly , nothing bearish here except for that white trendline.
Above 60.00 and they push this to 62 and memory pumps
Below 58.50 and this was a Bulltrap and we are headed back down to July lows
NASDAQ:SOXX - Chips
NASDAQ:INTC and NASDAQ:AMD
Weekly chart
Hammer candle i think this heads back to the weekly 20ma this week.
Daily chart
Wedge breakout
538 was the weekly 20ma, its also the daily 50ma and gap resistance. I think we get a push back there this week
NASDAQ:SMH - Chips
NASDAQ:NVDA and NYSE:TSM
Daily chart
Won't go to in depth simply because the setup is identical to NASDAQ:SOXX but less upside. Push up to 574-578 which is
Gap resistance
Trendline resistance
Weekly 20ma
So a summary of what I see on the sectors is a chip prop and pump for the week while most mags and software stock sell.
Favorite long setup is
NASDAQ:INTC to 100
Favorite short setup is
NASDAQ:TSLA to 336
And finally NASDAQ:QQQ
First you need to understand how I come to my conclusion
Qqq is comprised of 100 tech companies
By weight Chips and memory stock Weigh 27% of this index
In comparison software stocks only weigh
18%.
Not only do they out weigh any other sector in qqq but on average they make bigger moves % base.
Where ever chips goes, qqq will also unless there is a significant move on the software side like NASDAQ:MSFT down 5%.
NASDAQ:QQQ
So many traps to 730 gap close..
That 722-727 is so toxic .
Unless we gap below 714 Monday i expect prop and chop into cpi with mix moves on various tech
If chips pump, we take out the 730 gap and then head back down. The only scenario where we continue higher into 750 is if chip sector breaks above their weekly 20ma
I'm looking for this scenario then a hard sell into in of Sept
I know some of you think ath is coming but I'm telling you its all traps up here with very little liquidity, and this is why they can only pump 1 half of tech at a time .
Monthly chart logarithmic
17yr resistance
Every bullish picture near this trend line is pure Bull crap.
Last time qqq showed a bullish breakout near this trendline was late 2024. I warned then like I'm warning now
Monthly candle for June was a dragon fly doji bearish reversal.
The close of that candle was 736; this means any push up to that area will face sellers
Lastly to add to the 17yr trendline , here's your 3yr resistance showing strong resistance around 733-737
And that's a wrap.. This Shi took me all morning to convey , hope it helps you for the month of Sept
Short 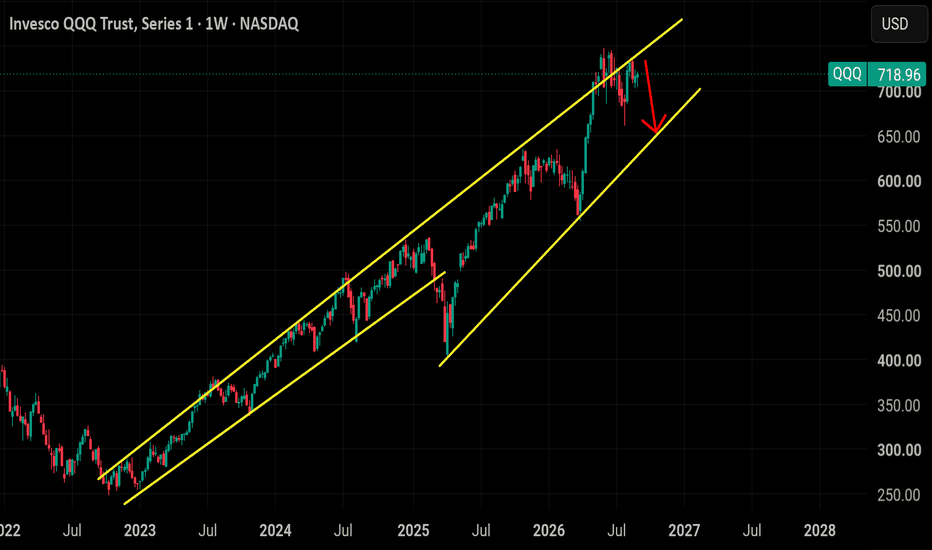
 Short
Short
SpyI won't be going over tech at all in this post.
I'll be covering , energy, TVC:VIX , TVC:DJI , AMEX:IWM , AMEX:XLF and TVC:NYA .
Warnings signs flashing
Bearish ascending broadening wedge showing on AMEX:IWM TVC:DJI $NYA.
Also Dow Jones printed a monthly reversal candle for August.
At some point in the next 2 weeks things will turn severely bearish and sell into October.
TVC:DJI
Like I said earlier monthly candle for August was a topping tail reversal
Ascending broadening wedge here
That's has already fulfilled the required amount of trendline touches
Could sell at any moment, target is 48,000
Same analysis here with $NYA.
Made a weekly lower high at resistance downtrend
AMEX:IWM
Same sight, but I will say the weekly finish with a hammer candle at support.
I think iwm has already did the first move on the ascending broadening wedge here and is now doing the dead cat bounce before the major leg down.. upside this week is 297.50 then head back down.
If they don't take out 292 by Wed then expect a bounce into 297 before the short
Weekly RSI showing bearish divergence
No real money this summer, algo pump
Lastly
Financials
AMEX:XLF
Top of a 2 year range here . Trend support has turned this into a rising wedge.
Next step is the banks most likely slide with TVC:NYA and $IWM.
NYSE:JPM and NYSE:GS will weigh down the $DJI.
Red line is what I think comes next but blue box is a possible chop scenario but i doubt it.
AMEX:KRE
Regional banks
Weekly bearish engulfing at the top of the channel here
TVC:VIX
A push up to 18 minimum this week, over 18.50 and 21 comes.
A lot of monthly ,weekly and daily moving averages around 18.00 -19.00 as a bull you don't want to see vix clear and hold above 18.00
AMEX:SPY
Held all Friday at 20ma (Purple line)
Below 769.00 and they head for 764 gap close and trendline support.
If they hold 764, then look for a dead cat bounce back to 770 -772 before what I believe is the REAL leg down..
Over 775 and 785 comes (I doubt it)
Only place I'd try calls this 763-765 and that's for a move back to 770.
All signs point to 756 either this week or next; That's the 50ma and my first target.
Below 754 and 746 gap close comes which is also the weekly 20ma
Short 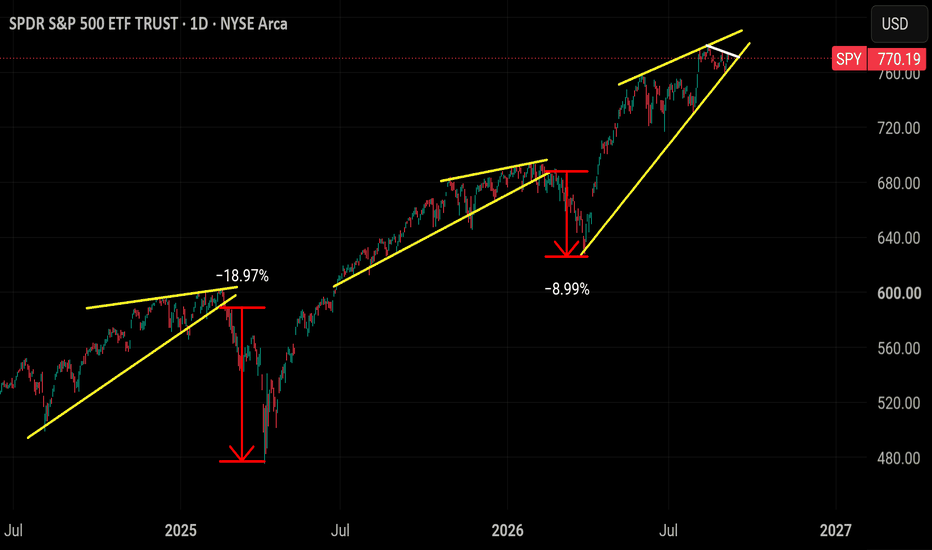
Short 
Short 
SPY / SPX Weekly Outlook – Week 35 of 2026 (AUG 31 -SEP 04)SPY / SPX WEEKLY MARKET OUTLOOK
SPY Weekly Recap Outlook
Although the early week Demand Zones were not perfectly retested, our structural maps remained highly accurate.
• Demand Zone: Price did not provide the precise retest required for a high conviction entry, so we avoided forcing a trade.
• Long Scenario 3: During Thursday’s AM session, price broke above our predefined Flip Level, officially activating Long Scenario 3.
• Entry Discipline: Since the breakout did not provide the required pullback, we remained patient and did not chase the move.
• Price Expansion: Following the breakout, price delivered a clean 8-point (+1.00%) upward expansion.
• Execution Takeaway: The move validated the strength of our structural mapping and the institutional geometry behind our playbooks, even without a direct entry.
UA CAPITAL Trading Desk Weekly Execution Metrics | WEEK 34
Total Trades Closed: 11
Winning Trades: 8
Losing Trades: 3
Overall Win Rate: 73%
Index Options: 1 Trade (1 Win — QQQ)
Futures Desk: 5 Trades (2W 2L on ES | 1W on NQ)
Equities Desk: 1 Trade (1 Win — MSFT)
Precious Metals: 2 Trades (2 Wins — Silver & Copper)
Forex: 1 Trade (1 Win — EUR Short)
Portfolio Hedge: VIX 17C - L (Controlled Insurance Premium)
This Week's Scenarios / Prediction
Risk Index
This oscillator reads macro conditions and converts them into a technical risk framework. It was developed internally at UA CAPITAL and remains the primary indicator I use for both short-term and long-term positioning decisions.
Long term: Risk on
Mid term: Risk on
Short term: Risk off
A warning: Macro liquidity conditions remain fragile, and a negative news catalyst could still trigger a sharp downside flush. Geopolitical risk, particularly the Iran conflict, remains elevated, while the macro environment continues to show significant compression and imbalance.
SPY Technical Look
There are two zones where I expect bullish reactions.
Flip Level: 767.5
Main Bounce Zone: 759
If price finds support and bounces from either of these two levels, I expect the following bullish targets:
Bullish Target 1: 774.5
Bullish Target 2: 779.5
A break below the Flip Level could initiate a move toward the First Key Level below.
This analysis is for educational purposes only and reflects my personal opinion. It is not financial advice.
QQQ / NDX Weekly Outlook – Week 35 of 2026 (AUG 31 - SEP 04)QQQ WEEKLY MARKET OUTLOOK
QQQ Weekly Recap Outlook
NASDAQ:QQQ served as our primary operational focus and executed flawlessly.
• Demand 1 Entry: Price delivered a textbook entry from our predefined Demand 1 Zone on Monday, providing the exact reaction we were looking for.
• Long Scenario 1: The setup captured a massive 20-point (+2.85%) bullish expansion.
• Target 1: Price reached the predefined Flip Level exactly as mapped.
• Bullish Target 1: The bullish continuation extended into Bullish Target 1, completing the full scenario as planned.
• Execution Outcome: The trade delivered an exceptional return and demonstrated the accuracy of our structural mapping and predefined levels.
(For reference, I have included last week's outlook on the right.)
UA CAPITAL Trading Desk Weekly Execution Metrics | WEEK 34
Total Trades Closed: 11
Winning Trades: 8
Losing Trades: 3
Overall Win Rate: 73%
Index Options: 1 Trade (1 Win — QQQ)
Futures Desk: 5 Trades (2W 2L on ES | 1W on NQ)
Equities Desk: 1 Trade (1 Win — MSFT)
Precious Metals: 2 Trades (2 Wins — Silver & Copper)
Forex: 1 Trade (1 Win — EUR Short)
Portfolio Hedge: VIX 17C - L (Controlled Insurance Premium)
This Week's Scenarios / Prediction
Risk Index
This oscillator reads macro conditions and converts them into a technical risk framework. It was developed internally at UA CAPITAL and remains the primary indicator I use for both short-term and long-term positioning decisions.
Long term: Risk on
Mid term: Risk on
Short term: Risk off
A warning: Macro liquidity conditions remain fragile, and a negative news catalyst could still trigger a sharp downside flush. Geopolitical risk, particularly the Iran conflict, remains elevated, while the macro environment continues to show significant compression and imbalance.
NASDAQ:QQQ Technical Look
There are two zones where I expect bullish reactions.
SWING LEVEL: 710
SUPPORT 2: 686
If price finds support and bounces from either of these two levels, I expect the following bullish targets:
FLIP LEVEL: 726.5
BULLISH TARGET 1: 738
BULLISH TARGET 2: 747
Flip Level Rejection: If price gets rejected at the Flip Level, we may look for a short opportunity targeting the Swing Level first, with further downside toward Support 2.
Decision Zone: The Flip Level appears to be a critical decision zone for the next directional move.
Blue Box Breakdown: If price breaks below the Blue Box, we may look for a short setup targeting Support 2.
A strong break above the Flip Level could initiate a move toward the Bullish Targets above.
This analysis is for educational purposes only and reflects my personal opinion. It is not financial advice.
Long


 Short
Short
Market Structure Lab: Why 702 Never Became a Bearish Breakdown MARKET STRUCTURE LAB — WHY 702 NEVER BECAME A BEARISH BREAKDOWN
Acceptance vs. Intraday Weakness
One of the easiest mistakes in technical analysis is treating every move toward support as a breakdown.
Last week’s QQQ price action gave us a clean real-world example of why that distinction matters.
Before the week began, the primary map was simple:
702.14 SUPPORT
vs.
725.39 BREAKOUT RESISTANCE
There was also an intermediate decision area at:
711.37–713.16
Early in the week, QQQ lost that intermediate zone and traded down toward approximately 704.66.
The chart looked weak. Momentum had deteriorated. Price was moving toward the larger support level.
But one thing had not happened:
702.14 had not failed.
That distinction changed the interpretation of the entire week.
———
THE FIRST LESSON: WEAKNESS IS NOT THE SAME AS BREAKDOWN
A market can weaken without breaking its larger structure.
QQQ losing 711–713 told us something important:
The immediate structure had weakened.
It did not tell us:
The larger bearish scenario had confirmed.
That required a separate condition — acceptance below approximately 702.
Until that happened, the correct interpretation was:
Weakness inside the range.
Not confirmed expansion below it.
———
TEST → BREAK → ACCEPTANCE
It helps to separate a support interaction into stages.
1. TEST
Price approaches or trades into a known support area.
Nothing has failed yet. The level is being challenged.
2. BREAK
Price trades through the level.
This is new information, but a single move through support can still be a liquidity sweep, intraday overshoot or temporary loss.
3. ACCEPTANCE
Price begins behaving as though the market now considers the other side of the level valid territory.
Acceptance can show up through combinations of:
• closes beyond the level
• inability to reclaim it
• follow-through in the direction of the break
• failed retests
• structure beginning to build on the other side
• momentum or participation supporting the move
No single item has to become a universal rule.
The important concept is:
A price touch is an event.
Acceptance is a change in market behavior.
———
WHAT QQQ ACTUALLY DID
QQQ lost the 711.37–713.16 intermediate zone early in the week and pushed lower.
That was legitimate bearish evidence.
But as price approached the larger ~702 support area, sellers never established acceptance beneath it. QQQ reached roughly 704.66 and reversed.
702.14 remained intact.
That meant the larger bearish scenario never activated.
Later, price reclaimed 711.37–713.16.
Thursday produced the reclaim. Friday held above it. QQQ then pushed toward approximately 721.86 before finishing the week near 718.96.
The sequence became:
Intermediate support lost
→ larger support holds
→ intermediate zone reclaimed
→ price returns toward resistance
That is very different from:
Support lost
→ breakdown confirmed
→ bearish expansion
The second sequence never happened.
———
WHY WAITING FOR ACCEPTANCE MATTERED
Suppose the analysis had simply said:
“QQQ fell below 713, therefore bearish.”
That would have correctly identified short-term weakness, but it would have incorrectly upgraded that weakness into a larger structural conclusion.
The original map prevented that.
The bearish thesis had a defined trigger:
Below ~702 with acceptance.
Because that trigger never occurred, there was no reason to prematurely activate the deeper bearish scenario.
This is one of the primary advantages of building the decision framework before price moves.
You are not forced to reinterpret every candle emotionally.
The market either satisfies the condition or it does not.
———
THE RECLAIM MATTERS TOO
There is a second lesson here.
A failed level can change roles again.
711.37–713.16 began the week as a gap / reclaim decision zone. Price lost it, later reclaimed it, and then held above it.
That sequence gives the area a different role heading into the next week.
Instead of asking:
“Will price fill the gap?”
the more useful question becomes:
“Can buyers maintain acceptance above the reclaimed area?”
The same prices are still on the chart.
Their market-structure meaning has changed.
———
A LEVEL IS NOT JUST A LINE IN THE SAND
Support and resistance are often discussed as though price should bounce from an exact number.
Real markets are messier.
A useful level is better treated as an area where we expect the market to reveal information.
At support, we are asking:
Do sellers gain acceptance below it?
Do buyers reclaim it?
Does price immediately reject the break?
Does the market begin building structure beneath it?
At resistance, the questions reverse.
This shifts technical analysis away from:
“Price touched my line.”
toward:
“What did price prove after reaching my level?”
That second question is much more useful.
———
WHY WICKS CAN BE MISLEADING
Markets regularly trade beyond obvious levels.
Stops cluster around them. Liquidity clusters around them. Breakout orders cluster around them.
Because of that, the first move through a widely watched level can sometimes provide less information than what happens immediately afterward.
A wick through support followed by a strong reclaim tells a very different story than price breaking support, closing beneath it and failing every attempt to recover it.
Same level.
Very different market behavior.
That is why the framework emphasizes:
CONFIRMATION + ACCEPTANCE
rather than treating every penetration as a completed breakout.
———
THE PRACTICAL DECISION TREE
PRICE APPROACHES SUPPORT
→ Observe the reaction.
PRICE TESTS SUPPORT
→ No structural conclusion yet.
PRICE TRADES BELOW SUPPORT
→ Warning. Look for confirmation.
PRICE RECLAIMS QUICKLY
→ Breakdown thesis weakens.
PRICE ACCEPTS BELOW
→ Bearish scenario gains credibility.
PRICE ACCEPTS BELOW + FOLLOW-THROUGH DEVELOPS
→ The next downside structural reference can become active.
The point is to keep the analysis conditional.
The market provides the answer.
———
WHAT THIS HELPS PREVENT
Waiting for acceptance can help reduce several common errors:
• shorting directly into support because price “looks weak”
• buying the first wick through resistance because it “broke out”
• activating measured targets before the underlying pattern confirms
• changing the entire thesis because of one volatile candle
• confusing intraday volatility with structural change
It does not eliminate losing trades.
Nothing does.
The goal is better classification of what the market has actually proven.
———
THE QQQ EXAMPLE IN ONE SENTENCE
QQQ became weaker below 713, but it never became structurally bearish below 702.
That is the distinction.
Once 702 held and 711–713 was reclaimed, the evidence changed again.
The market had answered the question.
———
A REUSABLE FRAMEWORK
This concept is not specific to QQQ.
It applies to:
• support and resistance
• breakout trading
• range boundaries
• trendlines
• prior highs and lows
• gaps and FVGs
• supply and demand zones
• double tops and bottoms
• head-and-shoulders structures
The specific confirmation method can change.
The principle does not:
Do not confuse interaction with confirmation.
A market reaching your level proves the level is being tested.
What happens after the test tells you whether the thesis has actually changed.
———
MARKET STRUCTURE LAB — KEY TAKEAWAY
Technical analysis becomes more useful when levels are treated as decision points rather than predictions.
Last week’s QQQ map did not require us to guess whether 702 would hold.
It gave us two different paths:
Hold / reclaim
→ bearish expansion remains inactive.
Accept below
→ bearish expansion activates.
The market chose the first path.
That is the purpose of confirmation.
Map the level.
Define what failure actually means.
Then make price prove it.
Educational analysis only. Not financial advice. Education 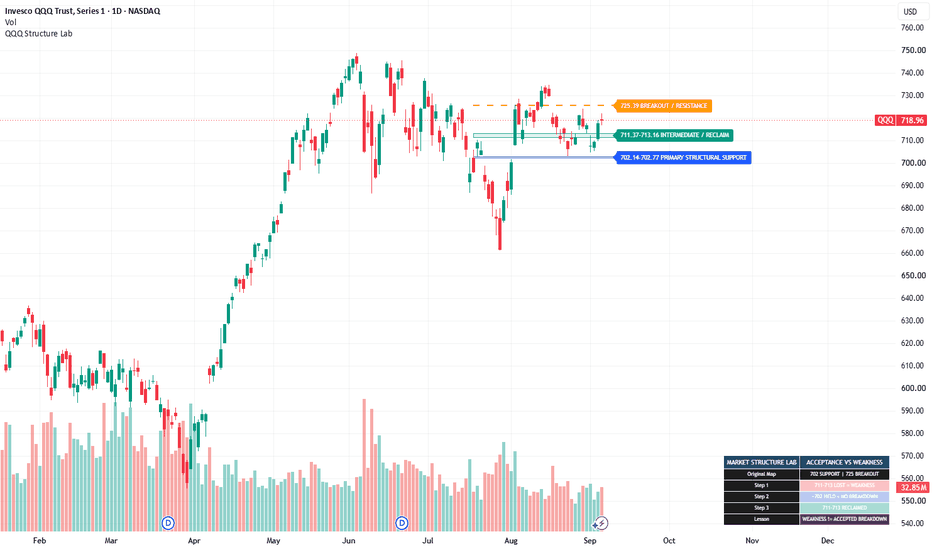
Short 
QQQ Weekly Outlook: 713 Support vs 725 Breakout | Sep. 8–11QQQ WEEKLY OUTLOOK — 713 SUPPORT VS. 725 BREAKOUT | SEP. 8–11
QQQ enters the shortened post-Labor Day week with a stronger internal structure than it had one week ago — but still without a confirmed breakout.
Last week’s map was built around one primary decision range: 702.14 support vs. 725.39 breakout resistance. Neither boundary broke with acceptance.
Instead, QQQ spent the entire week inside that range, briefly lost the intermediate 711.37–713.16 area, held the larger ~702 support structure, reclaimed 711–713 late in the week, and finished near 718.96.
That makes the next decision clearer rather than more complicated:
713 SUPPORT
vs.
725 BREAKOUT
The higher-timeframe trend remains constructive.
The question is still location.
———
LAST WEEK → THIS WEEK
The most important development from last week was not a breakout. It was the change in role of 711.37–713.16.
That area began as an open gap / reclaim decision zone. Price traded through it early in the week, so the gap itself is no longer an unfilled downside magnet. QQQ then reclaimed the area Thursday and held above it Friday.
For the new week, 711.37–713.16 becomes the first meaningful support / acceptance zone underneath price. That does not automatically make QQQ bullish at any price — it simply means the first test has moved higher.
The larger structural support remains clustered around roughly 702, while 725 remains the level price still has to prove it can accept above.
———
TREND VS. LOCATION
Current structure has improved:
Daily trend: BULLISH
Weekly trend: BULLISH
Monthly trend: BULLISH
Momentum has also improved, while the broader structure remains somewhat mixed.
That creates a familiar distinction:
Trend = bullish.
Location = still near resistance.
QQQ is above the reclaimed 713 area, but it is still trading underneath the 725 breakout zone and near the descending resistance structure that has capped recent advances.
A bullish trend does not eliminate resistance, and resistance does not automatically reverse a bullish trend.
Price still has to resolve the location.
———
TECHNICAL DECISION MAP
Immediate support / acceptance:
711.37–713.16
Primary structural support:
~702.14–702.77
Deeper support:
686.19
Major lower support:
662.46
Breakout resistance:
~725.07–725.39
Upside reference 1:
736.10
Upside reference 2:
745.74
The developing DB? and DT? structures currently visible on the chart remain exactly that: developing .
Neither is confirmed, so neither has an active measured-move target. The previous DB/DT targets are retired as untriggered references after last week remained inside the decision range.
Measured targets are conditional on confirmation — not permanent predictions.
———
OPEN GAP / FVG CONTEXT
The prior 711.37–713.16 open gap has now been traded through and reclaimed. That changes its role.
It should no longer be treated as an unfilled-gap target. It is now more useful as a support / acceptance reference.
The chart will continue to track only the nearest relevant still-open bullish gap or FVG below price when one exists. An open imbalance is a reference — not a requirement that price must return to it.
For this week, the reclaimed 711–713 area matters more than trying to force an old gap-fill narrative.
———
WEEKLY RANGE CHECK — TECHNICAL VS. OPTIONS
QQQ finished Friday near 718.96.
The immediate technical decision range is approximately:
713.16 → 725.07
The larger nearby structural range is approximately:
702.77 → 736.10
Using the Sep. 11 options expiration and the near-ATM 720 strike as a straddle reference, the options market was pricing roughly an $11 move into Friday — approximately:
~708 → ~730
Agreement:
The options range comfortably encompasses both 713 support and 725 breakout resistance.
Difference:
Options pricing allows some movement beyond the immediate decision range, but its current expected band stops short of the larger 702 support and 736 resistance references.
Read:
Options are pricing enough movement for QQQ to challenge or break the immediate 713–725 range this week, but a move toward 702 or 736 would represent a larger-than-currently-priced expansion.
That is exactly why confirmation at the boundaries matters.
———
CROSS-MARKET CONFIRMATION
The broader backdrop is mixed rather than uniformly bullish or bearish.
RATES — HEADWIND
The 10-year Treasury yield finished Friday around 4.78% after the stronger-than-expected employment report revived expectations for another Fed hike.
Rate markets moved from roughly a coin flip before payrolls to around a 58–62% probability of a September hike afterward. That keeps duration-sensitive growth stocks facing a real macro headwind heading into inflation week.
TECH / SEMIS — CONFIRMING
Despite the rate move, semiconductor stocks showed notable relative strength Friday, with the PHLX Semiconductor Index gaining roughly 3.4%.
QQQ itself finished slightly positive even while the broader S&P 500 and Nasdaq Composite declined. That is constructive internal leadership — but it was selective rather than broad.
BREADTH / SMALL CAPS — NOT BREAKING DOWN
The Russell 2000 gained about 0.25% Friday while the S&P 500 declined roughly 0.38%.
So higher yields did not produce a broad risk-off washout across equities. That is a modest confirmation that participation remains healthier than the headline index declines might suggest.
DOLLAR — NEUTRAL / WATCH
The dollar initially jumped after payrolls but failed to sustain a clean move above its 200-day moving average.
A fresh dollar breakout alongside rising yields would add pressure to growth assets. Failure to break higher would remove one potential headwind.
VOLATILITY — STILL CONTAINED
VIX finished the week around the mid-14s.
That is not a stress signal by itself, although Thursday and Friday carry concentrated inflation-event risk.
CROSS-MARKET READ:
QQQ has constructive trend and technology leadership.
Rates remain the clearest conflicting input.
That makes this week’s inflation data especially important.
———
CATALYST MAP — NOT JUST A CALENDAR
U.S. markets are closed Monday for Labor Day, leaving four regular sessions.
The most important catalysts become progressively larger as the week develops.
WEDNESDAY — APPLE EVENT + LABOR-COST DATA
BLS releases Employer Costs for Employee Compensation at 10:00 a.m. ET. Apple also holds its September product event at 1:00 p.m. ET.
What matters for QQQ:
If AAPL responds positively and QQQ is already pressing 725, Apple could help provide the megacap participation needed for breakout acceptance.
If AAPL sells the news while QQQ is rejecting 725, that would reinforce the resistance case.
The product announcement itself matters less than the market reaction.
———
THURSDAY — PPI + ECB + ADOBE
August PPI is released at 8:30 a.m. ET. The ECB also concludes its monetary-policy meeting Thursday, and Adobe reports earnings that day.
What matters:
Cooler inflation / falling yields + QQQ holding 713
→ improves the bullish setup into 725.
Hot inflation / renewed yield expansion + rejection near 725
→ increases the probability of a 713 retest.
The reaction in Treasury yields is likely more important than simply whether PPI prints above or below consensus.
———
FRIDAY — CPI
August CPI is released Friday at 8:30 a.m. ET.
This is likely the week’s largest macro catalyst because the Fed meets September 15–16 and the strong jobs report has already pushed markets toward a more hawkish policy expectation.
The scenario reaction is straightforward:
Softer inflation + yields lower + acceptance above 725
→ bullish expansion receives confirmation.
Hotter inflation + yields higher + loss of 713
→ the reclaim structure begins to fail.
Hotter inflation + acceptance below ~702
→ the larger bearish scenario finally activates.
Again, the number itself is not the trade thesis.
Price + rates reacting to the number is the evidence.
———
BULLISH SCENARIO
QQQ holds 711.37–713.16 and continues building above the reclaimed zone.
That keeps 725 in play.
The real bullish trigger remains:
725.07–725.39 BREAK + ACCEPTANCE
Not a wick.
Not a brief intraday trade above it.
Acceptance.
If QQQ establishes above that area, the next major upside reference becomes:
736.10
Beyond 736.10:
745.74
Those levels become relevant only after the breakout confirms.
———
NEUTRAL / RANGE SCENARIO
QQQ holds 713 but continues rejecting 725.
That leaves price trapped in the new upper decision range:
713 → 725
In that environment, there is no reason to manufacture a directional prediction.
The correct read remains:
Constructive structure.
Unresolved location.
This is effectively the same patience principle that controlled last week — only with the lower tactical boundary now raised after the successful reclaim.
———
BEARISH SCENARIO
A move back below 711.37–713.16 would be the first warning that the late-week reclaim is failing.
That would shift attention toward the larger structural support around:
~702
But just as last week demonstrated, trading toward 702 is not the same as breaking 702.
The larger bearish scenario requires:
ACCEPTANCE BELOW APPROXIMATELY 702.14–702.77
If that occurs, the market has lost both the reclaimed intermediate structure and the primary structural support.
The next downside reference becomes:
686.19
Below that:
662.46
Those lower levels do not activate while ~702 continues to hold.
———
WHAT WOULD CHANGE THE MAP?
ABOVE 725 WITH ACCEPTANCE
The range resolves bullishly.
736.10 becomes active.
BETWEEN 713 AND 725
Constructive, but unresolved.
Patience remains appropriate.
BELOW 713
The reclaim begins to fail.
~702 comes back into focus.
BELOW ~702 WITH ACCEPTANCE
The larger bearish scenario activates.
686.19 becomes the next major reference.
———
BOTTOM LINE
QQQ begins the shortened week with stronger trend alignment than it had one week ago. Daily, weekly and monthly structure are now bullish.
The former 711.37–713.16 gap zone has been filled, reclaimed and converted into the first important support test. But price is still underneath the same resistance structure that has prevented a larger breakout.
That makes the next decision straightforward:
713 SUPPORT
vs.
725 BREAKOUT
Options are pricing enough movement for that immediate range to resolve.
Rates remain the primary macro conflict, while semiconductor strength and small-cap resilience provide constructive counter-evidence.
And with PPI Thursday and CPI Friday immediately ahead of the September Fed meeting, the back half of the week has the catalysts needed to test whether price can finally escape the range.
Until it does:
Trend is bullish.
Location remains unresolved.
Confirmation decides the next move.
Informational purposes only. Not financial advice.