Short
Short
 Short
Short
SPY Aug 17–21: Back at Equilibrium, With Expansion Levels on BotSPY enters the week of August 17–21 with price sitting almost directly on top of the model’s weekly equilibrium.
That is a very different setup from last week.
Last week, SPY began near the upper edge of the forecast distribution, leaving a large gap between price and the model’s center of gravity. This week, that gap has largely disappeared. The new weekly equilibrium sits at 778.01–778.85, placing the market near the center of the expected weekly distribution.
That makes the opening part of the week especially important.
Rather than beginning from an extended location, SPY is starting from an area where the market has room to establish direction on either side.
The first upside test is 782.96–784.64.
This is the immediate resistance area I will be watching. A sustained move through **784.64** would indicate that buyers are successfully moving SPY away from equilibrium and into the upper half of the weekly distribution.
If that happens, 789.59 becomes the next upside objective.
Beyond 789.59, the weekly upper extreme sits at 794.54. Movement into this area would represent a significant upside expansion relative to the week's starting distribution.
The important distinction is acceptance versus a temporary probe. A brief move above 784.64 followed by a return toward equilibrium would suggest that the market is still balanced rather than beginning a genuine expansion.
On the downside, 773.06–771.38 is the first major test.
As long as SPY holds this area, weakness can still be treated as rotation around the weekly equilibrium rather than a meaningful deterioration in structure.
A sustained break below 771.38, however, would shift attention toward 766.43.
Below that, 759.80 represents the extreme lower end of the weekly distribution.
Weekly Decision Map
Upper Decision Area: 782.96–784.64
Upside Path: 789.59
Upper Extreme: 794.54
Equilibrium: 778.01–778.85
Lower Decision Area: 771.38–773.06
Downside Path: 766.43
Lower Extreme: 759.80
Final Read
This week's SPY setup is unusually clean because price begins close to equilibrium. There is no need to predict direction before the market shows it.
The 778 area is the week's center of gravity
784.64 and 773.06 define the first meaningful boundaries around it.
Acceptance above 784.64 would favor upside expansion toward 789.59, with 794.54 available if momentum continues.
Acceptance below 773.06, particularly if 771.38 also fails, would favor downside expansion toward 766.43.
Until one side establishes control, movement around 778 should be treated as balance rather than a directional signal. Long

XAR BREAKS TO A NEW ALL-TIME HIGH — Is Aerospace & Defense Start
AMEX:XAR just closed at $296.73, after reaching $297.79, pushing through its previous all-time-high area.
But the ATH is only part of the story.
TECHNICAL PICTURE
On the weekly chart, XAR appears to have completed a large inverse Head & Shoulders formation.
The structure is interesting:
Left shoulder formed during the first part of 2026.
The deeper correction created the head.
Buyers stepped back in around the rising long-term trend.
The right shoulder held substantially above the major 2025 lows.
Price has now broken the ~$290–295 neckline / previous ATH zone.
That means two important technical events are happening together:
1. Breakout from a multi-month bullish reversal/continuation structure.
2. Breakout into price discovery above the previous ATH.
If the breakout holds, the chart opens potential upside zones around $320, $327 and eventually the $340–350 area based on the projection shown on the chart.
The level I would watch most closely now is not $320.
It is $290–295.
A successful retest of the old resistance as new support would make the breakout considerably more convincing. A weekly move back below that area would raise the possibility of a failed breakout.
FUNDAMENTALS ARE SUPPORTING THE CHART
XAR isn't a single defense contractor. It tracks a modified equal-weighted basket of U.S. aerospace and defense companies, which spreads exposure across the industry rather than allowing a few mega-cap names to dominate the ETF.
And the spending backdrop remains unusually strong.
At the 2025 Hague Summit, NATO members committed to moving toward 5% of GDP in defense and defense-related investment by 2035, including at least 3.5% for core defense requirements. European Allies and Canada had already increased combined defense expenditure by nearly 20% in real terms in 2025.
Meanwhile, S&P Global's 2026 aerospace & defense outlook describes strong commercial and defense demand, with suppliers increasing production to meet demand. It also points to the proposed U.S. 2027 defense budget of nearly $1.5 trillion, although the final enacted amount remains uncertain.
So this isn't simply a technical breakout occurring in isolation.
Price is breaking out while the industry's underlying demand cycle remains strong.
THE RISK
New ATH breakouts can also become crowded very quickly.
Supply-chain constraints remain an issue for aerospace manufacturers, higher production requires more capital, and future defense spending still depends on political and budget decisions.
So chasing a vertical move is very different from seeing the breakout confirmed.
For me, $290–295 is now the battlefield.
Above it → price discovery remains intact.
Below it → the breakout deserves another look.
What would you do here?
🟢 Buy the ATH breakout ?
🔵 Wait for a $290–295 retest ?
🔴 Too extended — stay away ?
I’m curious to see how traders are reading this one.
Long 
Adam Khoo’s 16 Golden Investment RulesFOCUS ON QUALITY. THINK LONG TERM. INVEST WITH DISCIPLINE.
1. The Stock Market Always Goes Up in the Long Run.
This long-term trend is driven by inflation, earnings growth and index re-balancing.
2. In the Short Term, nobody can predict where the market will go.
When we can make profitable guesses based on the existing price trend, markets can be completely irrational in the short-term. Be prepared for all eventualities.
3. Never act on the predictions and opinions of economists or market analysts.
Never make decisions based on predicting where the market is going in the short term.
4. Over the last 100 years, there have been 50 Corrections of More than 10%.
These 10% corrections that occur once every 2 years, are good buying opportunities.
5. Over the last 100 years, there have been 20 declines of more than 20%.
These bear markets (averaging -30% decline) that happen once every 5 years, are your golden buying opportunities.
6. Only invest in stocks of great companies with wide economic moats, consistent growth in sales, strong cash flow, high return of capital, strong growth catalysts and strong balance sheets.
7. Only invest in stocks of businesses you truly understand.
Invest in businesses whose products and services you use yourself. Avoid stocks that are outside your circle of competence.
8. Avoid investing in mediocre or low quality stocks no matter how cheap they appear.
Cheap crap is still crap.
9. A great business may be a lousy investment if you overpay above its intrinsic value.
A great business is only an excellent investment when you buy it below its intrinsic value.
10. Never give in to the Fear of Missing Out (FOMO) and buy hyped-up stocks that are overvalued or technically overextended.
11. Only invest with money you don’t need to use for at least 3-5 years.
An investment needs time to generate rewards after its 3rd to 5th year.
12. Buy shares of great companies consistently, whenever they are undervalued and whenever they are at technical support levels.
Always buy into a full position over 3-4 tranches.
13. We can never buy at the absolute bottom.
As long as we get a price that is fundamentally undervalued and technically supported, it is one of the many buying opportunities.
14. Always maintain a portfolio of at least 10 to 30 high quality companies with fairly equal allocation to each stock.
Speculative growth companies should have half a unit allocation.
15. Maintain a diversification over Growth, Defensive, Dividend & Speculative Growth Stocks.
16. Sell a stock the moment it fails to be a great business (economic moat deteriorates).
Sell a stock if you can deploy the proceeds into an even better investment (stronger moat, better value & higher growth).
Source: Adam Khoo / Piranha Profits
Long 
 Long
Long
Treasury movesThe two paths
Path A — Coordinated intervention / FIMA backstop (current policy)
Dollar: weakens against the yen but the Treasury market is alleviate from forced selling.
Treasuries: forced-seller pressure removed; yields more contained.
Stocks: modestly positive. Yields matter more than USD/JPY.
Slight tailwind to US multinationals; headwind to Japanese exporters. Reversal risk: if the rate gap doesn't close and intervention fails, expect a yen-carry unwind — sharp, short, global equity drawdown.
Bitcoin: mildlypositive. FIMA is dollar-liquidity provision (feeds the "they'll always print" thesis)
Path B — Japan sells Treasuries unilaterally (pre-July pattern)
Dollar: again, weekness against the yen, plus a credibility problem — largest holder liquidating = demand erosion and feeds the de-dollarization narrative.
Treasuries: direct supply increase; yields higher. Toward 5% on the 10-year the regime shifts from growth-fear to fiscal-credibility-fear.
Stocks: negative, scaled to the yield move. Multiple compression; hits small caps, real estate, utilities, high-multiple tech. Japan hurt twice (imported inflation plus rising Japanese Government Bond yields).
Bitcoin: split. bullish narrative (de-dollarization; mechanics bearish liquidation). Likely draws down with risk assets first.
Bottom line
Both paths weaken the dollar against the yen. The difference is what happens to the Treasury market underneath: A protects it, B stresses it.
Stocks clearly prefer A. Bitcoin's price prefers A while the bitcointhesis is fed by B.
Implications
Neither path argues for Bitcoin as a stabilizer in that sleeve — its short-run behavior is equity beta, not a hedge. Path B is the scenario the gold / commodity / non-USD sovereign sleeve exists for in an all-weather portfolio. There I said it. Follow the golden rule. Education 
RSP/SPY Signals Improving Market BreadthThe RSP/SPY ratio is showing improving relative strength, suggesting that market participation is broadening beyond the largest S&P 500 companies. After bottoming around 0.272 in May, the ratio has recovered toward 0.287, indicating that the equal-weight S&P 500 (RSP) has been outperforming the market-cap-weighted S&P 500 (SPY).
The technical structure has also turned constructive. RSP/SPY is currently trading above both the 20-day EMA and 50-day EMA, with the 20-day EMA slightly above the 50-day EMA. This bullish moving-average alignment indicates improving relative momentum and supports the view that equal-weight stocks are beginning to gain leadership.
However, the ratio is approaching a stronger resistance near 0.296–0.298. A decisive breakout above these levels would provide stronger confirmation of sustained relative outperformance by RSP and could signal further improvement in market breadth.
Relative-Strength Phases
The chart can be divided into several distinct phases:
Phase 1 – August to October 2025: Relative Weakness
RSP/SPY declined during this period, indicating that large-cap stocks were outperforming the average S&P 500 stock. This suggested relatively narrow market leadership.
Phase 2 – October 2025 to February 2026: Broadening Participation
The ratio recovered significantly from its October 2025 low and moved higher into February 2026. This indicated that equal-weight stocks were gaining ground relative to SPY, pointing toward improving market breadth and broader participation.
Phase 3 – February to May 2026: Renewed Large-Cap Leadership
The ratio experienced a sharp decline from February into May 2026, eventually reaching approximately 0.272. This indicated a renewed period of large-cap outperformance, with the largest companies once again driving more of the S&P 500's performance.
Phase 4 – May to August 206: Recovery in Market Breadth
Since the May low, RSP/SPY has established a strong recovery, reaching approximately 0.287. This suggests that breadth has improved substantially, with the average S&P 500 company once again gaining relative strength versus the largest constituents.
Long 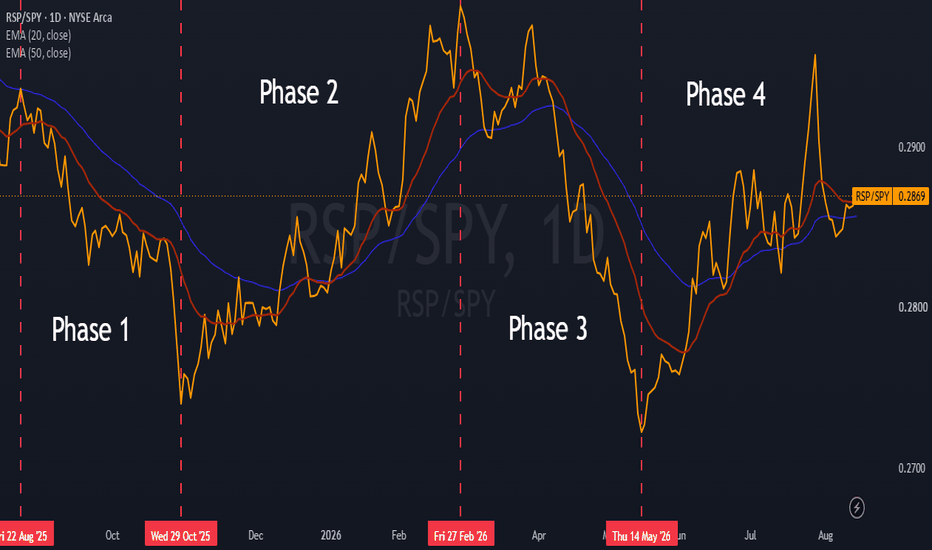
QQQ / NDX Weekly Outlook – Week 32 of 2026 (10-14 AUG)QQQ / NDX WEEKLY MARKET OUTLOOK
QQQ Weekly Recap Outlook
The QQQ weekly analysis delivered two winning trades last week.
A total of two trades were taken, and both finished as winners, resulting in a 100% win rate.
The breakout of the Pivot Zone resulted in a 41.5-point move, representing approximately a 6% upside move.
The retest of the Swing Zone then generated an additional 11.5-point move, representing approximately a 1.60% upside move.
(For reference, I have included last week's outlook on the right.)
UA CAPITAL Weekly Execution Metrics
Total Trades Taken: 8
Winning Trades: 6
Losing Trades: 2
Win Rate: 75%
Index Options: 7 Trades (5 Wins / 2 Losses)
Futures Desk: 1 Trade (1 Win — ES)
Tactical Equities: 0 Trades
Result: Another deep green week.
This Week's Scenarios / Prediction
Risk Index
This oscillator reads macro conditions and converts them into a technical risk framework. It was developed internally at UA CAPITAL and remains the primary indicator I use for both short-term and long-term positioning decisions.
The Risk Index algorithm is currently signaling the potential for a short-term bounce. However, the broader short to medium-term environment continues to price in the possibility of another meaningful downside flush.
The long-term model remains firmly risk on, while the medium-term outlook continues to lean slightly bearish.
This combination typically creates elevated volatility, with both bulls and bears competing aggressively for control before a larger directional move eventually develops.
Given the potential for acceleration in either direction and increasingly violent reversals, our focus this week will remain on aggressive profit-taking and disciplined risk management.
Scenarios / Strategies
Long Scenario 1
Support Level 1 (714)
This is the first major demand zone. If price reclaims this level with a confirmed 1-hour bullish candle close, long exposure can be considered.
Trigger: Price must test the level and produce a bullish 1-hour candle close back above the zone.
Targets: Take partial profits after every $1 advance.
Invalidation: 1-hour candle close below 714.
Long Scenario 2
Support Level 2 (707.5)
This is the second major demand zone. If price reclaims this level with a confirmed 1-hour bullish candle close, long exposure can be considered.
Trigger: Price must test the level and produce a bullish 1-hour candle close back above the zone.
Targets: Take partial profits after every $1 advance.
Invalidation: 1-hour candle close below 707.5.
Long Scenario 3
Flip Level (726.5)
This is the primary Flip Level for QQQ to monitor. If price breaks above this level with a strong 4-hour candle breakout and subsequently returns for a retest, a long opportunity can be considered.
Trigger: Price must break above the level and produce a bullish 1-hour candle close back above the zone.
Targets: Take partial profits after every $1 advance.
Invalidation: 4-hour candle close below 726.5.
Short Scenario 1
Main Supply (735)
This area represents the primary supply zone and the upper boundary of the current trading range. A confirmed rejection from this level could provide a tactical short opportunity.
Trigger: Retest of the zone followed by a 1-hour bearish rejection candle.
Targets: Take partial profits after every $1 decline.
Invalidation: 4-hour candle close above 744.
Position Management Rules
1. Entry model: Unique for every scenario. Read each setup carefully before entering.
2. Take profits in stages because market reversals can happen quickly.
3. After the first profit target is reached, move all remaining stop losses to breakeven and convert the position into a risk-free trade.
4. A reaction from the level must be confirmed. We do not predict price. We react to price.
5. Invalidation levels are unique for each scenario. Read them carefully.
6. SPY & QQQ charts use RTH (Regular Trading Hours). ES & NQ charts use ETH (Electronic Trading Hours).
This analysis is for educational purposes only and reflects my personal opinion. It is not financial advice.
Long 
SPY / SPX Weekly Outlook – Week 32 of 2026 (10-14 AUG)SPY / SPX WEEKLY MARKET OUTLOOK
SPY Weekly Recap Outlook
Last week, SPY did not provide the retest we were waiting for, so no trade was taken on SPY. However, the bullish move toward all-time highs developed aggressively in the direction outlined in our previous outlook.
(For reference, I have included last week's outlook on the right.)
UA CAPITAL Weekly Execution Metrics
Total Trades Taken: 8
Winning Trades: 6
Losing Trades: 2
Win Rate: 75%
Index Options: 7 Trades (5 Wins / 2 Losses)
Futures Desk: 1 Trade (1 Win — ES)
Tactical Equities: 0 Trades
Result: Another deep green week.
This Week's Scenarios / Prediction
Risk Index
This oscillator reads macro conditions and converts them into a technical risk framework. It was developed internally at UA CAPITAL and remains the primary indicator I use for both short-term and long-term positioning decisions.
The Risk Index algorithm is currently signaling the potential for a short-term bounce. However, the broader short to medium-term environment continues to price in the possibility of another meaningful downside flush.
The long-term model remains firmly risk on, while the medium-term outlook continues to lean slightly bearish.
This combination typically creates elevated volatility, with both bulls and bears competing aggressively for control before a larger directional move eventually develops.
Given the potential for acceleration in either direction and increasingly violent reversals, our focus this week will remain on aggressive profit-taking and disciplined risk management.
Scenarios / Strategies
Long Scenario 1
KEY Level 1 (768)
This is the first major demand zone. If price reclaims this level with a confirmed 1-hour bullish candle close, long exposure can be considered.
Trigger: Price must test the level and produce a bullish 1-hour candle close back above the zone.
Targets: Take partial profits after every $1 advance.
Invalidation: 1-hour candle close below 768.
Long Scenario 2
KEY Level 2 (758.5)
This is the second major demand zone. If price reaches this area and confirms support, long exposure can be considered.
Trigger: Price must test the level and produce a bullish 1-hour candle close back above the zone.
Targets: Take partial profits after every $1 advance.
Invalidation: Daily candle close below 755.
Position Management Rules
1. Entry model: Unique for every scenario. Read each setup carefully before entering.
2. Take profits in stages because market reversals can happen quickly.
3. After the first profit target is reached, move all remaining stop losses to breakeven and convert the position into a risk-free trade.
4. A reaction from the level must be confirmed. We do not predict price. We react to price.
5. Invalidation levels are unique for each scenario. Read them carefully.
6. SPY & QQQ charts use RTH (Regular Trading Hours). ES & NQ charts use ETH (Electronic Trading Hours).
This analysis is for educational purposes only and reflects my personal opinion. It is not financial advice.
Long 
QQQ: Who blew up? The answer usually marks the lowThe weekly signal did its job and tagged target #1 at 665.25, bouncing 11.59% off the low. That part is mechanical and it is finished. What follows is discretionary, and I want the two kept separate.
My read is that the low is probably in, and the reason is who was selling into it.
The low printed on 29 July. On 30 July the first reporting landed, and on 31 July the detail: Situational Awareness, the AI fund run by Leopold Aschenbrenner, had gone from around $45B to roughly $10B, down 67% in July on reported leverage as high as 400%, liquidating its leveraged public book to Citadel at a discount. The fund was up 439% in the first half of the year. The selling happened before anyone reported it. The low came first, the name came second.
That order is the pattern, not a coincidence. When a market dislocates and a fund dies into it, the news of who died lands after the low. Desks feel it in the tape well before they know the name. Something is being liquidated, the size is wrong for the news flow, and the question going around between traders is who blew up, was it you. By the time the name is public the position is already gone. The forced seller does not come back either, because somebody liquidated at the low does not get a good re-entry . That supply is spent rather than sitting overhead waiting to be sold again.
The cleanest precedent is OptionSellers.com in November 2018. Naked short natural gas calls, the spike hit on 14 November, the accounts were liquidated that week, and the story broke on 19 November. The name arrived five days after the damage was done. Here it took one.
There is a second thread. The book Situational Awareness was forced to sell included SK Hynix, one of the two names carrying KOSPI. I published a quarterly idea on that index when it broke, arguing it fell because leverage sat on top of two-name concentration rather than because of anything about the companies. The forced seller in that decline and the forced seller in the AI complex turn out to be the same one. Two indices, one liquidation, and the second one explains the first.
Levels. 665.25 is where target #1 was tagged, and the 29 July low sits against it. Overhead is 731.62, the first Warsh FOMC event-range median, with further weekly stops at 743.18 and 720.06. Below, the lattice runs 609.61, 558.37, 511.44 and 468.45.
Bias: constructive short and mid term while that low holds. A weekly close back under it and this read is wrong, in which case the lower lattice is live and the mechanical signal reasserts itself.
To be plain about what this is. A mechanical target was hit, and the judgement about what comes next is mine, sitting on top of it. No position, timestamped call.
Cheers,
Ivan Labrie. Long 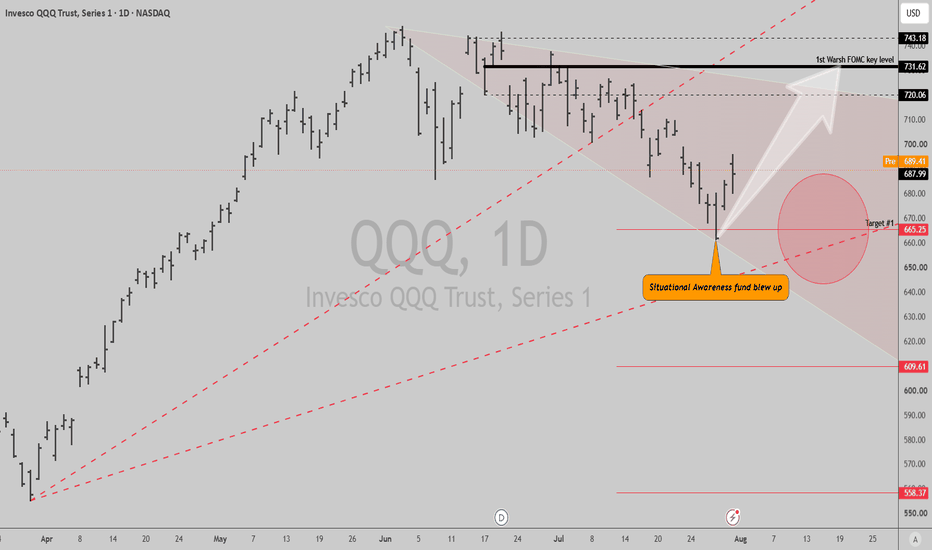
Short 
 Long
Long
 Long
Long
 Long
Long