SLV – Same Setup as GLD. Tighter Risk. Better Retracement LevelThe numbers here are wild. Silver hit an all-time high of $121.62 on January 29, 2026 — then got cut in half. Sixth consecutive annual supply deficit, 46.3 million ounce shortfall, and 58% of global silver demand now comes from industrial use — AI hardware, solar panels, EVs. Here's the post — kept tighter since the macro setup mirrors GLD:
SLV – Hit $121 in January. Done a Full 50% Retracement. Tighter Risk Than Gold. Same Pattern.
─────────────────────────────────
If you read my GLD post — same macro setup, same pattern, same catalyst dates. But SLV has something GLD doesn't.
A full 50% retracement from the January all-time high gives you a precise level to trade against. The setup is tighter. The risk is cleaner. And silver has an industrial demand story underneath it that gold doesn't have.
─────────────────────────────────
WHY SILVER IS A DIFFERENT ANIMAL THAN GOLD
─────────────────────────────────
Gold is a monetary metal. Silver is that AND an industrial metal — and the industrial side is what most traders completely ignore.
Industrial applications now make up over 58% of global silver demand. Solar panels alone are projected to consume more silver every single year through the 2030s. AI hardware, EVs, and electronics are all silver-intensive. Every data center being built right now uses silver. Every solar panel. Every EV battery pack. The same AI buildout theme driving NVDA, MRVL, and CRWV is also driving structural silver demand — it's just not obvious yet.
The Silver Institute confirmed the sixth consecutive annual supply deficit at 46.3 million ounces — wider than last year's 40.3 million ounce shortfall. Six years in a row where the world is consuming more silver than it mines. That's not a trading narrative. That's a structural supply problem getting worse every year.
─────────────────────────────────
THE TECHNICAL SETUP
─────────────────────────────────
MACD on SLV just turned positive on July 6 — and looking at historical instances when SLV's MACD turned positive, the price continued higher in the majority of cases over the following month. That's a momentum signal aligning with the macro setup right at the 50% retracement level.
Same as GLD — I want a sideways day or two here to let the pattern tighten before entry. The 50% retracement gives a clean defined risk level. Stop under it. If that level breaks the setup is wrong and you get out clean.
─────────────────────────────────
TRADE PLAN
─────────────────────────────────
Pattern: 50% retracement bounce — bottoming setup
Stop: Under the 50% retracement level / 50 SMA
Prefer: 1-2 inside or sideways days before entry
Hard catalyst dates: CPI July 14, FOMC July 28-29
Structural thesis: Six consecutive supply deficits, 58% industrial demand, AI hardware tailwind
─────────────────────────────────
THE RISK
─────────────────────────────────
Hot CPI and a hawkish FOMC are the twin headwinds that killed silver from January to now. If that story doesn't change, the retracement goes deeper. Silver is more volatile than gold — it moves faster in both directions. The stop under the retracement level matters more here than it does on GLD.  Long
Long
GLD – Everyone Chased AI. Gold Quietly Building a Bottom Here.Gold had one of the biggest runs in history to start 2026. Then it gave back 28% in a matter of months. Most traders moved on. That's usually when I start looking.
GLD is sitting right at the 50 SMA and starting to bounce. $400 is the key level. If we can get a sideways day or two here and let the pattern tighten, this sets up for a powerful move with a stop under the 50 SMA.
─────────────────────────────────
WHY GOLD SOLD OFF AND WHY THAT'S CHANGING
─────────────────────────────────
The selloff had a specific cause. The US-Iran conflict drove energy prices and inflation higher. Higher inflation raised Fed rate hike expectations. Higher rate expectations pushed real yields up — and rising real yields are the single biggest headwind for gold. That's the mechanical reason for the 28% drop. Clean and logical.
Now the mechanics are reversing. The Trump administration announced a peace deal that led to the reopening of the Strait of Hormuz — energy prices are coming down. June NFP missed, knocking the dollar to 100.85 and gold closed up 1.69% on the session. Yields are pulling back. The exact conditions that drove the selloff are unwinding.
June CPI drops July 14 — that's the next decisive catalyst. A cooler inflation print sends gold ripping. A hot print extends the pressure. That's the binary event sitting on the calendar right now.
─────────────────────────────────
THE INSTITUTIONAL SETUP
─────────────────────────────────
The big money never left. Central banks are projected to buy 800 tonnes of gold in 2026 as nations diversify away from dollar-denominated assets. That's a structural bid underneath the market regardless of short-term rate noise.
The institutional price targets tell you where the smart money thinks this goes. Goldman Sachs has a $5,400 year-end target. JPMorgan raised their 90-day target to $5,000 with a bullish scenario pointing to $6,000-$6,300. Morgan Stanley sits near $4,800. Every major bank still sees significantly higher prices. They all still call the structural bull case intact.
Stock Market Watch
New Fed Chair Kevin Warsh was sworn in May 2026 and his FOMC voted 9-3 to hold rates at the July 29 meeting — internal division at the Fed while inflation is showing signs of cooling is historically very constructive for gold.
─────────────────────────────────
THE SETUP
─────────────────────────────────
Bottoming pattern forming right at the 50 SMA. Gold just posted its first monthly gain since February in July. The pattern needs a day or two to tighten — an inside day or small pullback to let the base set cleanly. If it gets that and $400 on GLD holds as support, this sets up for a move back toward the highs.
Most of the market is chasing AI, semis, and growth. Gold is sitting quietly at a 28% discount to its January high with every major institution calling the bull case intact. That's the setup.
─────────────────────────────────
TRADE PLAN
─────────────────────────────────
Trigger: $400 on GLD holds and pattern tightens
Stop: Under the 50 SMA
Hard catalyst date: June CPI — July 14
Pattern: Bottoming formation off 50 SMA
Prefer: 1-2 sideways days before entering for cleaner risk/reward
─────────────────────────────────
THE RISK
─────────────────────────────────
Hot CPI on July 14 re-ignites Fed rate hike fears and gold breaks the 50 SMA hard. Rising real yields are still the primary headwind. A fall of more than 10% from current levels is possible if growth stays resilient and yields stay elevated. The 50 SMA stop is non-negotiable. If that level breaks the bottoming thesis is wrong and you get out.
 Long
Long
Build a Revision Ledger for Monthly Jobs DataAs of August 7, 2026, 8:30 a.m. ET
Economic releases arrive in vintages. The first estimate is useful, but later releases can rewrite the recent path. A simple revision ledger prevents the newest headline from erasing what was known earlier.
1. Save each vintage
For every monthly release, record the observation month, release date and time, value first reported, latest revised value, revision amount, and primary source link.
For the July employment release, the newest payroll estimate was -23,000. May changed from +129,000 to +63,000, and June changed from +57,000 to +20,000.
2. Calculate the revision column
Use: revision = latest value - previous value. That gives -66,000 for May and -37,000 for June, or -103,000 combined.
3. Keep three layers separate
First print: What did the newest observation say?
Revised history: How did prior observations change?
Current status: What does the full updated sequence imply now?
In this release, the historical adjustment had a larger absolute effect on the recent path than the newest monthly observation.
4. Add the next test
A ledger becomes actionable when it includes the next scheduled evidence. The preliminary annual benchmark update is scheduled for August 28, and the next employment report for September 4.
5. Define invalidation
A softening interpretation should be reconsidered if later revisions restore much of the missing growth or subsequent reports show renewed, broad improvement. Further downward revisions or persistent declines would reinforce it.
This framework works for any revised economic series: preserve the vintage, calculate the change, update the trend, and state what evidence would change the reading.
Source: U.S. Bureau of Labor Statistics, Employment Situation, released August 7, 2026. Educational information only; not investment advice. Economic estimates can change, and trading involves risk of loss. Education 
ARKK ETF: Trapped in a Pinning Regime? Title: ARKK ETF: Trapped in a Pinning Regime? Quant & Technical Deep Dive 📉🤖
🧠 Fundamental Overview:
The ARK Innovation ETF (ARKK), managed by Cathie Wood, is a fund focused on disruptive innovation characterized by a high-risk/high-volatility profile and a long-term approach.
The current price hovers around $75 - $76.
Year-to-date, the fund has registered a moderate return of ~7.38% (significantly underperforming traditional indices), with a 1-year cumulative return of approximately 5.43%.
Additionally, it carries a relatively high expense ratio of around 0.75% annually, a steep management cost compared to traditional index funds like the S&P 500.
📊 Technical Breakdown (1D Timeframe):
Looking at the daily chart, ARKK experienced a massive 30% profit-taking wave starting last October, plummeting from roughly $92 down to $63. This descent closely tracked a uniform Elliott Wave sequence. However, near the start of Wave 3 (around December/January), the price carved out a classic double-top pattern. This exact zone acted as a fierce resistance block later in July, establishing it as a heavy supply area to watch in the short-to-medium term.
Currently, price is trapped in a tight lateral consolidation zone. In late July and early August, we witnessed a textbook "Bear Trap"—the price temporarily broke below the zone's support, but selling volume completely failed to follow through. Furthermore, since entering this indecision phase, both the MACD and RSI have been flashing clear bearish divergences, printing lower highs on the oscillators while the price attempted higher upward impulses.
🤖 Quantitative & Options Analysis:
Our algorithmic indicators deliver a clear message: ARKK is locked in a tight, low-volatility consolidation phase.
Gamma Exposure (GEX) Heatmaps: The GEX engine identifies a distinct "Pinning Regime" with heavy positive gamma resting at the $77.67 Call Wall. This means market makers are actively hedging in a way that suppresses large price swings, pinning the asset near current levels.
Dynamic Monte Carlo Projections: The forecasting model perfectly corroborates the options data, predicting a near-flat 20-day median target of $77.84 with a slight negative drift and a conservative 47.1% upside probability.
🎯 Conclusion & Strategy:
Both classical technicals and algorithmic models mathematically confirm that you should avoid breakout strategies right now. The optimal approach in this environment is to favor mean-reversion trading or collect options premium while the price chops sideways.
⚠️ Disclaimer: This analysis is strictly for educational purposes and is intended solely to intellectually enrich our trading community. It is NOT financial or investment advice. Always execute your own research and manage your risk accordingly. Gold is breaking outFor 3 weeks now gold has been showing improvement against the Nasdaq, but only registering as improving one week against the S&P, which is the more appropriate benchmark. This means this trade idea is still relatively early. The strength is a result of buying by Chinese investors, according to AlphaSpace data.
According to the chart here, there's also a clear breakout from the multimonth downtrend. And price is turning right at the weekly cloud, which is where it should turn. There's a stochastic crossover on the weekly chart from oversold conditions. The MACD is also beginning to turn up, which indicates an improvement towards bullish momentum.
I used to trade gold futures years ago, just as a day trader, so I am not clear on how this kind of trade in the ETF would perform. But it's clear that the charts support a turn.
Finally, it's worth taking note of Fed actions and how that relates to gold. Specifically, oil prices up and a hawkish Fed rate path would support the case for gold. However, NFPs this morning were clearly bad. This could support the case for a Fed rate cut.
At time of writing, this gold ETF is at 83ish. Options for entry include waiting for a cooling off period and entering at 21ema. More aggressive entry would be straight in.  Long
Long
 Long
Long
Research 07.08.2026🌏 Markets:
AMEX:SPY +1.58 +0.21%(pre/m)
NASDAQ:QQQ +3.16 0.44%(pre/m)
🆕 Economic News:
08:30 USA – Non Farm Payrolls
08:30 USA – Unemployment Rate
08:30 USA – Average Hourly Earnings
📈 Gap Ups
Reaction to earnings/guidance:
NYSE:DOCS NASDAQ:TEAM NYSE:FIGS NASDAQ:FROG NYSE:TWLO NYSE:NET NASDAQ:ACMR NASDAQ:CART NASDAQ:NTRA NASDAQ:AKAM NASDAQ:INOD NYSE:DV NASDAQ:AAOI NASDAQ:ABNB NYSE:ONTO NASDAQ:MCHP NYSE:MP NASDAQ:GMAB NYSE:OKLO NYSE:UA NASDAQ:TTWO NASDAQ:MNST NYSE:PBR NYSE:AFL NYSE:WPM NYSE:VATE
Other news:
Gold prices are breaking higher after a tough stretch: NYSE:AU AMEX:GLD AMEX:GDX NYSE:HMY NYSE:GFI NASDAQ:HYMC
Gold prices are breaking higher after a tough stretch: NASDAQ:GRML AMEX:PLG NYSE:SBSW NASDAQ:USAR
NYSE:COHR NYSE:GLW NASDAQ:LITE NASDAQ:AXTI rose in symphaty to NASDAQ:AAOI earnings.
NASDAQ:FSLR Shares Jump After Trump Introduces New Tariffs on Solar Imports
NASDAQ:RKLB Successfully Completes 92nd Electron Mission, 8th Launch for iQPS Earth-Imaging Constellation
NASDAQ:MB NASDAQ:NAMI : low-float short squeeze pump (no news)
📉 Gap Downs
Reaction to earnings/guidance:
NASDAQ:TTD NASDAQ:SEZL NYSE:AMRZ NYSE:VST NASDAQ:CLMT NASDAQ:PGNY NASDAQ:LASR NYSE:RMD NASDAQ:DKNG NYSE:RKT NASDAQ:ROKU
Other news:
NYSE:INVX offering of 5,000,000 Shares
NASDAQ:ESLT Announces the Results of its Annual General Meeting of Shareholders
NASDAQ:SKHY Reveals $38B Expansion Plan Amid AI Hyperscaler Capex Frenzy
‼️ Additional
Alphabet NASDAQ:GOOGL holds 551.2 million Class A shares of SpaceX NASDAQ:SPCX on its balance sheet — SEC filing.
The Senate is heading into recess, and the vote on the CLARITY Act has been postponed until September. CRYPTOCAP:BTC
The US Federal Aviation Administration ordered inspections of hundreds of NYSE:BA Boeing 737 Max aircraft due to the risk of fuselage cracks.
NASDAQ:AMD is acquiring Canadian startup Taalas to produce new types of AI chips for the rapidly growing data center industry.
🏢 IPO
NASDAQ:BLSM – BlossomHill Therapeutics
Company develops small-molecule cancer drugs. Lead candidate BH-30643 is being tested for EGFR-mutant non-small cell lung cancer, a major lung cancer subtype where treatment can vary depending on the mutation. The company also has programs for AML / higher-risk MDS and a preclinical KRAS cancer program.
Price: $16.00
Shares: 9.4M
Raised: $150.0M
Market Cap: ~$490.3M
LTM:
Revenue: $0
Net Income: -$71.1M
Key point:
IPO was upsized from 7.81M to 9.38M shares, while the lead program remains early clinical with Phase 2 planning still ahead.
Comparable public companies: NYSE:BMY , NYSE:MRK , FTMO_OANDA:AZN , NYSE:DAVA , SEED_ALEXDRAYM_BIGMAC:NUVL , NASDAQ:KURA
NASDAQ:LTGO – Latigo Biotherapeutics
Company develops non-opioid oral therapies for acute and chronic pain. Lead candidate LTG-001 is an oral Nav1.8 inhibitor for moderate to severe acute pain, including post-operative pain, with Phase 3 trials expected to start in H2 2026. Pipeline also includes LTG-321 for chronic musculoskeletal pain, starting with knee osteoarthritis, and earlier-stage Nav1.8 programs for other pain indications.
Price: $18.00
Shares: 19.2M
Raised: $345.6M
Market Cap: ~$1.15B
LTM:
Revenue: $0
Net Income: -$111.2M
Key point:
IPO was upsized from 16.0M to 19.2M shares and priced at the top of the range, while the company still has no approved products.
Comparable public companies: NASDAQ:VRTX , NASDAQ:SRPT , NASDAQ:BMRN , NASDAQ:HALO , NASDAQ:EWTX , NASDAQ:PRAX
NASDAQ:MDAT – Web3Labs Global Inc.
Company provides Web3 business services for blockchain companies and decentralized tech startups in Asia. Services include strategic consulting, acceleration program management, marketing, market research and operational support. The company also works with public blockchain ecosystems and aims to help Web3 startups commercialize decentralized products and establish a presence in Hong Kong.
Price: $4.00–$5.00
Shares: 6.3M
Raised: ~$28.1M
Market Cap: ~$140.0M
LTM:
Revenue: $2.0M
Net Income: $0.88M
Key point:
Business is profitable but very small, with only 17 employees and high exposure to Web3 / crypto market cycles.
Comparable public companies: NASDAQ:BTCS , NASDAQ:FRGT , AQUISEU:GREE , NASDAQ:MARA , NASDAQ:RIOT , NASDAQ:CLSK
📋 List of tickers involved:
$DOCX NASDAQ:TEAM NYSE:FIGS NASDAQ:FROG NYSE:TWLO NYSE:NET NASDAQ:ACMR NASDAQ:CART NASDAQ:NTRA NASDAQ:AKAM NASDAQ:INOD NYSE:DV NASDAQ:AAOI NASDAQ:ABNB NYSE:ONTO NASDAQ:MCHP NYSE:MP NASDAQ:GMAB NYSE:OKLO NYSE:UA NASDAQ:TTWO NASDAQ:MNST NYSE:PBR NYSE:AFL NYSE:WPM NYSE:VATE NYSE:AU AMEX:GLD AMEX:GDX NYSE:HMY NYSE:GFI NASDAQ:HYMC NASDAQ:GRML AMEX:PLG NYSE:SBSW NASDAQ:USAR NYSE:COHR NYSE:GLW NASDAQ:LITE NASDAQ:AXTI NASDAQ:FSLR NASDAQ:RKLB NASDAQ:MB NASDAQ:NAMI NASDAQ:TTD NASDAQ:SEZL NYSE:AMRZ NYSE:VST NASDAQ:CLMT NASDAQ:PGNY NASDAQ:LASR NYSE:RMD NASDAQ:DKNG NYSE:RKT NASDAQ:ROKU NYSE:INVX NASDAQ:ESLT NASDAQ:SKHY NASDAQ:GOOGL NASDAQ:SPCX CRYPTOCAP:BTC NYSE:BA NASDAQ:AMD NASDAQ:BLSM NYSE:BMY NYSE:MRK FTMO_OANDA:AZN NYSE:DAVA SEED_ALEXDRAYM_BIGMAC:NUVL NASDAQ:KURA NASDAQ:LTGO NASDAQ:VRTX NASDAQ:SRPT NASDAQ:BMRN NASDAQ:HALO NASDAQ:EWTX NASDAQ:PRAX NASDAQ:MDAT NASDAQ:BTCS NASDAQ:FRGT AQUISEU:GREE NASDAQ:MARA NASDAQ:RIOT NASDAQ:CLSK
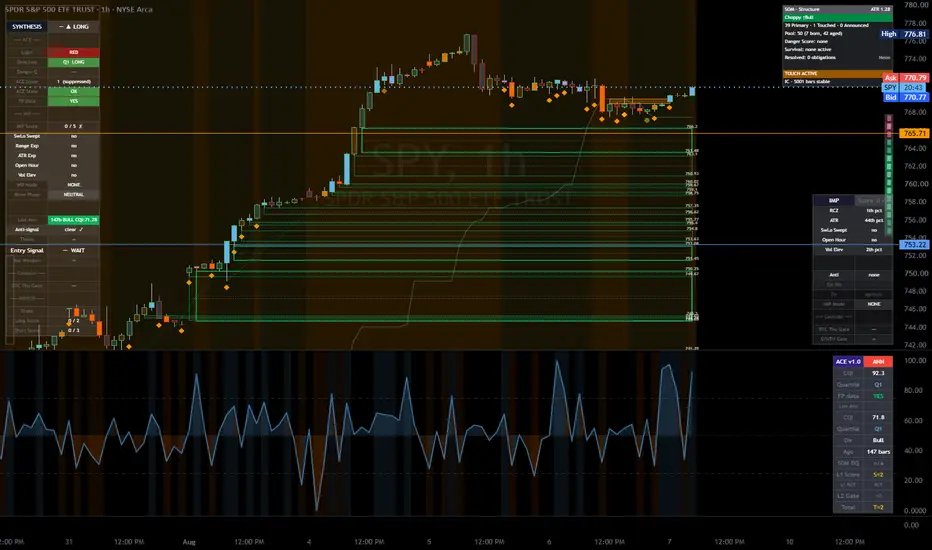
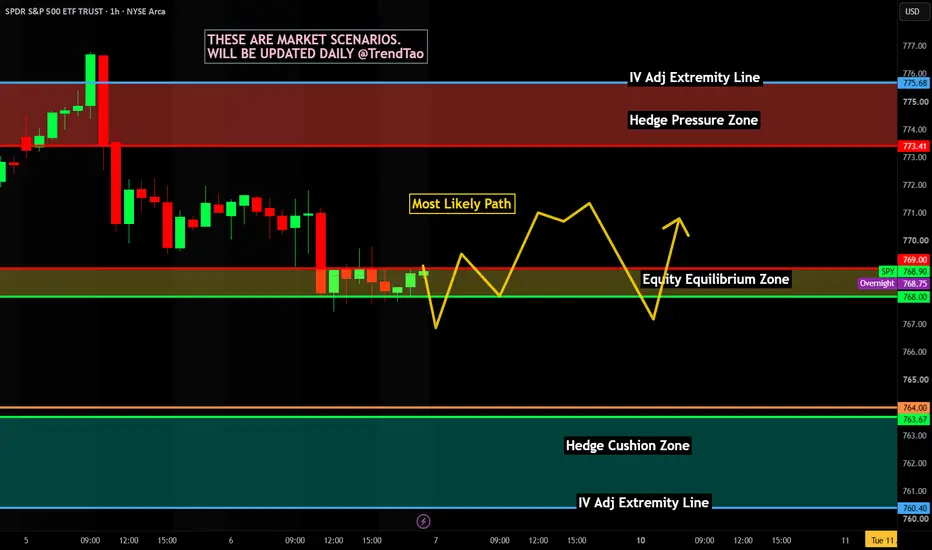
Best regards – hi2morrow team. SPY Forecast for Friday: Compression Meets Premarket StrengthThursday's session respected the decision map (). SPY failed to establish acceptance above yesterday's Upper Rail and rotated back toward equilibrium, eventually closing near the model's value area. Rather than confirming a breakdown, the session ended with the market back in balance.
Friday begins with a different picture.
SPY is trading around 770 in premarket, already above today's Upper Predictive Rail (766.38). That immediately shifts the focus to the opening hour. Buyers have already cleared the first hurdle in premarket—the real question is whether they can hold those gains after the cash market opens.
Today's AI forecast has also changed noticeably. Compared with yesterday, the entire structure has shifted lower and become more compressed.
Equilibrium: 764.23–765.67
Predictive Range: 762.08–766.38
Upside Expansion: 769.26 → 769.97
Extended Resistance: 773.56
A compressed forecast usually tells me the market is approaching a decision point. Thursday's weakness has already been priced in. Friday is less about predicting direction and more about watching which side can force the next expansion.
Although Thursday was a weaker session, the broader AI dashboard remains constructive. Across the NASDAQ-100, my model currently shows 51 instruments aligned bullish versus 21 aligned bearish, with Technology and Financials continuing to provide the strongest leadership. Consumer Discretionary and Communication Services also remain supportive, while weakness is concentrated in Energy, Materials and Utilities. That tells me the underlying participation hasn't deteriorated as much as Thursday's SPY pullback might suggest.
If SPY can hold above the Upper Predictive Rail after the open, the next levels to watch are 769.26 and 769.97, with 773.56 remaining the model's extended upside objective.
If the premarket strength fades and SPY slips back below 766.38, I'd expect price to rotate back toward the 764.23–765.67 equilibrium zone, where buyers and sellers are likely to battle for control again.
Market Internals
Market Stance: Selective
Sentiment: Neutral
Breadth: 51 Aligned Bullish | 21 Aligned Bearish
Leadership: Technology, Financials, Consumer Discretionary, Communication Services
Weakness: Energy, Materials, Utilities
NeuralMarkets Decision Map
Resistance: 769.26 | 769.97 | 773.56
Decision Zone: 766.38 | 764.23–765.67
Support: 762.08 | 761.37 | 760.66 Long 
 Long
Long
Paper Trading Should Test the Process, Not the P&LMost paper-trading reviews begin with the ending balance. That is the least transferable part of the exercise.
A useful paper test should evaluate a repeatable decision process:
1. **Universe definition** — Which instruments were eligible before the session began?
2. **Entry evidence** — Which observable conditions had to agree?
3. **Risk budget** — What was the maximum planned loss before entry?
4. **No-trade conditions** — Which missing or conflicting signals blocked a position?
5. **Monitoring rule** — What evidence would support holding, reducing, or exiting?
6. **Stop condition** — What market, time, or data-quality event ended the setup?
7. **Auditability** — Can the decision be reconstructed after the close without rewriting the thesis?
Paper results cannot reproduce every live fill, spread, queue position, fee, latency, liquidity constraint, or market-impact effect. A strong hypothetical P&L can therefore coexist with a weak process.
The more useful question is: **Did the method remain coherent when the preferred trade was unavailable, the signal weakened, or the market moved before entry?**
For the next SPY session, define the invalidation and no-trade conditions before the open. At the close, score adherence separately from return. A losing but well-executed test may teach more than a profitable trade that violated its own rules.
Educational only. Paper performance is hypothetical and trading involves risk. Education 
 Short
Short
Short 
Long 
QCMU | 4H Timeframe Bullish Reversal🚀 QCMU Breaks the Downtrend — Bullish Reversal or Another Trap?
QCMU has spent the past two months getting absolutely smoked, sliding from the $52.18 peak into the $13.10 low while printing a clean sequence of lower highs and lower lows.
The tape is finally showing signs of a character change.
Price swept into the $13.78–$14.79 demand zone, rejected the lows and then punched through the descending trendline that had capped every rally since June. The breakout is constructive, but bulls still need follow-through above the nearby $18–$20 structure before declaring a full trend reversal.
Qualcomm’s latest fiscal third-quarter report delivered approximately $9.9 billion in revenue and $2.21 adjusted EPS, but weaker forward guidance and concerns about handset demand pressured sentiment. The company has also been working to diversify beyond smartphones into automotive, personal computers, edge AI and data-center applications.
Qualcomm’s next earnings report is currently expected around November 2026, although the exact date should be confirmed closer to the event.
Trend Analysis
Short-term trend: Bullish reversal attempt
Price has:
Defended the major demand zone
Swept the previous low
Broken above the descending trendline
Started forming a potential higher low
Reclaimed approximately $17
This is the first credible bullish shift since the June peak.
Breakout Analysis
The descending trendline had at least four clean touch points, giving the breakout additional technical significance.
The ideal bullish sequence is:
Break above the trendline
Hold above $16.50–$17.00
Retest the breakout area (HL)
Print a bullish rejection candle
Push through $20–$21
A close back below approximately $16 would weaken the setup. A break below the demand zone would suggest the breakout was a bull trap.
Supply and Demand Zones
🟢 Major Demand
$13.78–$14.79
This is the primary reversal zone and the origin of the current breakout.
Holding this region would support continuation and confirm that former trendline resistance has flipped into support.
🔴 Near-Term Supply
$19.80–$21.00
Former support and the location of the final lower high before the August breakdown.
🔴 Intermediate Supply
$24–$27
A congested breakdown region where trapped holders may sell into strength.
🔴 Major Supply
$47.49–$52.15
🎯 Trading Plan
Entry: $17.20
Stop Loss: $14.03
Target Estimated Risk/Reward
$20.50 Approximately 1.0:1
$26.00 Approximately 2.8:1
$32.00 Approximately 4.7:1
$47.49 Approximately 9.6:1
The highest target offers attractive theoretical reward, but price must first clear multiple layers of overhead supply.
Risk and Trade Management
Risk a maximum of 1%–3% of total trading capital. For a leveraged single-stock ETF such as QCMU, staying near the lower end of that range is more prudent.
Consider scaling in:
First position near $17.50
Second position on a successful $16.50–$17 retest
Final position only after bullish confirmation
Consider scaling out:
Take partial profit around $20–$21
Reduce further around $25–$27
Leave a smaller runner for $32 or the major $47.49 supply zone
Consider moving the stop loss to breakeven when 1:1 risk/reward is reached, provided the market has established a higher low. Avoid moving the stop prematurely inside normal 4-hour volatility.
“The trend is your friend until the end, when it bends.” — Ed Seykota
Disclaimer: This analysis is for educational and informational purposes only and is not financial advice. Leveraged single-stock ETFs involve substantial volatility, daily-reset compounding and the possibility of rapid losses. Always perform independent research and use appropriate position sizing.
Tags: #QCMU #QCOM #Qualcomm #Semiconductors #LeveragedETF #TradingView #TechnicalAnalysis #SupplyAndDemand #TrendlineBreakout #ElliottWave #RSIDivergence #SwingTrading #RiskManagement  Long
Long
Short 
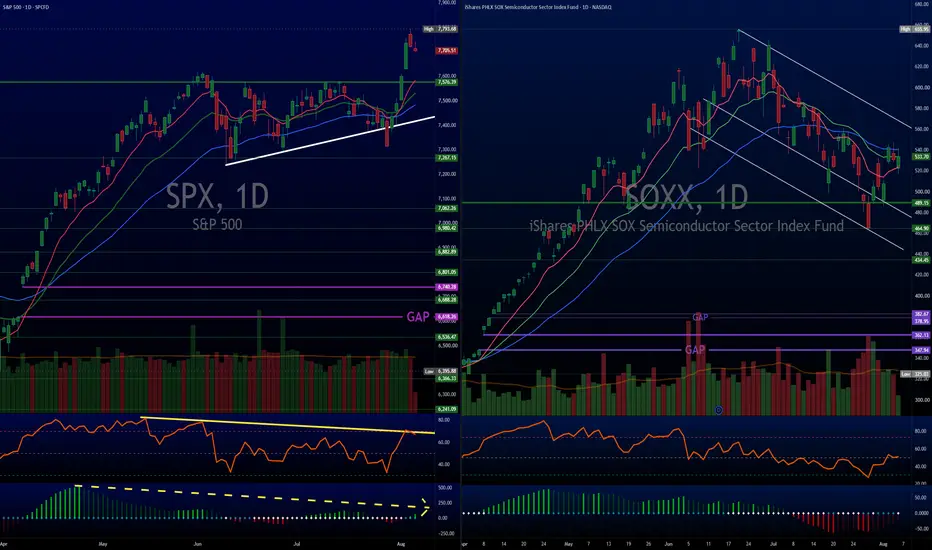
$SOXX vs $SPX What is Next?SOXX: Ideal Entry
Setup: While price is still printing lower highs and lower lows inside that white trend channel, the momentum indicators (RSI curling up, TTM bars shrinking red toward zero) are clearly resetting.
Strategy: Waiting for that one last retest (higher low within the channel or a test of the lower support I the channel) before pulling the trigger is the smart play.
Confirmation: If price retests that lower support zone and holds while RSI makes a higher low, it confirms that the aggressive selling pressure is exhausted. A breakout of that top white trendline will be the green light.
SPX: Strong Price Action vs. Fading Momentum
Setup: SPX is showing a classic bearish divergence (higher highs in price, lower highs in RSI and TTM). This indicates momentum is slowing down, but price is king.
Trigger: As long as SPCFD:SPX holds above its breakout support level (green horizontal line), the trend remains intact.
Takeaway: Divergence alone isn't a sell signal, it's a caution flag. SPX can easily "cool off" momentum by grinding sideways instead of dumping, letting RSI reset without giving back price gains.
Bad News vs. Bull Market Paradox
The enemy of stock investing is euphoria. The more we're focused on all the bad news, the higher the odds the market can keep climbing.
Denise Chisholm, Director of Quantitative Market Strategy at Fidelity Investments
Wall of Worry: Markets rarely top out when everyone is complaining about economic news, interest rates, or inflation. They top out when the average retail investor feels invincible and leverages at the peak.
We’ve already seen flashes of this leverage risk (look at South Korea’s retail ETF boom, or recent comments from Fink and Dimon on market leverage and CRYPTOCAP:BTC flushing out over-leveraged traders to form a base).
We’ll be dropping a full article breaking down this exact retail vs. institutional leverage cycle shortly!
Smart Money Positioning: Institutional capital accumulates during periods of maximum headlines and bad news because earnings growth and balance sheets remain structurally sound. By the time retail finally capitulates and buys back in near the top, the smart money is already looking for the exit.
TGtg