POSITION no7: $URA (1M) - FULL EXITFull exit from the position for me
Position #7: AMEX:URA - 1M & 3-D
On the monthly timeframe it still looks good overall, a long-term rounded bottom forming a possible Cup & Handle, except now it looks more like the Handle phase after losing the ascending triangle.
Wave 4 of Elliott Wave theory, meaning the Golden Pocket, would be between $34.5 - $36. That area becomes very interesting because it is also the most important horizontal support and the top of Wave 1. Nicely curved yellow 50-MA around $31+ provides additional support from below.
On the 3-day chart there is an obvious Wyckoff structure in action. For me this is the last moment to step away from the position. There has already been a market structure shift into a downtrend on both the 3D and 1D timeframes. So far we have a bounce from the lower low at $42.5, but it is probably short-lived, making this potentially the best opportunity for me to exit and wait for lower levels.
This is not investment advice, just a blog.
💙👽
ETF market
POSITION no7: $URA (3D) - FULL EXITFull exit from the position for me
Position #7: AMEX:URA - 1M & 3-D
On the monthly timeframe it still looks good overall, a long-term rounded bottom forming a possible Cup & Handle, except now it looks more like the Handle phase after losing the ascending triangle.
Wave 4 of Elliott Wave theory, meaning the Golden Pocket, would be between $34.5 - $36. That area becomes very interesting because it is also the most important horizontal support and the top of Wave 1. Nicely curved yellow 50-MA around $31+ provides additional support from below.
On the 3-day chart there is an obvious Wyckoff structure in action. For me this is the last moment to step away from the position. There has already been a market structure shift into a downtrend on both the 3D and 1D timeframes. So far we have a bounce from the lower low at $42.5, but it is probably short-lived, making this potentially the best opportunity for me to exit and wait for lower levels.
This is not investment advice, just a blog.
💙👽
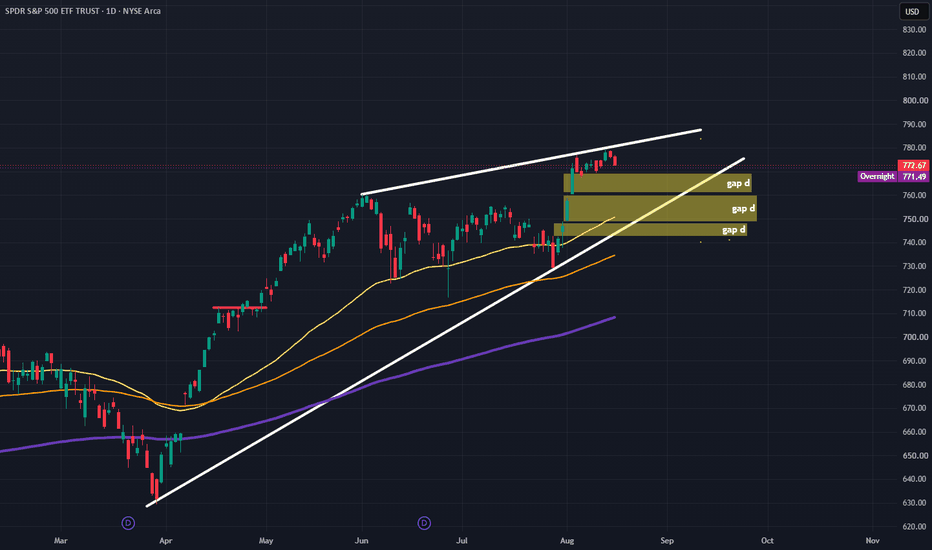
Double Top/Head & Shoulders Forming (Expect -16% Statistically)A head and shoulders (H&S) occurs when the price peaks on three separate occasions, with two peaks forming the “shoulders” and the central peak forming the head.
The head-and-shoulders pattern is considered one of the most reliable bearish reversal signals in technical analysis. According to the Encyclopedia of Chart Patterns and confirmed by my own research, this formation indicates an 81% chance of a downside move and an average price decline of about 16%.
Additionally, there are notable negative divergences in both the CCI and CMF.
As mentioned in earlier posts, I remain short on the market and anticipate a significant correction.
S&P 500 Head & Shoulder Top Forming -16% ExpectedA head and shoulders (H&S) occurs when the price peaks on three separate occasions, with two peaks forming the “shoulders” and the central peak forming the head.
The head-and-shoulders pattern is the most accurate technical analysis bearish reversal pattern.
An H&S pattern signals a 81% downside probability and an average price drop of -16% according to the Encyclopedia of Chart Patterns, and verified my my own research.
Also, note the negative divergences in CCI, and CMF.
As discussed in previous posts, I am short the market and expecting a large correction.
Research 23.06.2026🌏 Markets:
AMEX:SPY −8.31 −1.12%(pre/m)
NASDAQ:QQQ −17.85 −2.42%(pre/m)
🆕 Economic News:
South Korea’s KOSPI index fell 10% amid a selloff in the world’s leading memory chipmakers, Samsung and SK Hynix, forcing trading to be halted for 20 minutes. The US chip sector is falling in sympathy with Korea.
08:30 USA – ADP Employment Change Weekly
16:30 USA – API Crude Oil Stock Change
📈 Gap Ups
Reaction to earnings/guidance:
Other news:
Trump signs orders calling for powerful quantum computer, targeting 2028 NYSE:INFQ NYSE:IBM
NYSE:IBM and OpenAI partner to bring frontier AI to enterprise cyber defense / NYSE:ACN rises in sympathy to IBM
South African court grants NYSE:NVO petition to block Ozempic copies
NYSE:CVX Signs 20-Year Power Deal With NASDAQ:MSFT for Massive Texas AI Hub
📉 Gap Downs
Reaction to earnings/guidance:
NYSE:SUNB NYSE:CCL
Other news:
Global chip stocks tumbled on Tuesday as a broad selloff in technology shares swept from Asia through Europe and threatened to drag Wall Street lower at the open, fuelled by mounting concerns over stretched AI valuations and the prospect of higher U.S. borrowing costs.
-- In South Korea, memory chip giants Samsung Electronics and SK Hynix, which together account for roughly half of the benchmark Kospi index's market capitalisation, both fell more than 12%. The losses were severe enough to trigger a 20-minute trading halt on the Kospi, the fourth such suspension this year, leaving the index down 10% on the day.
-- The biggest losers from this news were: NYSE:WOLF NASDAQ:TSEM NYSE:STM NASDAQ:MXL NASDAQ:SNDK NASDAQ:MRVL NASDAQ:MU NASDAQ:AXTI NASDAQ:NBIS NASDAQ:ASML NASDAQ:WDC NASDAQ:AMAT NASDAQ:INTC NASDAQ:ARM NASDAQ:STX NASDAQ:ALAB NYSE:COHR NASDAQ:LRCX NASDAQ:AMD NASDAQ:LITE NASDAQ:KLAC NASDAQ:QCOM NYSE:GLW NYSE:VRT NYSE:DELL NYSE:TSM NASDAQ:AVGO
NYSE:PRIM Slashes Outlook; Operating Chief to Depart / KeyBanc downgraded the PRIM stock to "Sector Weight" from "Overweight" and currently has no price target.
‼️ Additional
BofA expects 3 Fed rate hikes this year: in September, October, and December.
Deutsche expects 2 hikes: in September and December.
📋 List of tickers involved:
NYSE:INFQ NYSE:IBM NYSE:ACN NYSE:NVO NYSE:CVX NASDAQ:MSFT NYSE:SUNB NYSE:CCL NYSE:WOLF NASDAQ:TSEM NYSE:STM NASDAQ:MXL NASDAQ:SNDK NASDAQ:MRVL NASDAQ:MU NASDAQ:AXTI NASDAQ:NBIS NASDAQ:ASML NASDAQ:WDC NASDAQ:AMAT NASDAQ:INTC NASDAQ:ARM NASDAQ:STX NASDAQ:ALAB NYSE:COHR NASDAQ:LRCX NASDAQ:AMD NASDAQ:LITE NASDAQ:KLAC NASDAQ:QCOM NYSE:GLW NYSE:VRT NYSE:DELL NYSE:TSM NASDAQ:AVGO NYSE:PRIM
Best regards – hi2morrow team.
SPY's Five-Session Standoff Is Over. The Hourly Won...SPY's Five-Session Standoff Is Over. The Hourly Won and the Daily
Just Stopped Arguing.
The cross-timeframe disagreement that defined SPY for the last
week has finally resolved. The Hourly's bear announcement at CQI
68.03 is now 40 bars old, still carrying virtually the same
conviction it had when it fired on June 18. The Daily's 215-bar
bull print at CQI 69.86 is still technically alive, but the
Daily itself has flipped to MEDIUM SHORT thesis with PANIC active,
a PARTIAL signal loaded, NR7 anti-signal firing, and the Short
Score at 1/3. The bull announcement is still there. The Daily has
stopped listening to it. That's the resolution.
Resistance: 736.50-736.87 - nearest overhead
Key resistance: 740.44-742.71 - last week's floor
Current price: 734.77
Support: 732.45 - nearest level below
Key support: 727.0-728.0 - next structural shelf
Thesis line: 721.23 - the broader floor
Two paths from here:
The bearish resolution accelerates: Vol Elev climbs from 34th
on the Hourly on a move lower, the Daily's PARTIAL signal
upgrades, price breaks 732.45. Opens 727-728 and eventually
721.23, the level that's anchored the bottom of every cheat
sheet this cycle.
The resolution was premature: price reclaims 736.50 with volume,
the Daily's bull print reasserts relevance, the PANIC state
clears. Price pushes back into the 740-742 zone. But this would
require the Daily to reverse a MEDIUM SHORT thesis call, a
PARTIAL signal, and an active PANIC state, which is a lot to
unwind.
The Hourly's EXT MODE is active for the first time on SPY this
cycle. That's the same flag that's been running on BTC for over
a week now. Whether SPY follows the same pattern - extended
downside that grinds rather than snaps - carries into the rest
of the week.
---
Built with SYNTHESIS v3.3 | SOM / ACE / IMP / SYNTHESIS
Study, not financial advice.
The 4th of July Euphoria Blow-Off Top Before the 'Minsky Moment'As seen in the chart, the SPDR S&P 500 ETF Trust (SPY) is hovering around the $744 level, closely contesting the 1.618 Fibonacci extension ($740.91) within a major multi-year ascending channel. This analysis charts out a classic speculative bubble anatomy—tracking a final parabolic blow-off top over the summer, followed by a systemic "Minsky Moment" in September 2026.
The Technical Framework
Current Position: Consolidating just above the 1.618 Fibonacci extension ($740.91) along an accelerating parabolic trajectory.
The Ultimate Target: A final vertical thrust aiming for the 2.618 Fibonacci extension at $810.60.
The Macro Support: If the parabolic arc breaks, the ultimate macro target sits near the multi-year green support trendline, signaling a potential drop back down toward the low $500s.
The 7-8 Month Catalyst Roadmap
Phase 1: Summer Mania & The $810 Peak (July 2026)
The immediate outlook points to a sharp vertical melt-up driven by sheer momentum and psychological triggers:
4th July Euphoria: America’s 250th anniversary acts as a massive cultural tailwind for a patriotic market rally.
AI Paradigm Shift: Speculation reaches a fever pitch with headlines of the US Government actively buying stakes in AI companies.
The Sentiment Trap: Mainstream narratives shift to a "permanently high plateau," masking what is fundamentally a state of "irrational exuberance."
Phase 2: The Fed Shock & The Bull Trap (Late Summer / Autumn 2026)
Once the market hits the structural ceiling at the $810 Fibonacci level, the macro environment aggressively shifts:
Rate Hikes: Persistent high inflation forces the newly appointed Federal Reserve Chair, Kevin Warsh, to aggressively raise interest rates.
The Dead Cat Bounce: The initial drop triggers a fierce psychological reflex. Retail and institutional dip-buyers rush in under the classic delusion: "This time is different, buy the f*ing d!p."
Phase 3: The Minsky Moment & Geopolitical Liquidation (Winter 2026 – Early 2027)
The structural fragility of the market is exposed as multiple global black swan events cascade at once, leading to a systemic unwinding:
Geopolitical Flares: Israel violates its ceasefire, and the Strait of Hormuz is closed once again, triggering a massive global energy supply shock.
De-Dollarization & Fractured Diplomacy: President Xi cancels his highly anticipated US visit, coinciding with the launch of a new BRICS payment system explicitly engineered to bypass the USD and SWIFT.
Sovereign Debt Crisis: A boiling domestic and international currency crisis triggers a true liquidity crunch.
Phase 4: The Christmas Illusion to Final Capitulation
The Fake-Out: A brief relief rally tempts trapped bulls to declare that a "healthy correction is over," calling for a "New ATH by Christmas."
The Final Blow: This end-of-year trap fails brutally. Entering early 2027, headlines of an Iranian nuclear test shatter remaining global market stability, sending the SPY into a vertical capitulation through its long-term green baseline support.
Key Levels to Track
Immediate Resistance / Target: $810.60 (2.618 Fib Extension)
Key Pivot Point: $740.91 (1.618 Fib Extension)
Macro Capitulation Target: ~$520 - $540 (Green support trendline retest)
Traders Note: Parabolic moves offer the most explosive gains, but they build the weakest structural foundations. Enjoy the summer blow-off, but keep your trailing stops tight and an eye firmly on the exit as we head into late Q3.
Disclaimer: This is a speculative macro roadmap blending technical market structures with hypothetical socio-political catalysts for educational purposes. Always manage your own risk.
QQQ / NDX Weekly Outlook – Week 25 of 2026 (22-26 JUN)QQQ/NDX WEEKLY MARKET OUTLOOK
Last Week's Recap
Price found a small bounce from KEY Level 1, but because it happened on Wednesday morning ahead of the FOMC meeting, we decided not to take the trade.
As discussed throughout the week, the FOMC meeting was the key event. With significant uncertainty surrounding the outcome, our expectation was that markets would likely find direction and potentially begin a meaningful move after the announcement.
Following the FOMC conference, QQQ found a nearly perfect bounce just below the KEY Level 1 zone and delivered exactly the reaction we were looking for.
Following the plan, we took profits around 735 and 742, closing the trade with a solid gain.
1 trade 1 win.
(For reference, I have included last week's outlook on the right.)
UA CAPITAL LAST WEEK RECAP (WEEK OF JUNE 15–19)
Markets closed the previous week with strong bullish momentum. On June 14, both I and the Premium Group had already established swing long positions in semiconductor names as well as SPY and QQQ.
When markets opened on Monday, that upside momentum continued. Our swing positions and stock positions performed extremely well, especially names such as ARM, MU, SNDK, and MRVL, which generated significant gains.
The key levels outlined in the Weekly Market Outlook were not reached on Monday or Tuesday. Price only approached those zones late Tuesday afternoon. However, with Wednesday's FOMC meeting and Kevin Warsh's first conference approaching, we informed the Premium Desk that opening new positions before the event would involve unnecessary risk. Instead, we focused on preparation and risk management ahead of the announcement.
Following the FOMC conference on Wednesday, SPY delivered a precise reaction from 737.5 while QQQ bounced directly inside the KEY Level 1 zone and immediately resumed higher. Seeing these weekly scenarios play out so precisely after such a major macro event is always encouraging.
The Long Scenario 2 setups published in Tuesday's Updated Forecast were fully achieved, as those scenarios were simply updated versions of the original Weekly Market Outlook.
On Thursday, the UA CAPITAL Trading Desk shared additional daily scenarios and intraday strategies with Premium members. While the SPY setup struggled due to relative weakness, QQQ performed almost exactly as expected, allowing us to capture additional profitable scalp opportunities.
Throughout the week we also continued highlighting bullish continuation opportunities in memory-related names such as MU and SNDK. By Friday premarket, MU was up more than 11% and SNDK more than 11.5%, creating several excellent trading opportunities for the group.
This Week's Scenarios / Prediction
Risk Index
The Risk Index remains firmly in a risk-on environment. As long as markets do not face a meaningful negative catalyst or macro surprise, institutional positioning continues to favor the bullish side.
This oscillator reads macro conditions and converts them into a technical risk framework. It was developed internally at UA CAPITAL and remains the primary indicator I use for both short term and long term positioning decisions.
The Risk Index currently signals the potential for bullish continuation. If geopolitical headlines remain stable and no new negative catalysts emerge, the model suggests that new all time highs remain achievable.
For that reason, we will continue focusing exclusively on swing long opportunities from predefined key levels.
Long Scenarios
Long Scenario 1
KEY Level 1 (736)
This is the first major demand zone. If price reaches this level and confirms support, call options can be used to establish long exposure.
Targets: 740 → 744 → 748
Runner can be held.
Invalidation: Daily candle close below 732.
Long Scenario 2
KEY Level 2 (725)
This is the second major demand zone. If price reaches this level and confirms support, call options can be used to establish long exposure.
Targets: 729.5 → 732 → 736
Invalidation: Daily candle close below 720.
Long Scenario 3
KEY Level 3 (714)
This is the third major demand zone. If price reaches this level and confirms support, call options can be used to establish long exposure.
Targets: 720 → 729.5 → 732 → 736
Invalidation: Daily candle close below 706.5.
IMPORTANT TIP
QQQ continues to show stronger relative strength than SPY. Because of this, long positions generally offer better reward potential through QQQ, while SPY remains the more attractive vehicle for short exposure.
In previous posts, I explained how to use the CC Model (Correlated Confluence Model) for trade execution and partial profit taking. Reviewing those posts may be particularly useful this week.
Position Management Rules
1. Entry model: One hourly bullish candle close above the level.
2. Take profits in stages because market reversals can happen quickly.
3. After the first profit target is reached, move all remaining stop losses to breakeven and convert the position into a risk-free trade.
4. A reaction from the level must be confirmed. We do not predict price. We react to price.
5. Daily candle close below the bounce zone = stop loss.
Notice: My previous SPY, QQQ and individual stock content since 2025 is no longer visible following a TradingView content review. This included my regular weekly outlooks and mid week market updates. I have been consistently publishing structured index and equity market analysis, and I will now rebuild this track record with weekly/daily posts going forward.
This analysis is for educational purposes only and reflects my personal opinion. It is not financial advice.
My price targets for 06/22/2026
For research purposes only. This is not investment advice. Past performance is not indicative of future results. Do your own Due Diligence.
----Main Target----
NASDAQ:INTW
Trading date: 06/22/2026
Target price: $382.87
Target gain: +1.00%
Previous close: $379.08
----Other Potential Targets----
NASDAQ:FCXG
Trading date: 06/22/2026
Target price: $15.79
Target gain: +1.00%
Previous close: $15.63
NASDAQ:AIP
Trading date: 06/22/2026
Target price: $44.55
Target gain: +1.00%
Previous close: $44.11
AMEX:PSI
Trading date: 06/22/2026
Target price: $180.01
Target gain: +1.00%
Previous close: $178.23
AMEX:EMDM
Trading date: 06/22/2026
Target price: $45.39
Target gain: +1.00%
Previous close: $44.94
SPY / SPX Weekly Outlook – Week 25 of 2026 (22-26 JUN)SPY/SPX WEEKLY MARKET OUTLOOK
Last Week's Recap
Price found a minor bounce from Key Level 1, but since execution confirmation was never triggered, we did not enter a position.
We discussed throughout the week that the FOMC meeting would be the key event and that markets were likely waiting for the decision before making a meaningful move.
Long Scenario 2 delivered a nearly perfect bounce following the FOMC announcement and played out exactly as expected.
Following the plan, we closed positions around 744 and 749 for a solid profit.
1 trade taken.
1 trade closed green.
(Reference to last week's post is shared on the right side.)
UA CAPITAL Last Week Recap (Week of June 15–19)
Markets closed the previous week with strong bullish momentum on June 12. As a result, both I and the premium group had already established swing long positions in semiconductors as well as SPY and QQQ before the new week began.
When markets opened on Monday, bullish momentum continued immediately and our swing positions generated strong gains.
In particular, ARM, MU, SNDK, and MRVL produced excellent performance throughout the week.
The key levels published in the Weekly Market Outlook were not reached on Monday or most of Tuesday. Price finally approached the zones late Tuesday afternoon, but with Wednesday's FOMC meeting approaching and uncertainty surrounding Kevin Warsh's first meeting as Chair, I informed the premium desk that opening new positions before the event would carry unnecessary risk.
We focused instead on risk management and position sizing, ensuring the entire group was properly prepared for the announcement.
Following the FOMC conference on Wednesday, SPY delivered a near perfect test of 737.5 and immediately found support. QQQ reacted from inside Key Level 1 and began moving higher as well.
Seeing both weekly scenarios react with such precision immediately after a major macro event was another example of our framework remaining aligned with broader market positioning.
The Long Scenario 2 setups published in Tuesday's Updated Forecast were fully achieved, which was expected since those scenarios were simply refinements of the original Weekly Market Outlook.
On Thursday, the UA CAPITAL Trading Desk shared additional daily scenarios and execution plans through the premium chat.
While Thursday's SPY setup ultimately failed due to weaker price action, QQQ performed exactly as expected and provided another profitable intraday opportunity.
Throughout the week we also continued highlighting bullish continuation opportunities in memory related stocks such as MU and SNDK, while sharing execution plans and risk management strategies around those names.
MU finished premarket up more than 11%, while SNDK gained over 11.5%.
Several excellent trades were executed throughout the week.
This Week's Scenarios / Prediction
Risk Index
The Risk Index remains firmly in risk on territory. Unless markets receive a significant negative catalyst or unexpected macro deterioration, institutional positioning continues to favor the long side.
This oscillator reads macro conditions and converts them into a technical risk framework. It was developed internally at UA CAPITAL and remains the primary indicator I use for both short term and long term positioning decisions.
The Risk Index continues to signal bullish continuation. If geopolitical headlines remain stable and no new negative catalysts emerge, the model suggests that new all time highs remain achievable.
For that reason, we will continue focusing exclusively on swing long opportunities from predefined key levels.
Long Scenarios
We currently have two primary zones.
Long Scenario 1
KEY Level 1 (750.5)
This is a major swing zone.
If price can reclaim and hold above this area with a clean 1 hour bullish candle close, call options can be used to establish long exposure.
Targets: 753 → 755.5 → 760
Runner can be held.
Invalidation: Daily candle close below 747.
Long Scenario 2
KEY Level 2 (739.5)
This is the primary demand zone on the chart.
If price reaches this level and confirms support, call options can be used to establish long exposure.
Targets: 744 → 749.5 → 753 → 755.5 → 760
Invalidation: Daily candle close below 734.
Important Tip
QQQ remains structurally stronger than SPY. Because of that, QQQ is generally the preferred vehicle when looking for long opportunities, while SPY tends to provide cleaner opportunities on the short side.
In previous posts, I explained how to use the CC Model (Correlated Confluence Model) for entries, position management, and partial profit taking.
That framework may become particularly useful again this week.
Position Management Rules
1. Entry model: One hourly bullish candle close above the level.
2. Take profits in stages because market reversals can happen quickly.
3. After the first profit target is reached, move all remaining stop losses to breakeven and convert the position into a risk-free trade.
4. A reaction from the level must be confirmed. We do not predict price. We react to price.
5. Daily candle close below the bounce zone = stop loss.
Notice: My previous SPY, QQQ and individual stock content since 2025 is no longer visible following a TradingView content review. This included my regular weekly outlooks and mid week market updates. I have been consistently publishing structured index and equity market analysis, and I will now rebuild this track record with weekly/daily posts going forward.
This analysis is for educational purposes only and reflects my personal opinion. It is not financial advice.
Research 22.06.2026🌏 Markets:
AMEX:SPY −0.01 0.00%(pre/m)
NASDAQ:QQQ −0.16 −0.02%(pre/m)
🆕 Economic News:
US and Iranian media are reporting progress in the Peace Deal.
UK Prime Minister Keir Starmer announced his resignation.
📈 Gap Ups
Reaction to earnings/guidance:
NASDAQ:FRVO
Other news:
NYSE:ABBV to Acquire NASDAQ:APGE for $135.11 per share in cash with total equity value of approximately $10.9 billion
NASDAQ:DFTX 's LSD-based pill reduces depression symptoms in late-stage trial
NASDAQ:TTWO Preorders For GTA 6 To Begin On June 25
CBOE:BFLY : Midjourney Unveils Imaging Platform Built on BFLY's Ultrasound-on-Chip Technology
📉 Gap Downs
Reaction to earnings/guidance:
Other news:
NASDAQ:SPCX : KeyBanc adopted a more cautious view on the stock, arguing that the company's valuation has become increasingly demanding following its strong performance since listing.
Italy fears US sanctions after the conflict between Trump and Meloni — La Repubblica. MIL:RACE
‼️ Additional
TRADERS LIFT FED RATE BETS, FULLY PRICE 25BPS HIKE BY SEPTEMBER
US-Iran technical talks start today in Switzerland.
Today, Iran’s Foreign Minister said “significant progress” had been made in the talks, which continued late into the night.
Wells Fargo raised its S&P 500 year-end 2026 target to 7,950 from 7,300.
A series of meetings will take place next week to finalize key details of the US crypto market structure bill, the CLARITY Act — Punchbowl News.
📋 List of tickers involved:
NASDAQ:FRVO NYSE:ABBV NASDAQ:APGE NASDAQ:DFTX NASDAQ:TTWO CBOE:BFLY NASDAQ:SPCX MIL:RACE
Best regards – hi2morrow team.
SPY's Cross-TF Disagreement Just Entered Its Fourth SessionSPY's Cross-Timeframe Disagreement Just Entered Its Fourth
Session. Neither Side Has Blinked.
The Hourly's bear announcement at CQJ 68.4 has been sitting
there for 24 bars now, still carrying the same conviction it
had when it fired on Wednesday. The Daily's bull announcement
at CQJ 69.97 has been sitting there for 214 bars. One says
the recent move is bearish with real conviction. The other
says the larger trend is bullish and has been saying it for
months. Price is stuck between them at 746.52, inside the
touch-active zone from last week's selloff, with Vol Elev at
1st percentile on the Hourly. Nothing is happening.
The Daily's IMP is still scoring 3/5 in MIXED mode with Vol
Elev at 90th and Open Hour active, the same read it's been
carrying. The Hourly's IMP is 0/5 NONE. The bigger picture
sees institutional participation. The shorter timeframe sees
none. That's been the pattern all week and it hasn't resolved.
Resistance: 748.07 - today's pre-market high
Key resistance: 750.30-752.15 - this week's breakdown origin
Current price: 746.52
Support: 739.80-740.44 - nearest shelf below
Key support: 736.50-738.42 - this week's tested floor
Thesis line: 721.23 - the broader structural floor
Two paths from here:
The Hourly capitulates to the Daily: a fresh bull announcement
fires on the 1H, overriding the 24-bar bear print. Vol Elev
and RCZ climb off the floor. Price clears 750.30 with
participation, reopening the 752-754 zone.
The Daily capitulates to the Hourly: the 214-bar bull
announcement finally gets replaced by a fresh bear print on
the Daily timeframe. IMP loads on a down move, price loses
738.42, opens 732.45-736.50.
Four sessions of disagreement without resolution is unusual.
The longer it persists, the larger the move tends to be when
one side finally gives.
---
Built with SYNTHESIS v3.3 | SOM / ACE / IMP / SYNTHESIS
Study, not financial advice.
Time to restructure portfolioCurrently we can see the price action reaching the upper limits of the bands.
The AI bubble is real. And many largest players (nvidia, microsoft etc.) are heavily overvalued.
Last weeks have shown that Chinese AI makers can also train on other chips like Huaweii.
Therefore, it's likely to assume that we'll see a return to the mean regarding the U.S. AI bubble side. Besides AI, we can see that many others in the SP500 and most valuable are heavily invested now. I'm restructuring into SP500 Equal Weight for more exposure to smaller caps, hold some cash and invest in some small cap hardware focussed businesses.
June 21 Market AnalysisBetween equities, corporate debt, and reduced volatility demand, the market has been able to digest recent events while continuing to maintain an appetite for the riskiest assets without paying up for downside protection. What hasn't been performing well? Precious metals, carry trades, and treasuries.
This signals to me that the market is imbalanced on the side of risk and has a viable alternative with Treasuries (high real yields with cratering breakevens while real yields strongly outperform S&P 500 earnings). Although it is difficult to pinpoint when volatility expansion will occur without evidence that it is already underway, I think the market will rush from risky assets to Treasury bonds once stress starts to become felt. This would lead to continued Dollar TVC:DXY outperformance which would continue to keep pressure on precious metals TVC:GOLD .
Macro Dashboard
FX Dashboard
Stock Dashboard
Volatility Dashboard
SPY Jun 22: Compression Before Expansion?
SPY enters June 22 trapped inside a tightening range after recovering from the sharp selloff that tested 739 earlier in the week. The 15-minute chart continues to build higher lows while repeatedly stalling beneath the 748-749 resistance zone.
Friday's session formed a classic compression pattern with buyers defending the rising trendline while sellers capped every rally near recent highs. This setup often precedes a larger directional move, and the GEX positioning provides a clear roadmap for where that move could accelerate.
The battle remains centered around 747, which currently acts as both technical support and the primary dealer pivot.
Key Levels
Resistance: 750.00
Resistance: 751.00
Resistance: 752.00
Resistance: 753.00
Major Resistance: 755.00
Support: 747.00 (HVL)
Support: 744.00
Support: 740.00
Major Support: 735.00
GEX Positioning
The most important level for Monday is 747.
This level contains the HVL, major dealer positioning, and serves as the center of current market balance. Price spent most of Friday trading around this area, confirming its importance.
Above current price, positive gamma levels are stacked aggressively at 750, 751, 752, 753 and 755.
The strongest concentration sits between 750 and 752 where C1, C2 and multiple dealer positioning clusters align. If buyers can push SPY above 750, dealer hedging could begin pulling price toward 752 and 753.
Above 753, the final major upside target becomes 755 where another significant positive gamma cluster sits.
Below price, support begins at 744. This level represents the first meaningful downside target if 747 fails.
The next major support zone is 740, which previously acted as a strong reaction low during last week's selloff.
Below 740, the final major downside target becomes 735.
The overall GEX structure remains moderately bullish because SPY is holding directly on top of the HVL while the largest gamma concentrations remain stacked above current price.
Trade Considerations
The 15-minute chart is forming a tightening wedge between rising support and overhead resistance.
Buyers continue stepping in around 746-747 while sellers defend the 748-749 region.
This compression cannot continue indefinitely and should eventually resolve with expansion.
The cleanest setup is watching for either a breakout above 750 or a loss of 747.
Bullish Scenario
A breakout above 750 would place price directly into the strongest positive gamma zone.
Dealer hedging flows could accelerate a move toward 752 and 753.
If momentum remains strong, SPY could challenge the major resistance level at 755.
Bearish Scenario
A break below 747 would signal buyers are losing control of the current range.
The first downside target becomes 744.
If 744 fails, expect a move toward 740 where stronger support exists.
A break below 740 would expose 735.
Options Outlook
Above 750:
Calls gain a significant advantage with dealer positioning favoring continuation toward 752-755.
Between 747 and 750:
Expect choppy range-bound trading and frequent reversals.
Below 747:
Puts gain momentum with downside targets at 744 and 740.
Bullish Targets
750.00
751.00
752.00
753.00
755.00
Bearish Targets
747.00
744.00
740.00
735.00
Conclusion
SPY enters June 22 sitting directly on its most important level at 747. The 15-minute chart continues to compress while GEX positioning favors upside expansion if buyers can reclaim 750. Above 750, dealer hedging could fuel a move toward 752, 753 and potentially 755. Below 747, the focus shifts toward 744 and 740. Monday's battle zone is clearly defined between 747 and 750, with a breakout from that range likely determining the next directional move.
QQQ: Bearish Continuation is Expected! Here is Why:
It is essential that we apply multitimeframe technical analysis and there is no better example of why that is the case than the current QQQ chart which, if analyzed properly, clearly points in the downward direction.
Disclosure: I am part of Trade Nation's Influencer program and receive a monthly fee for using their TradingView charts in my analysis.
❤️ Please, support our work with like & comment! ❤️
QQQ / NDX Weekly Outlook – Week 24 of 2026 (15-18 JUN)Important notice: My previous SPY and QQQ content since 2025 has been removed due to a TradingView house rules violation. This included my regular weekly outlooks and mid week market updates. I have been consistently publishing structured SPY and QQQ market analysis, and I will now rebuild this track record with daily posts going forward.
QQQ/NDX Weekly Outlook
Last Week's Recap
We found a strong bounce from Key Level 1 at 696.5 on Tuesday exactly as expected. However, with the CPI report scheduled for Wednesday, patience was required and no position was taken immediately.
On Wednesday, the cooler than expected CPI report removed the primary macro concern. Following the original Long Scenario 1 plan, we entered long positions at the market open. Shortly afterward, renewed US-Iran conflict headlines and aggressive rhetoric from President Trump triggered a sharp market selloff.
Despite the volatility, price never invalidated the setup because the daily candle never closed below the lower boundary of Key Level 1. As a result, the trade remained active.
On Thursday, ceasefire headlines began circulating and the market started to deliver the exact reaction we had been expecting. Together with the group, we took partial profits at our predefined targets:
706 → 715 → 723
The trade was executed exactly according to plan.
1 trade taken.
1 trade closed green.
UA CAPITAL Market Recap
Markets have now completed Week 23, and for us it was another green week.
We are now sitting at 10 consecutive green weeks. Since the beginning of the year, we have not had a single red week. Aside from a few breakeven weeks, every week has finished positive.
Following the heavy selloff caused by the PPI report during the previous week, I explained in this week's Weekly Market Outlook that markets were now waiting for Wednesday's CPI report.
The plan was simple.
If CPI contradicted the inflation concerns created by PPI and came in cooler than expected, while geopolitical tensions remained stable, markets could experience a strong relief rally.
Early in the week, however, renewed military escalation between the US and Iran created significant uncertainty. US airstrikes against Iranian targets triggered another wave of selling pressure.
Price moved directly into the levels identified in the Weekly Market Outlook. SPY tested 732.5 while QQQ tested 696.5. At that point, markets had reached levels where a bullish technical structure could begin forming. The only missing ingredient was a catalyst and CPI had the potential to become that catalyst.
On Wednesday, CPI came in lower than expected and markets initially reacted positively during premarket trading.
The original plan already contained a clean invalidation framework using daily closes below key levels.
On Thursday, markets reacted strongly after reports suggested that peace negotiations were moving forward again.
Friday delivered an even stronger continuation move and re established the bullish structure I had originally expected.
In reality, the entire weekly thesis played out exactly as anticipated:
Technical demand zone + cooler CPI data + geopolitical de-escalation = strong swing rally.
Once Thursday's reaction confirmed the scenario, I informed premium members that markets could potentially begin exploring new all time highs over the next one to two weeks, assuming geopolitical risks remain contained.
Together with the group, we initiated multiple swing long positions across SPY, QQQ, and several individual names including ARM, AMD, SNDK, MU, and MRVL.
The swing call positions established in ARM, SNDK, and AMD generated substantial gains by Friday.
This Week's Scenarios / Prediction
Risk Index
The Risk Index has shifted back into risk on mode following the strong call flow triggered by peace related headlines.
This oscillator reads macro conditions and converts them into a technical risk framework. It was developed internally at UA CAPITAL and remains the primary indicator I use for both short term and long term positioning decisions.
The Risk Index currently signals the potential for bullish continuation. If geopolitical headlines remain stable and no new negative catalysts emerge, the model suggests that new all time highs remain achievable.
For that reason, we will continue focusing exclusively on swing long opportunities from predefined key levels.
Long Scenarios
We currently have two primary bounce zones.
Long Scenario 1
KEY Level 1 (731): This is the first major support zone where I expect a reaction. If price reaches this area and confirms a bounce, call options can be used to establish long exposure.
Targets:
735.5 → 744 → 748.5 → 750
Runner can be held.
Long Scenario 2
KEY Level 2 (713): This is the second major demand zone. If price reaches this level and confirms support, call options can be used to establish long exposure.
Targets:
721 → 730 → 735.5 → 744 → 748.5 → 750
Premium Tip
Price may temporarily break below these bounce zones, creating the appearance of a failed setup before reclaiming the level and moving higher. Because of this, entries can be considered after an hourly bullish candle close above the zone.
Position Management Rules
1. Entry model: One hourly bullish candle close above the level.
2. Take profits in stages because market reversals can happen quickly.
3. After the first profit target is reached, move all remaining stop losses to breakeven and convert the position into a risk-free trade.
4. A reaction from the level must be confirmed. We do not predict price. We react to price.
5. Daily candle close below the bounce zone = stop loss.
This analysis is for educational purposes only and reflects my personal opinion. It is not financial advice.
SPY / SPX Weekly Outlook – Week 24 of 2026 (15-18 JUN)SPY/SPX Weekly Outlook
Last Week's Recap
We found a clean bounce from Key Level 1 at 732.5 on Tuesday. However, with the CPI report approaching, patience was required, so we did not enter the trade until Wednesday.
Once the cooler than expected CPI data was released on Wednesday, the macro uncertainty around inflation was removed. Following our Long Scenario 1 plan, we entered long positions shortly after the market open.
However, after the US-Iran conflict escalated and additional comments from Trump hit the wires, markets sold off aggressively. Despite the volatility, our invalidation level required a daily close below 725, which never happened. As a result, we stayed in the trade and continued following the original plan.
On Thursday, ceasefire headlines started circulating and the market began delivering exactly the reaction we had anticipated. Together with the group, we took partial profits at our predefined targets of 737 → 740 → 744.
1 trade.
1 win.
UA CAPITAL Market Recap
Markets have now completed Week 23, and for us it was another green week.
We are now sitting at 10 consecutive green weeks. Since the beginning of the year, we have not had a single red week. Aside from a few breakeven weeks, every week has finished positive.
Following the heavy selloff caused by the PPI report during the previous week, I explained in this week's Weekly Market Outlook that markets were now waiting for Wednesday's CPI report.
The plan was simple.
If CPI contradicted the inflation concerns created by PPI and came in cooler than expected, while geopolitical tensions remained stable, markets could experience a strong relief rally.
Early in the week, however, renewed military escalation between the US and Iran created significant uncertainty. US airstrikes against Iranian targets triggered another wave of selling pressure.
Price moved directly into the levels identified in the Weekly Market Outlook. SPY tested 732.5 while QQQ tested 696.5. At that point, markets had reached levels where a bullish technical structure could begin forming. The only missing ingredient was a catalyst and CPI had the potential to become that catalyst.
On Wednesday, CPI came in lower than expected and markets initially reacted positively during premarket trading.
The original plan already contained a clean invalidation framework using daily closes below key levels.
On Thursday, markets reacted strongly after reports suggested that peace negotiations were moving forward again.
Friday delivered an even stronger continuation move and re established the bullish structure I had originally expected.
In reality, the entire weekly thesis played out exactly as anticipated:
Technical demand zone + cooler CPI data + geopolitical de-escalation = strong swing rally.
Once Thursday's reaction confirmed the scenario, I informed premium members that markets could potentially begin exploring new all time highs over the next one to two weeks, assuming geopolitical risks remain contained.
Together with the group, we initiated multiple swing long positions across SPY, QQQ, and several individual names including ARM, AMD, SNDK, MU, and MRVL.
The swing call positions established in ARM, SNDK, and AMD generated substantial gains by Friday.
This Week's Scenarios / Prediction
Risk Index
The Risk Index has shifted back into risk on mode following the strong call flow triggered by peace related headlines.
This oscillator reads macro conditions and converts them into a technical risk framework. It was developed internally at UA CAPITAL and remains the primary indicator I use for both short term and long term positioning decisions.
The Risk Index currently signals the potential for bullish continuation. If geopolitical headlines remain stable and no new negative catalysts emerge, the model suggests that new all time highs remain achievable.
For that reason, we will continue focusing exclusively on swing long opportunities from predefined key levels.
Long Scenarios
We currently have two primary bounce zones.
Long Scenario 1
KEY Level 1 (749.5): This is the first major support zone where I expect a reaction. If price reaches this area and confirms a bounce, call options can be used to establish long exposure.
Targets:
753 → 755.5 → 760
Runner can be held.
Long Scenario 2
KEY Level 2 (737.5): This is the second major demand zone. If price reaches this level and confirms support, call options can be used to establish long exposure.
Targets:
744 → 749.5 → 753 → 755.5 → 760
Premium Tip
Price may temporarily break below a bounce zone, create the appearance of a failed support level, and then quickly reclaim the area.
Because of this, entries can be considered after an hourly bullish candle close back above the level.
Position Management Rules
1. Entry model: One hourly bullish candle close above the level.
2. Take profits in stages because market reversals can happen unexpectedly.
3. After the first profit target is reached, move the stop loss on all remaining contracts to breakeven and create a risk-free position.
4. Reactions from key zones must be confirmed before entering. We do not predict. We react to price.
5. Daily close below the bounce zone = stop loss.
Notice: My previous SPY and QQQ content since 2025 has been removed due to a TradingView house rules violation. This included my regular weekly outlooks and mid week market updates.
This analysis is for educational purposes only and reflects my personal opinion. It is not financial advice.
SPY/SPX Updated Forecast (16–18 JUN)SPY/SPX Updated Forecast
This Week's Scenarios / Prediction
Risk Index
The Risk Index remains in a strong risk on regime, and currently there are no signs suggesting a meaningful pullback before another attempt at all time highs.
This oscillator reads macro conditions and converts them into a technical risk framework. It was developed internally at UA CAPITAL and remains the primary indicator I use for both short term and long term positioning decisions.
The Risk Index continues to signal bullish continuation. If geopolitical headlines remain stable and no new negative catalysts emerge, the model suggests that new all time highs remain achievable.
For that reason, we will continue focusing exclusively on swing long opportunities from predefined key levels.
Long Scenarios
We currently have two primary bounce zones.
Long Scenario 1
KEY Level 1 (755.5)
This is the first major support zone where I expect a reaction. If price reaches this area and confirms a bounce, call options can be used to establish long exposure.
Targets:
758 → 760 → 765
Runner can be held.
Long Scenario 2
KEY Level 2 (750)
This is the second major support zone where I expect a reaction. If price reaches this area and confirms a bounce, call options can be used to establish long exposure.
Targets:
753 → 755.5 → 758 → 760
Runner can be held.
Premium Tip
Price may temporarily break below these bounce zones, creating the appearance of a failed setup before reclaiming the level and moving higher. Because of this, entries can be considered after an hourly bullish candle close above the zone.
Position Management Rules
1. Entry model: One hourly bullish candle close above the level.
2. Take profits in stages because market reversals can happen quickly.
3. After the first profit target is reached, move all remaining stop losses to breakeven and convert the position into a risk-free trade.
4. A reaction from the level must be confirmed. We do not predict price. We react to price.
5. Daily candle close below the bounce zone = stop loss.
Notice: My previous SPY and QQQ content since 2025 is no longer visible following a TradingView content review. This included my regular weekly outlooks and mid-week market updates.
I have been consistently publishing market research and will continue sharing new analysis and updates going forward.
This analysis is for educational purposes only and reflects my personal opinion. It is not financial advice.
QQQ/NDX Updated Forecast (16–18 JUN)QQQ/NDX Updated Forecast (16–18 JUN)
This Week's Scenarios / Prediction
Risk Index
The Risk Index remains in a strong risk on regime, and currently there are no signs suggesting a meaningful pullback before another attempt at all time highs.
This oscillator reads macro conditions and converts them into a technical risk framework. It was developed internally at UA CAPITAL and remains the primary indicator I use for both short term and long term positioning decisions.
The Risk Index continues to signal bullish continuation. If geopolitical headlines remain stable and no new negative catalysts emerge, the model suggests that new all time highs remain achievable.
Long Scenarios
We currently have two primary bounce zones.
Long Scenario 1
KEY Level 1 (743)
This is the first major support zone where I expect a reaction. If price reaches this area and confirms a bounce, call options can be used to establish long exposure.
Targets:
745.5 → 748.5 → 750 → 755
Runner can be held.
Long Scenario 2
KEY Level 2 (731)
This is the second major support zone where I expect a reaction. If price reaches this area and confirms a bounce, call options can be used to establish long exposure.
Targets:
736 → 741 → 744 → 748.5 → 750
Runner can be held.
Premium Tip
Price may temporarily break below these bounce zones, creating the appearance of a failed setup before reclaiming the level and moving higher. Because of this, entries can be considered after an hourly bullish candle close above the zone.
Position Management Rules
1. Entry model: One hourly bullish candle close above the level.
2. Take profits in stages because market reversals can happen quickly.
3. After the first profit target is reached, move all remaining stop losses to breakeven and convert the position into a risk-free trade.
4. A reaction from the level must be confirmed. We do not predict price. We react to price.
5. Daily candle close below the bounce zone = stop loss.
Notice: My previous SPY and QQQ content since 2025 is no longer visible following a TradingView content review. This included my regular weekly outlooks and mid week market updates.
I have been consistently publishing market research and will continue sharing new analysis, forecasts and market updates going forward.
This analysis is for educational purposes only and reflects my personal opinion. It is not financial advice.
Weekly Bias — 22 JuneThe market is still in an intermediate-term bull trend, but leadership is becoming increasingly narrow & more dependent on semis
Money continues rotating into semis → AI infrastructure, chips, networking & memory
Money is leaving software
Leadership concentrated in NASDAQ:NVDA , NASDAQ:AVGO , NASDAQ:AMD & NASDAQ:MU
NASDAQ:NVDA is still bullish, reclaiming MAs, RSI recovering, MACD improving & volume expanding
NASDAQ:AVGO looks ready for another attempt toward highs
NASDAQ:AMD nearly completed a V-shaped reversal
NASDAQ:MU is nearly back at highs, volume expanding with excellent momentum
NASDAQ:GOOGL could become a catch-up trade
NASDAQ:AAPL is still weak
NASDAQ:MSFT is below several retracement levels
NASDAQ:META is still consolidating & neither bullish nor bearish, but needs to reclaim $600
NASDAQ:TSLA is range-bound with no clear edge
Everything depends on NASDAQ:NVDA , NASDAQ:AVGO , NASDAQ:AMD & NASDAQ:MU , so if semis finally roll over, the market likely follows
Brief consolidation or shallow pullback early in the week as the market digests recent gains Buyers step in quickly, especially if yields remain soft
Semis resume leadership & pull NASDAQ:QQQ to new highs
Rotation broadens into laggards ( NASDAQ:MSFT , NASDAQ:GOOGL , NASDAQ:AAPL ), allowing the index to grind higher with healthier breadth
Semi leadership finally stalls, breadth weakens further & NASDAQ:QQQ experiences a sharper 3–5% correction
The primary caution is the increasingly concentrated leadership — it's not a sell signal today, but it means monitoring the semi complex closely, as it has become the market's key source of strength
The options market isn't positioned defensively
Combined with falling long-end Treasury yields, VIX around 18, semi leadership & improving momentum, the option positioning remains supportive of higher prices, although there are several gamma magnets that could pin price early in the week
AMEX:SPY
Price reclaimed 20d EMA & 78.6% retracement while holding comfortably above the 50d EMA
The $760 level is important because it's the recent swing high
The $750 strike dominates
This looks like the primary dealer gamma pivot
Above $750, dealers likely become longer gamma, volatility compresses & upside can grind higher
Below $745, put positioning becomes much heavier
NASDAQ:QQQ
Trend is still making higher highs & higher lows (fairly balanced)
Well above the rising 50d EMA (~$693)
Above all major Fibonacci retracement levels from the recent advance
The recent pullback didn't damage the intermediate trend
There are 2 obvious liquidity pools — ATH & 20d EMA
The market hasn't taken either side
Still a continuation structure
The biggest feature is the enormous concentration around $740
Below $735, gamma begins decreasing
Above $745, positive gamma likely expands
If NASDAQ:QQQ gets above $745 early in the week there isn't much nearby resistance until new call writers appear
AMEX:IWM
$290 is a massive support level
$300 is a major upside magnet
Very little put interest exists above $300
If AMEX:IWM breaks above $300, dealers may have to chase delta higher because there's very little put inventory offsetting call exposure
A decisive move through the highs would ideally come with a more noticeable expansion in volume
Initial move toward the dominant gamma strikes ( AMEX:SPY $750, NASDAQ:QQQ $740–$745)
If those levels hold, expect intraday mean-reversion & relatively muted volatility
Above these levels, supportive macro conditions & dealer positioning continues to favor a grind higher rather than the start of a larger correction
Favors buying shallow pullbacks
Bullish (≈60%)
NASDAQ:QQQ reclaims $745 & extends toward $750
AMEX:SPY pushes through $750 toward $755.
Semis continue to lead while laggards ( NASDAQ:AAPL , NASDAQ:MSFT ) stabilize
Neutral (≈25%)
Price oscillates around the major gamma pins ( AMEX:SPY $750, NASDAQ:QQQ $740) as dealers dampen realized volatility
Bearish (≈15%)
AMEX:SPY loses $745 & NASDAQ:QQQ breaks below $735
Moves price away from the high positive-gamma area, allowing volatility to expand & increases the odds of a deeper pullback
All 3 ETFs are essentially telling the same story
Current RSI ~60 is the sweet spot — neither overbought or oversold which leaves room to go higher
Stochastic is turning back upward → first pullback resets momentum, then buyers re-enter
Momentum is improving before the MACD line crosses higher
This is an early bullish momentum signal rather than a late one
Price held above prior lows + momentum already improving = hidden bullish continuation
Across the technicals, intermarket data & option positioning, the evidence remains tilted toward trend continuation rather than distribution
The June pullback appears more consistent with a liquidity sweep that reset momentum than the start of a larger bearish reversal
The market has supportive macro conditions (easing long-end yields), contained volatility & strong semi leadership
The one area that deserves continued monitoring is breadth
If semis continue to lead while participation gradually broadens into lagging mega-cap names such as NASDAQ:MSFT , NASDAQ:GOOGL & NASDAQ:AAPL , the rally becomes more durable
If semi leadership falters before breadth improves, the risk of a sharper correction rises materially
Right now; however, the charts still favor buying controlled pullbacks over anticipating an immediate trend reversal
NASDAQ:QQQ
Buy 5–10 DTE slightly ITM calls on any pullback into $722–$726, provided that level is defended intraday
If $740–$745 is reclaimed on expanding volume, rotate into 7–14 DTE ATM calls & trail stops rather than taking profits immediately
Invalidation on a daily close below $715 would invalidate the near-term bullish thesis & increase the probability of a move toward the rising 50d EMA near $693
AMEX:SPY
Buy 5–10 DTE slightly ITM calls on pullbacks into $743–$745 that hold intraday
If AMEX:SPY closes above $750 on expanding volume, shift to 7–14 DTE ATM calls and target $760–$775
The near-term bullish thesis weakens on a daily close below $739 & is invalidated if AMEX:SPY loses $730 on strong volume, which would substantially increase the probability of a test of the rising 50d EMA in the $715–$720 region
AMEX:IWM
Buy 5–10 DTE slightly ITM calls on pullbacks into $288–$290 that hold
If AMEX:IWM closes above $300, consider rolling into 10–21 DTE ATM calls targeting $310–$318
The bullish thesis begins to weaken below $285 & is invalidated on a decisive close below $281 (the rising 50d EMA)
A loss of that level would shift the focus toward a retest of $270–$275, where the next meaningful support resides
The market is still in an intermediate-term bull trend, but leadership is becoming increasingly narrow & more dependent on semis
NASDAQ:QQQ — strongest momentum, supported by easing long-end yields & semi leadership
AMEX:IWM — improving breadth & a favorable technical structure with a clean $300 breakout trigger
AMEX:SPY — still constructive, but more likely to grind higher than accelerate due to heavier overhead gamma around $750–$760
NASDAQ:MU is one of the strongest-looking semi names
NASDAQ:NVDA , NASDAQ:AVGO , NASDAQ:AMD & NASDAQ:MU are leading the market
NASDAQ:MU is more than just a single-stock event — it has the potential to influence sentiment across the AI supply chain
Bullish (≈50%)
NASDAQ:MU delivers better-than-expected HBM & DRAM guidance
Gross margin beats expectations
Strong AI memory demand commentary
Positive Q4 outlook
NASDAQ:QQQ challenges $748–$750
NASDAQ:NVDA , NASDAQ:AVGO , NASDAQ:AMD , NASDAQ:ARM & other AI names participate
Neutral (≈30%)
Beat on earnings
Guidance merely meets expectations
NASDAQ:MU trades sideways, semis digest gains & NASDAQ:QQQ likely remains pinned around its gamma cluster
Bearish (≈20%)
Weak guidance
Softer pricing outlook
AI demand commentary disappoints
NASDAQ:MU could decline sharply
NASDAQ:QQQ likely tests $722–$730 rather than making new highs
Because semiconductor leadership has been carrying the market, a disappointing NASDAQ:MU report would probably have an outsized effect on NASDAQ:QQQ
Core PCE is the key macro event on Thursday & it directly influences yields
If core PCE is cooler than expected → 10Y yield likely moves lower, growth stocks benefit & positive NASDAQ:MU guidance would amplify the move
If core PCE is hotter → 10Y yield could rebound toward 4.5–4.6%, high-multiple AI names would likely see valuation pressure & NASDAQ:MU would need an exceptional report to offset the macro headwind
Implied volatility is likely to remain elevated into Wednesday & then contract afterward
Favor 3 or 10 July expirations over very short-dated weeklies
They provide enough time for the market to digest both NASDAQ:MU & Thursday's macro data while reducing the impact of rapid theta decay
NASDAQ:MU beats or guides positively and core PCE is benign enough for NASDAQ:QQQ to challenge or exceed $748–$750
Mixed outcomes produce a consolidation between $722 & $748
NASDAQ:MU disappoints and/or core PCE comes in hot enough to push yields higher, leading to a deeper pullback toward $722–$730
NASDAQ:MU is now entering earnings from a position of strength rather than skepticism which raises the bar for the report
Price is ~19% above the 20d EMA, showing strong momentum
The breakout toward $1,149 came on elevated volume, but the recent advance has occurred on average rather than expanding volume
Momentum is re-accelerating rather than exhausting
If NASDAQ:MU reacts well to earnings, the MACD confirmation could follow quickly
1. Buy-side liquidity at $1,149
Every algorithm sees it
If earnings are strong, that's the first target
Above, there is relatively little recent price memory until roughly $1,220–1,250
2. Sell-side liquidity
The first meaningful support is $1,050–$1,070
Below, $1,000, then the rising 20d EMA near $950
The stock is already discounting strong HBM demand, AI memory strength & improving DRAM pricing, so a small beat may not be enough, but a strong beat plus raised guidance could produce another expansion leg
Bullish (≈50%)
EPS and revenue beat
HBM demand exceeds expectations
Gross margin expands
Management raises guidance
Clear $1,149 → $1,200–1,250
Neutral (≈30%)
Beat in line with expectations
Guidance is solid, but not exceptional
Stock settles into $1,080–$1,150
NASDAQ:QQQ impact is modest
Bearish (≈20%)
Weak guidance
Softer HBM demand outlook
Margin disappointment
Test $1,050, then $1,000
Worst-case retest of the rising 20d EMA around $950
Because semis are leading the market, NASDAQ:MU 's report could have an outsized effect on NASDAQ:QQQ
Strong NASDAQ:MU + benign Core PCE increases the odds that NASDAQ:QQQ breaks through $748–$750 & extends toward the next resistance area
Weak NASDAQ:MU + hotter-than-expected core PCE raises the risk of a pullback toward the $722–$730 support area
The "whisper" going into this report is meaningfully above official Wall Street consensus — biggest risk for longs as NASDAQ:MU doesn't just need to beat — it likely needs to beat & raise
Avoid holding very short-dated (0–2 DTE) long premium through the event, as implied volatility is likely to contract sharply after earnings regardless of direction
NASDAQ:MU is technically strong, with no evidence of distribution or bearish divergence so the setup favors continuation if management delivers a clear upside surprise on guidance, but the challenge isn't whether the business is healthy — the challenge is whether the results are strong enough to justify a stock already trading near ATHs
The bias remains bullish, but the focus is now on whether earnings justify a stock already trading near record highs, rather than on a momentum breakout from an earlier base
Investors are focused less on the headline numbers & more on 4 forward-looking items
HBM (High Bandwidth Memory) demand
Gross margin
Q4 revenue guidance
2027 AI capex commentary
Investors want confirmation that hyperscaler spending remains strong into next year
After a nearly 300% rally this year, the stock is unlikely to react primarily to a modest EPS beat
Instead, the market is likely to ask is AI memory demand still accelerating, is pricing still improving, can Micron supply enough HBM to meet demand, are customers committing further into 2027?
Those answers will probably matter more than whether EPS beats consensus by a few cents
Even if NASDAQ:MU reports a headline beat, the stock could still sell-off if management suggests HBM supply is beginning to catch up with demand faster than expected, DRAM pricing is peaking, gross margin expansion is slowing, or Q4 guidance is merely in line with expectations
Thursday morning is the higher-risk event for the indexes
If NASDAQ:MU is strong, the market will already be leaning bullish into Thursday morning, which means GDP & core PCE determine whether buyers can sustain the move or whether they sell-the-news
The market has been rewarding disinflation & AI simultaneously
If NASDAQ:MU validates the AI spending narrative & core PCE doesn't challenge the recent decline in Treasury yields, those 2 catalysts reinforce each other rather than compete
In that case, expect institutions to treat any early Thursday volatility as a buying opportunity, with semis continuing to lead the advance
The main risk isn't GDP — it's a core PCE surprise that pushes the 10Y yield decisively back above the recent range & forces a repricing of growth-stock valuations
The market isn't pricing a large macro shock for Thursday as of Friday's close
The options positioning suggests traders expect movement, but not a major regime change
While the exact consensus can still shift before the release, the market narrative going into Thursday is approximately headline PCE (MoM) around 0.1–0.2%, core PCE (MoM) around 0.2% & core PCE (YoY) around 2.7–2.8%
The "whisper" is generally that inflation continues to cool gradually rather than collapse
0.2% core MoM → largely expected
0.1% or lower → dovish surprise
0.3% → manageable, but likely pushes yields modestly higher
0.4%+ → meaningful hawkish surprise that could pressure growth stocks
The positioning suggests something close to NASDAQ:QQQ ±1.3–1.8%, AMEX:SPY ±1.0–1.3% & AMEX:IWM ±1.5–2.0%
The biggest change versus last week is that the burden of proof has shifted from the technicals to the catalysts
The charts are already bullish
Now the market needs NASDAQ:MU & PCE to validate that positioning
The first 30–60 minutes after 8:30 should tell us whether the overnight move is likely to persist
If Thursday resolves positively, momentum funds often continue adding into quarter-end strength
If Thursday disappoints, Friday can become a profit-taking session
Bullish (≈45%)
NASDAQ:MU beat, raise guidance & HBM demand remains supply constrained → core PCE → 0.2% or cooler → 10Y falls toward 4.4% → semis outperforms again → QQQ breaks $748–$750 → AMEX:SPY
breaks $760 → AMEX:IWM breaks $300
Neutral (≈35%)
NASDAQ:MU strong → PCE in-line → market rallies → consolidates → NASDAQ:QQQ $740–$750, AMEX:SPY $748–$760 & AMEX:IWM $295–$300
Bearish (≈20%)
NASDAQ:MU fine → core PCE 0.3–0.4% → 10Y back above 4.5% → semis fade → QQQ returns toward $730–$735
Monday–Tuesday
Quiet, range-bound trade around the dominant gamma levels as participants wait for catalysts
Watch whether NASDAQ:QQQ holds $740–$745 & AMEX:SPY holds $745–$750
Buy support, avoid chasing breakouts
Wednesday
Volatility compresses into the close
NASDAQ:MU earnings set the tone for semi sentiment
Watch Treasury yields & semi relative strength
Keep position sizes measured ahead of earnings
Reduce event risk if you're overexposed to very short-dated options
Favor defined-risk structures
Focus on NASDAQ:MU guidance, HBM commentary & Q4 outlook — not just EPS
Let the initial reaction settle before drawing conclusions
Thursday
If NASDAQ:MU is well received & core PCE is at or below expectations, expect the strongest directional move of the week, with NASDAQ:QQQ challenging $748–$750 & potentially extending toward $760–$772, AMEX:SPY targeting $760 & AMEX:IWM attempting a sustained move above $300
If NASDAQ:MU is strong, but core PCE is hotter than expected, expect an initial rally that fades as Treasury yields rise
Watch core PCE first, then the 10Y yield, then whether QQQ/SPY hold any overnight gains Trade the confirmation rather than the headline
Friday
Follow-through day
Either momentum continues if Thursday confirms the bullish case, or the market consolidates/retraces if Thursday disappoints
Look for continuation if Thursday confirms the trend; otherwise, watch for orderly profit-taking into the weekend
Stay with the prevailing trend unless key support breaks
I'd still characterize this as a "buy the dip until proven otherwise" market since the bullish thesis remains intact as long as NASDAQ:QQQ holds roughly $722–$730, AMEX:SPY holds $743–$745 & AMEX:IWM holds $290–$288 — the event most likely to invalidate that thesis this week is a hotter-than-expected core PCE that drives a sustained rise in long-end yields; rather than, NASDAQ:MU earnings alone
GOLD GLD JUN - 2026GLD has broken its primary uptrend and is now testing one of the most important institutional distribution zones around $401.
Key levels to monitor:
Major Distribution: $509 (7B Sold)
Resistance: $450
Institutional Distribution: $401 (4.6B Sold)
Gap Zones: $400 and $430
Major Support: $350-$340
Institutional Orders: $300-$280
The $401 level has become the key pivot. A recovery above this zone could trigger a move toward the $430 gap and eventually the $450 resistance. Failure to reclaim $401 increases the probability of a deeper correction into the $350-$340 institutional support zone.
This analysis is based on institutional market structure, volume, liquidity, and support/resistance—not financial advice.