SPY Holds Stage 2 as Breadth FadesSPY continues to trade above a rising 150-day SMA, a daily approximation of Weinstein’s 30-week moving average.
Nearly half of the stocks in the market universe are also still advancing, but participation has started to shift.
Stage 2 participation currently stands at 48.6%. That is still a strong reading, but it peaked near 55% in mid-July and has been trending lower.
Stage 3 (Topping) has risen to 21.0%, its highest level since early spring.
Stage 4 (Declining) has turned higher from its summer lows and now represents 18.4% of the universe.
Stage 1 (Basing) is only 12.0%, leaving a relatively small group of stocks currently positioned to rotate into Stage 2.
The comparison with March is important.
At that point, Stage 4 was near 40% while Stage 2 was around 43%. Over the following months, stocks steadily rotated forward through the price cycle: Stage 4 contracted while Stage 2 expanded toward 55%.
That process has now started moving in the opposite direction.
This is not a broadly bearish signal. SPY remains above a rising 30-week MA proxy, and nearly half the market remains in Stage 2.
What has changed is the direction of participation.
If Stage 2 continues to contract while Stages 3 and 4 expand, fewer stocks will be participating in the advance even if SPY remains relatively strong.
For now: healthy participation, but weakening beneath the surface.
 Short
Short
$QQQ Daily Close — Sep 10NASDAQ:QQQ Daily Close — Sep 10
NASDAQ:QQQ closed 708.69, down 1.06%, below both @ripster47 EMA clouds. Price opened under the 34-50, high of the day was 712.06, and it closed at 708.69 — through the whole cloud. That's a 34-50 Break. The 5-12 Break came first in the same bar.
The volume finally answered the question
For six sessions I've been flagging the same thing on this chart: every up bar came on below-average volume. The Sep 3 curl, the follow-through, the bounces — all of it on light participation. The one day volume did expand was last Friday, and that was profit-taking into strength.
Today: 31.33M against a 30.77M average, 102% relative volume. First above-average day in a week. It came on a red bar that broke two clouds.
When buyers won't show up for six sessions and then sellers show up once, you have your answer about who was actually in this move.
The bar itself
Range 5.20 against a 9.01 ATR — 58% of a normal day, on above-average volume. More effort than result. Sellers had to work for a five-point move, which means there was some bid absorbing it, but not enough to matter. Close finished in the lower third at 708.69, no recovery into the bell.
What we did not get is climactic volume. This was above average, not heavy. Nobody has stepped in to catch it yet, and the 700 shelf below is untested.
My position
I'm out. The 5-12 Break on a closing basis is my exit rule and it fired today. That trade was up 1.6R last Friday and I gave it back — which is the honest cost of managing against a level instead of taking profit into a target. The rule did its job. I'd rather post that than pretend it didn't happen.
Levels into CPI
706.86 is today's low and it's the line. Lose it and 704 comes in, then 700 — which is both a psych number and a shelf that's been defended twice since June.
There is no long trigger until price reclaims the @ripster47 5-12 EMA cloud around 716. That's a 5-12 Curl and it's seven points away.
CPI tomorrow. A hot print is hawkish for the dollar and bearish for the indices, and it lands on a structure with nothing tested underneath. A cool print has to fight back through two clouds before it means anything.
One thing worth watching at 700: if we get there on genuinely heavy volume with a close well off the lows, that's stopping volume, and the read changes completely. Heavy volume at a major low is a buy signal, not a sell one.
Levels, not opinions. 706.86 below, 716 above.  Short
Short
$GLD — Sep 10 closeAMEX:GLD — Sep 10 close
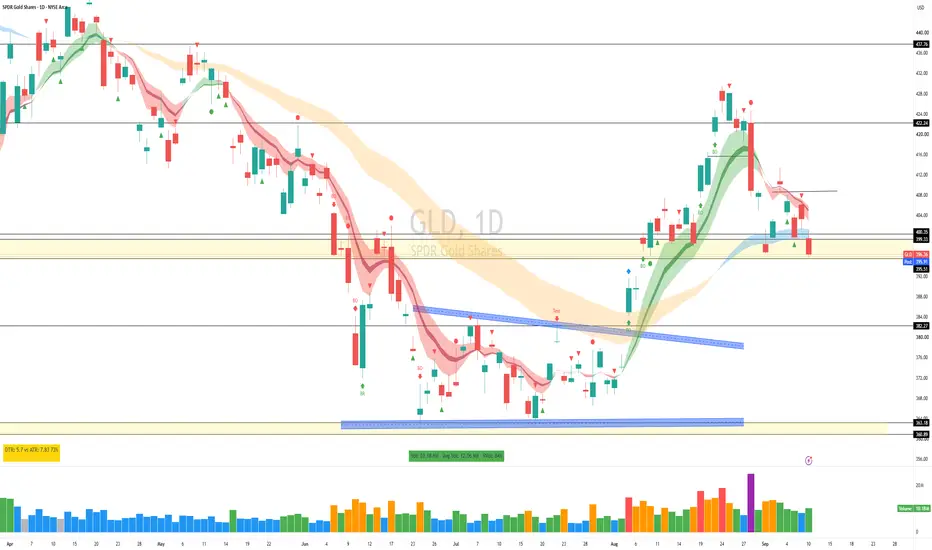
400 failed. Another Gap Down Fade — opened under the level, tried to reclaim it at 401.15, then sold off all day to close 396.36, near the lows.
That's an MTF Break (@ripster47 EMA cloud). The close is below 399.33, which was my line, so my long from 400 is done. I'll own that: I said at the time the bounce was unconfirmed — no Stopping Volume, no hammer, holding on an absence of sellers rather than any real buying. That's the version that gives way, and it did.
Volume finally showed up. 10.18M after three days of 9.8, 8.7, 8.0. The compression resolved, and it resolved down. Still below average though, so this is supply entering — not a climax, no capitulation.
Now the detail that matters: the low was 395.45. The Stopping Volume low is 395.51. It wicked six cents through and closed 85 cents back above.
So 400 is gone but 395 is not. My short trigger is a close below 395.51 — then 390, then 384. Until that prints, this is a level being tested, not broken.
All eyes on CPI tomorrow. Hot print is hawkish, dollar up, gold down. Cool print flips it. The data decides this level, not the chart — so I'd rather react to it than guess it.
Short trigger: close under 395.51. Long: nothing until 399.33 is reclaimed. Short 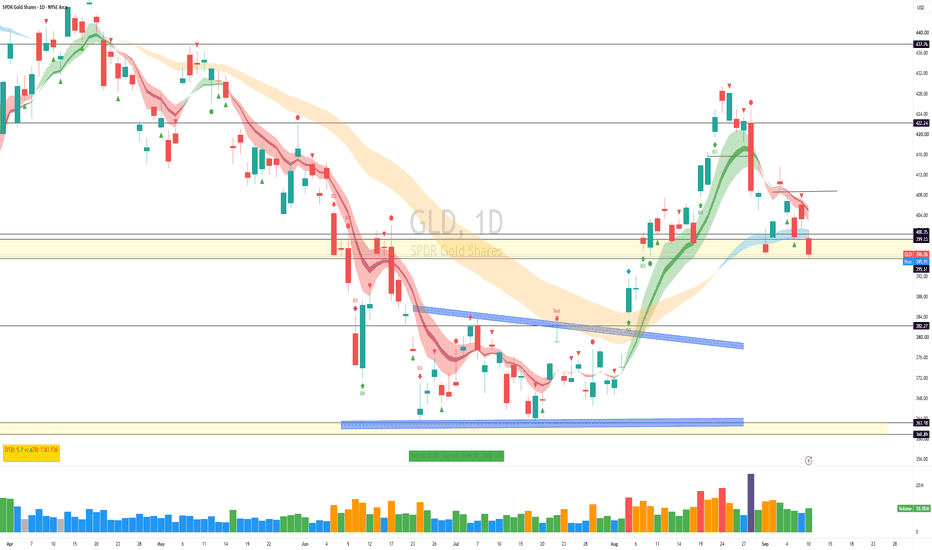
$SOXX , 12M Semiconductor Cycle Structure IdeaSOXX tracks the semiconductor sector, giving exposure to companies across chip design, manufacturing, memory, semiconductor equipment and related technologies.
That makes SOXX much more important than simply another technology ETF.
Its cycle structure can be used as a broader reference for the semiconductor complex, including major names such as NVIDIA, AMD and Broadcom on the chip-design side, TSMC and Samsung on manufacturing, Micron and SK Hynix in memory, and ASML, Applied Materials, Lam Research and KLA across semiconductor equipment.
These companies do not all move for exactly the same reasons, but they are connected through the same semiconductor production cycle.
The current SOXX chart shows a clear 12-month cycle structure.
There are three projected upside targets for the 12M cycle.
The first target has already been reached !!
Price subsequently rejected from that level and entered the current corrective phase.
The remaining two 12M targets are still projected above the market, around 910 and 1,150.
The correction is where the structure becomes interesting.
I have three separate correction target groups mapped below the current price:
$395–$420
$320–$350
$205–$230
These are not three separate bearish scenarios. They are three possible correction zones within the same larger cycle. Price does not need to reach all three.
The cycle can complete its correction at any one of these structural areas before continuing toward the remaining 12M targets. This becomes particularly relevant when looking at the underlying semiconductor stocks.
A correction in SOXX can propagate differently through the sector:
NVDA / AMD / AVGO
semiconductor demand and high-performance compute
TSM
advanced foundry and manufacturing capacity
MU / SK Hynix / Samsung
memory and HBM cycle
ASML / AMAT / LRCX / KLAC
semiconductor manufacturing equipment and capacity expansion
Therefore, SOXX is not simply measuring one company or one semiconductor subsector. It represents the interaction between multiple stages of the semiconductor cycle.
That is why the structural levels on SOXX are important.
12M cycle target 1 : completed
Current structure : corrective phase
Correction zone 1 : $395–$420
Correction zone 2 : $320–$350
Correction zone 3 : $205–$230
12M cycle target 2 : $910+-
12M cycle target 3 : $1,150+-
Now the question is where the correction completes.
If one of the lower structures provides the required reaction, the remaining 12M targets remain part of the larger cycle structure.
The semiconductor cycle therefore becomes something I want to monitor across the entire chain rather than through a single stock (despite owning several of those)
SOXX gives us the structure !!!!!!!
The individual semiconductor stocks show how that structure propagates through the sector.
Follow, Boost, Join, Thank You!
Financial Disclaimer: This post is not financial advice. I am not your financial advisor, your life coach, or your legally responsible adult. Always do your own research and never trade based solely on internet content. $BWET - ETF , Tanker Freight Cycle Structure IdeaBWET (Breakwave Tanker Shipping ETF) is not a traditional tanker-stock ETF. It provides exposure to crude-oil tanker freight through futures, primarily VLCC TD3C contracts for Middle East Gulf to China, with additional TD20 Suezmax exposure. The instrument therefore reflects tanker freight rates, vessel availability, route changes and the pricing of future transportation costs rather than the equity value of shipping companies.
That distinction is important when reading the long-term chart.
The current weekly structure is approaching a major decision point around the 640 area.
From here, I have three different cycle paths mapped on the chart.
Path 1:
A deeper retracement toward the 210 area, followed by a recovery toward the 800–900 region and a subsequent return toward the current structural area.
This would represent a significant correction while still keeping the larger cycle structure intact.
Path 2:
Price continues expanding from the current level before completing the larger correction.
The first expansion zone is around 1,500, followed by a retracement toward the current structural area and another expansion toward the 1,200–1,250 region.
In this sequence, the correction comes later rather than immediately.
Path 3:
The 210 structural level fails and the cycle searches for much deeper liquidity.
The major downside liquidity zone is around 28–30.
From there, the chart allows for a recovery toward the 70–80 region.
Above the current structure, the higher-timeframe expansion levels become increasingly significant, with the chart projecting approximately 2,100, 2,900, 4,100 and 5,600.
The important point is that BWET can move extremely aggressively because it is directly exposed to freight futures.
A change in tanker freight conditions can therefore produce movements that are substantially larger than what would normally be expected from a conventional equity ETF.
For the cycle analysis, I am not trying to select one path in advance.
The relevant levels are the structural zones:
640 — current decision area
410–550 — structural / gap region
210 — major downside structural level
28–30 — deeper liquidity zone
1,200–1,500 — major expansion area
2,100+ — higher-timeframe expansion levels
The sequence matters more than the prediction.
Price will determine which structure remains valid.
Follow, Boost, Join, Thank You!
Financial Disclaimer: This post is not financial advice. I am not your financial advisor, your life coach, or your legally responsible adult. Always do your own research and never trade based solely on internet content. TQQQ: Descending Channel, Bearish Persists As of today September 6, 2026, ProShares UltraPro QQQ (TQQQ) is trading around $72.37, recovering slightly following recent market shifts driven by mixed U.S economic data, jobs reports affecting Federal Reserve rate cut expectations, and fluctuating Treasury yields.
Technical view:
TQQQ is positioned on a bearish pathway, trending partially on lower lows and highs for a few months now, in respect to the structure. The etf continues to range down, as sellers holds more momentum on the market. Price is around the trend resistance line, as we are expecting a short reverse.
Key point:
A confirmed pullback within $74-$75, triggers another sell position down to $66.23, as potential bearish low.
Thanks for reading.  Short
Short
 Long
Long
Short 
 Long
Long
Research 10.09.2026🌏 Markets:
AMEX:SPY -1.21 -0.16%(pre/m)
NASDAQ:QQQ -4.81 -0.67%(pre/m)
🆕 Economic News:
08:30 USA – Core PPI
10:00 USA – Existing Home Sales
12:00 USA – EIA Crude Oil/Gasoline Stocks Change
📈 Gap Ups
Reaction to earnings/guidance:
NASDAQ:AVAV
Other news:
NASDAQ:XNDU and NASDAQ:AMD launch Backline to streamline CPU, GPU, FPGA integration for quantum technology
JPMorgan upgraded NASDAQ:META to Overweight from Neutral in a note Thursday, saying the company's push into frontier artificial intelligence models and AI agents opens a new avenue for growth beyond advertising, raising price target for the stock to $820 from $640
NASDAQ:AAPL rising today after yesterday's lauch of new products.
📉 Gap Downs
Reaction to earnings/guidance:
NASDAQ:COO NYSE:AEO NASDAQ:NAVN $M
Other news:
FDA had imposed a partial clinical hold for NYSE:BHVN , pausing new patient enrollment in trials of its experimental epilepsy drug after rodent findings, sending its shares down more than 13% in premarket trading.
NYSE:HGTY announces pricing of upsized 9.25M share secondary offering at $11.95 per share
Copper related stocks are falling in symphaty to COO earnings: NYSE:TECK NYSE:FCX NYSE:SCCO NYSE:HBM ASX:BHP NYSE:RIO
NASDAQ:CRWV struggling to keep up with demand for Nvidia chips, CEO says
KOSPI Struggles to Hold 7,000 as Bank of Korea Flags Record Volatility: NASDAQ:SKHY
TSX:ENB has agreed to acquire the crude oil transportation business of US-based energy infrastructure company Tallgrass Energy in a cash transaction valued at $2.55bn
‼️ Additional
Trump said that if Republicans win the midterm elections, he would pay a $5,000 “dividend” to every adult US citizen.
-- There are currently around 245 million US citizens over the age of 18, meaning the payments would cost approximately $1.2 trillion.
-- Analysts note that this would be the largest economic stimulus payment program since the pandemic.
The yield on 10-year US Treasuries is approaching its highest level since before the 2008 global financial crisis.
Outflows from spot BTC ETFs have continued for a second consecutive day, although volumes remain small. BTC itself continues to consolidate within a narrow range. Markets are awaiting the Senate vote on the CLARITY Act scheduled for September 15 — monitoring data.
📋 List of tickers involved:
NASDAQ:AVAV NASDAQ:XNDU NASDAQ:AMD NASDAQ:META NASDAQ:AAPL NASDAQ:COO NYSE:AEO NASDAQ:NAVN $M NYSE:BHVN NYSE:HGTY NYSE:TECK NYSE:FCX NYSE:SCCO NYSE:HBM ASX:BHP NYSE:RIO NASDAQ:CRWV NASDAQ:SKHY TSX:ENB CRYPTOCAP:BTC
Best regards – hi2morrow team.
SPY Is Sitting On 762.57 After Losing 765.52.SPY Is Sitting On 762.57 After Losing 765.52.
SPY broke the two-week range yesterday on a decisive close below 765.52 and has spent the overnight session sitting on 762.57, the shelf directly beneath it, with 759.13 as the range low underneath. The two timeframes disagree: the 4H reads impulse continuation lower with a neutral Q2 surface, while the 1H has flipped back to a Q1 long print with a live CQI near 70 - a bounce-back surface against a broken structure, not agreement. Hourly volatility is compressed to the 1st percentile of its range and volume is in the 19th, which is what a market waiting on an 08:30 print looks like rather than a market with a direction. Neutral.
Resistance: 765.52 - the level it broke, the reclaim test
Key resistance: 771.43 - the range mid it lost
Current price: 762.66
Support: 762.57 - the shelf it is sitting on
Key support: 759.13 - the range low
Structural floor: 753.22 - deeper support
Two paths from here:
It loses 762.57 and the range low comes into play. A close below the shelf opens 759.13 directly, and below that the structure has no named level until 753.22. That is the path the 4H has been describing since the break.
It reclaims 765.52 and the break fails. A decisive close back above the level puts 771.43 back in reach and turns the whole two-week break into a failed one. Anything less than a held close above 765.52 is just the retest of a level it already lost.
The chart is compressed into a scheduled data print, so today's direction gets decided by the reaction rather than by the levels. 765.52 to undo it, 762.57 to continue it.
Built with SYNTHESIS v3.3 | SOM / ACE / IMP / SYNTHESIS
Study, not financial advice.  Long
Long
Long 
Long 
Long 
SPY: PPI & CPI Roadmap — Numbers to Watch, What I Expect, and HoSPY has spent the last couple sessions looking exactly like what it probably is: a market waiting on inflation data.
To me, this chart is less about trying to predict every tick and more about mapping out the most likely reaction zones depending on how PPI and CPI come in.
Big picture
The market is now heading into two major inflation reports:
PPI first
CPI second
That matters because PPI can shape the tone first, but CPI is usually the report that carries more weight for equities.
Also important: these are not the only possible outcomes.
We could absolutely get:
a positive reaction to PPI and then a negative reaction to CPI
a negative reaction to PPI and then a positive reaction to CPI
a muted reaction to one and a major reaction to the other
or both numbers land close enough to expectations that the market stays messy and rotational
So this is a scenario map, not a prediction map.
What the market is watching
PPI
For PPI, the market will be focused on whether producer-side inflation starts reaccelerating or stays contained.
What I’m watching most:
Headline PPI m/m
Core PPI m/m
Any meaningful revision
Whether higher energy prices are showing up in a way that could spill into CPI later
My view is that headline PPI has upside risk because energy has clearly become a factor again.
If PPI comes in soft anyway, that would probably be taken as a relief signal.
CPI
For CPI, I care about core more than headline.
Headline can get pushed around by energy, and with oil back in focus, that can distort the first read.
But core CPI tells us more about whether inflation is actually cooling underneath the surface.
What I’m watching most:
Headline CPI m/m
Core CPI m/m
Shelter/services pressure
Whether the report confirms disinflation or reintroduces rate fear
If CPI comes in clearly cooler than expected, the market likely treats that as a green light.
If it comes in hotter, especially on core, that probably puts pressure back on equities fast.
What I expect
My base case right now is:
the market remains mostly flat / semi-flat into the data
we get more reaction trading than clean trend trading
headline numbers may have some upside risk
core numbers matter more
the first move after the release may not be the final move
In other words, I’m not interested in pretending I know the print.
I’m more interested in being prepared for how price reacts once the numbers hit.
A true strong upside squeeze probably needs the market to read the data as clearly disinflationary, especially on core — not just “good enough.”
Scenario map
1. Much cooler than expected
If PPI and/or CPI come in much cooler than expected, that is the most bullish scenario on this chart.
That is where I would expect:
a strong upside reaction
fast reclaim of higher levels
momentum names and index calls getting aggressive follow-through
the possibility of a larger squeeze instead of just a relief bounce
How I’d trade it
I would still avoid blindly chasing the first candle.
Best case is:
strong reaction
brief pullback / retest
hold above reclaimed structure
then continuation
That is the kind of move where I’d look for calls, but only if price confirms.
2. Cooler than expected, but not a huge miss
This is still bullish, just less explosive.
I would expect:
a positive reaction
less conviction
more chance of chop after the initial move
resistance still mattering
How I’d trade it
I’d want to see price accept above resistance, not just spike into it.
If it reclaims and holds, I’d look long.
If it pops and stalls, I’d be careful about chasing.
3. Roughly in line with expectations
This is the scenario where traders can get chopped up the most.
If the data is close enough to expectations, the market may not get the clean catalyst people are hoping for.
That can create:
fake moves
back-and-forth price action
failed breaks
a day where doing less is the right answer
How I’d trade it
Very selectively.
If price stays inside the mapped range and can’t build structure, I’d be perfectly fine with no trade.
Sometimes the best trade is acknowledging there isn’t a clean one.
4. Hotter than expected
If PPI and/or CPI come in hot, especially on the core side, this is the bearish scenario.
That would likely bring:
pressure on equities
renewed rate fears
weaker sentiment
downside continuation if support starts failing
How I’d trade it
I would not just smash puts into the first flush.
I’d rather see:
the initial downside reaction
a weak bounce
failure to reclaim lost structure
then continuation lower
That is where I’d be more comfortable looking for puts.
5. Split outcome scenarios
This part is important.
A lot of people act like the only possibilities are:
both bullish
or both bearish
That’s not how markets always work.
We could get:
soft PPI, hot CPI
hot PPI, soft CPI
strong initial move on one report and a complete reversal on the next
That’s why I’m not treating this chart like a single straight-line forecast.
It’s a framework.
If PPI gets a bullish reaction but CPI reverses it, then Friday becomes the real decision point.
If PPI is hot but CPI cools things back down, the market may completely reprice the week.
How I plan to trade it
My plan is simple:
No prediction worship
No blind pre-positioning
No forcing trades
Let the market show its hand first
What I want is:
the data
the reaction
the retest or failure
then the trade
If price confirms bullish acceptance, I can look for calls.
If price confirms bearish rejection, I can look for puts.
If it stays sloppy, I do nothing.
That is the entire point of preparation.
Final thought
This chart is not saying “this is exactly what will happen.”
It is saying:
if this happens, here is what I expect the market to care about
and here is how I would respond.
That’s the difference between preparation and prediction.
Preparation > Prediction $GLD Daily Close — Sep 9AMEX:GLD Daily Close — Sep 9
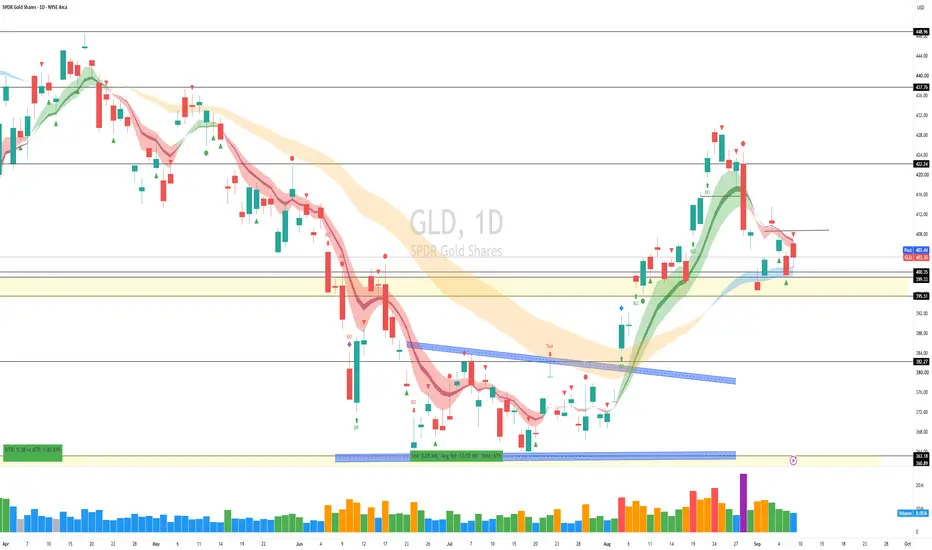
The level held. This was the point I made in yesterday's summary, and I added long from there.
Where it held is worth being precise about. Yesterday's close was 399.72 — actually just under the round number. What held was 399.33: the Key Level, and the lower edge of the MTF cloud (@ripster47 EMA cloud) sitting right on top of it. Three reasons stacked in one point. Today the 400 psych number held properly, with a 401.18 low.
One correction on my own wording from yesterday: I called it a big wide-spread candle. Checking the chart, the range was 4.80 against a 7.90 ATR — 61% of a normal day. Below average. I'll flag that because it changes the read: a genuinely wide-spread down bar on low volume is a bullish sign, sellers stepping back. A narrow one closing on its low is much weaker. Yesterday was the second one.
Today the market opened with a gap up — and got rejected right at the 5-12 @ripster47 EMA cloud. High of 406.56, straight into the underside of the cloud, then faded to close 403.35, giving back 60% of the day's range.
That rejection came on 8.04M shares against a 12.02M average — 67% relative volume, below average and below yesterday. Up bar, low volume, close in the lower half, into resistance. That's No Demand. Price went up because nobody was selling, not because anybody was buying.
Zoom out on the volume and it's the real story: 9.82M, then 8.68M, then 8.04M. Three days of it drying up. Sellers aren't pressing 400 and buyers aren't taking 407. Both sides are out. Compression like that resolves with an expansion, and until the volume shows up the direction isn't in the tape.
So on my long — I'm in it, and I'll be straight about what it is. This is an MTF Cloud Bounce (@ripster47 EMA cloud) at a stacked level, and it is unconfirmed. My own rule is a Bounce wants Stopping Volume or a hammer to confirm it, and we got neither. The level is holding on an absence of sellers, not a presence of buyers. That's a real distinction and it's why the trade is sized off a defined stop rather than conviction.
No shorts here. I'm looking for longs as long as 400 holds. The confirmation is a 5-12 Curl (@ripster47 EMA cloud) — a close back above the cloud on volume above 12.02M. That's what opens 415 and then 420, where the options flow is sitting. A curl on 8M shares isn't a curl, it's drift.
Trigger: reclaim of the 5-12 cloud. Invalidation: 399.33. Below 395.51 and the whole bias flips. $SPY Daily Close — Sep 9, 2026AMEX:SPY Daily Close — Sep 9, 2026
AMEX:SPY held the previous breakout area on low volume. Price dipped to 760.94, right on the 760.57 shelf, and closed back up at 762.40 — 1.46 off the low.
I want to be precise about what that is, because it matters for how you trade it. This closed red, with a lower high, a lower low, and a lower close than yesterday. So it's a hold of support, not a bounce yet. The bounce is still the thing we're waiting for.
The volume tells the real story. 32.08M against a 36.6M average — 88% relative volume, lower than yesterday. Range was 3.53 against a 6.06 ATR, only 58% of a normal day and the narrowest bar of this entire sequence.
Narrow spread down bar on falling volume into support. That's No Supply. Sellers are not committing here.
Look at the last four sessions: three of them red, and not one brought volume. Ranges compressing, volume declining, price drifting lower. This isn't distribution. It's drift. Nobody is selling with size and nobody is buying with size either.
It's shaping up as a test, but I won't call it confirmed until we get an up bar closing strong. Today's close came in at 41% of the range — just below mid. A proper test closes in the upper third.
What I'm watching: I'll consider longs over 764.50, which is today's high. But understand that's the aggressive add — the 5-12 Curl (@ripster47 EMA cloud) around 766–767 is the confirm long signal. Two different levels, two different levels of conviction.
On either one, I want volume above 36.6M. Six sessions and only one has come in above average. A move over 764.50 on another 32M day is No Demand, and this is exactly the environment where that trap lives.
No short as long as the market holds the 760–757 area. That floor has now been probed twice in two sessions on light volume and hasn't broken. If it goes, I need the range expanding and volume above average — then 756.70 and 750 come into play.
Until then, flat and waiting. $QQQ Daily Close — Sep 9NASDAQ:QQQ Daily Close — Sep 9
Choppy price action. NASDAQ:QQQ closed 716.35, down 0.28%, and the previous day low at 715.57 broke — low of 714.02 — before price closed back above it.
The good thing: the market is still holding the @ripster47 5-12 EMA cloud. That level has now been defended two sessions running.
On today's candle
Volume was low again — 25.61M against a 30.9M average, 83% relative volume. And the bar itself: price pushed to 719.70 and gave the whole move back to close at the open. That advance had no volume behind it and produced nothing.
Range 5.68 against an 8.97 ATR — 63% of a normal day. Close finished below the middle of the bar.
Here's the read. Sellers took out the previous day low and couldn't generate any volume behind it, so supply didn't show up at the break. But buyers didn't show up either — that push to 719.70 died on nothing. Both sides are absent.
The pattern worth seeing
Volume this week: 34.3M, 23.4M, 28.9M, 32.8M, 22.9M, 25.6M — against a 30.9M average. The only above-average day was last Friday, and that was the profit-taking bar. Every up bar in this entire move has come on below-average volume.
Meanwhile the highs keep stepping down: 721.86, then 721.89, then 719.70 today. Closes too.
Price is leaking lower each session with nobody behind it in either direction. That's a range compressing, not a trend. Compressed ranges resolve — they just don't tell you which way in advance.
My trades and my levels
My trades went well in the morning. I added long over the Daily 20-21 MTF @ripster47 EMA cloud.
The @ripster47 5-12 EMA cloud is the risk now — price is sitting right on it. For a confirmed long, the market needs to move above today's high at 719.70, and I want volume back above 30M when it does. Without the volume it's just the seventh light up bar in a row.
One mechanical note that mattered today. Price wicked below the 5-12 cloud and closed back above it. My exit rule is a 5-12 Break on a closing basis, not an intraday tag. If your stop was sitting inside the wick you got taken out of a position that's still valid. The rule exists for exactly this bar.
Below the cloud on a close and this becomes a 5-12 Break, which opens the @ripster47 34-50 EMA cloud at 710–715.
Targets unchanged: 724.20, then 730, then the all-time high at 748.65.