 Long
Long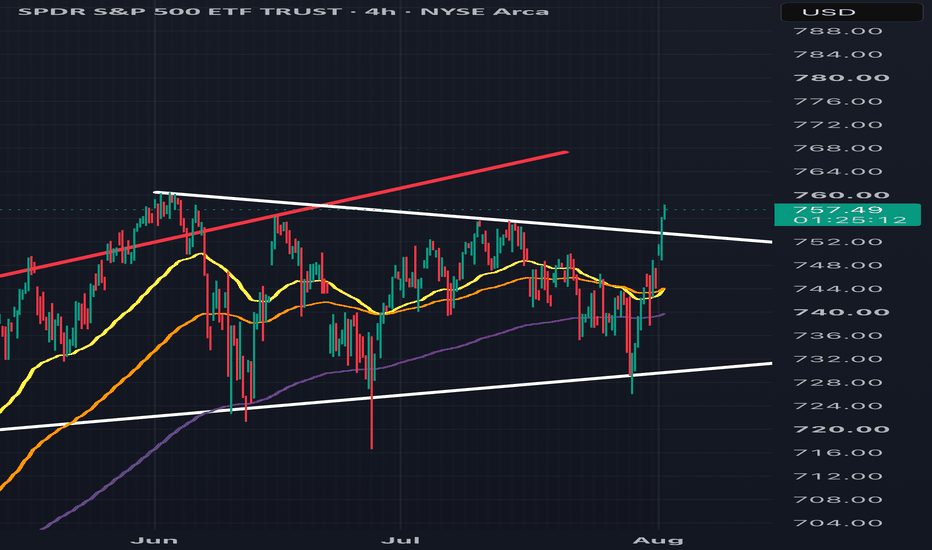
Diamond Top, Trendline Test: QQQ's Make-or-Break MomentQQQ ran in a powerful, clean uptrend from the April low near 558 to a peak just above 745 in mid-July — essentially an uninterrupted V-recovery with barely a pause until price reached the low-700s. That's the move captured by the yellow trendline.
The diamond top: Once price hit the 700-745 zone, it stopped trending and rotated into a diamond formation — price action first widening (higher highs, lower lows) then compressing back to a point. Diamonds that form after an extended advance are classic distribution/reversal patterns, and that's exactly what played out here: price broke down out of the bottom of the diamond through 709.80 and kept sliding.
The decline and basing attempts: After the diamond broke down, QQQ fell in a stairstep fashion through 701.27, 695.25, 684.56, and 679.35, pausing briefly to carve small rounding-bottom (cup) formations around 684 and again near 656.13 — these look like short-term basing/accumulation attempts rather than full reversals, since each one gave way to another leg lower. The decline found its low in the 670-675 area before the latest bounce.
Where it stands now: Price has bounced off the low-670s and is pushing back up into the 684-690 zone, right into the descending dashed trendline drawn from the July high. That trendline plus the 684.56 / 690 zone is the key battleground — it's both a former support level (now acting as resistance) and the trendline confluence point.
Bullish scenario: A close back above the descending trendline and 684.56-690 would suggest the correction is over and the basing pattern is complete. Next targets would be 695.25, then 701.27, then the more significant 709.80 (the diamond's broken support, now resistance). A clean push through that reclaims 718.68 and then 726.27, opening the door to retest the 745 diamond high and potentially new highs — this is the path the drawn projection arrow implies.
Bearish scenario: Rejection at the trendline/684 zone keeps QQQ capped, and a failure to hold 679.35/675.78 would put the 656.13 low back in play. Below that, the diamond's measured move (roughly the ~55-point height of the pattern projected from the breakdown point) points toward the 642.18 level — notably the same zone marked in blue as a prior major breakout point from the April rally, so it would be a logical place for buyers to reappear if the decline extends.
Net read: This looks like a healthy-but-real correction after a distribution top, currently testing trendline resistance. Momentum traders would want to see a decisive break of the trendline with volume before treating 709+ as achievable; a rejection here keeps 656 and potentially 642 on the table.
I'm not a financial advisor, so treat this as a technical read of the chart pattern rather than a trade recommendation — worth confirming with volume, broader market context (SPY, sector breadth), and your own risk parameters before acting on it.  Long
Long
QQQ: Next weekHappy August everyone,
Summer is here, unfortunately its been a terrible one for our European friends :S.
Looking at QQQ for next week, since this is a major week for tech earnings. We have some big earning names for tech, specifically:
NASDAQ:AMD reporting after hours on Tuesday
NASDAQ:SNDK NASDAQ:WDC and NASDAQ:APP reporting after hours on Wednesday
Some other ones but ones that don't directly impact QQQ. Others that I am watching personally are NYSE:DIS NASDAQ:AXON and $OKLO.
So what are expectations?
QQQ has pulled back around 10.5% thus far. Consulting my LLM on the current state of Analyst opinions, which I always take with a grain of salt but like seeing the general theme touted by these big firms, is this:
The analyst community is currently split into two main camps, though both remain generally optimistic about the long-term trajectory:
1. The "Buy the Dip" Camp (Goldman Sachs & Zacks)
John Flood at Goldman Sachs remains firmly in the "buy the dip" mode. He views the recent volatility not as a trend reversal, but as a result of massive capital reallocation. He points out that despite record-breaking trading volumes (34 billion shares in a single day recently), the market is absorbing new supply—like the $140 billion in recent IPOs—remarkably well. His team believes that as long as earnings continue to deliver, the logic for the S&P 500 (ES1!) to challenge the 8,000 level remains intact.
2. The "Rotation & Risk" Camp (Yardeni & Pluang)
Yardeni QuickTakes and Pluang are a bit more cautious regarding the "hyperscalers." The concern is that analysts may have set the bar too high, entering the realm of "irrational exuberance." They warn that if these tech giants don't beat these "heady" expectations, we could see a deeper correction in the Nasdaq-100 (NQ1!). However, they expect this to manifest as a sector rotation—where money moves out of overextended semiconductors and into undervalued software, financials, or industrials—rather than a total market collapse.
In my last SPY Idea I shared the annual path, where FOMC was the last day of a stark decline prior to turning back up. This actually played out pretty perfectly, but unfortunately there is one more decline to be head (albeit not as steep) prior to grinding back up. Which technically falls into next week.
QQQ is poised to make a retracement to 697 by Thursday.
The bigger question is the magnitude of upside vs downside next week with such major catalysts.
To answer this question, we should look to the earnings likely to impact QQQ the most, those being SNDK, WDC, APP and likely PLTR (releasing Monday after hours).
Thankfully, I have an earnings assessment function that can help give us some guidance on expectations.
PLTR
Assessment: Bullish the day after release with a 68% probability and beating the naive baseline by 20% (naive baseline = guessing on a coin flip).
My AI's position:
Palantir is no longer being viewed by Wall Street as just a software company; it is increasingly treated as a foundational AI infrastructure provider. They are scheduled to report on August 3, 2026, and the momentum heading into this release is significant.
Earnings Expectations: Analysts are looking for an EPS of $0.35, which represents a staggering 118.8% increase over the $0.16 reported in the same quarter last year.
Revenue Forecast: Consensus sits at $1.81 billion, an 81% year-over-year surge.
Analyst Sentiment: The sentiment is overwhelmingly positive. Over the last 60 days, there have been 11 upward earnings revisions and zero downward revisions. Most analysts (33 in total) maintain a "Buy" trend, with Palantir currently holding a Zacks Rank #2 (Buy).
Key Metrics to Watch: Keep a close eye on their Rule of 40 score, which recently hit an extraordinary 145%. Analysts are also focused on the U.S. commercial revenue, which has been growing at triple digits as enterprises move from AI experimentation to full-scale production.
Market Note: While retail sentiment on Stocktwits has flipped to "extremely bullish," note that Michael Burry recently disclosed a fresh short position, citing stretched tech valuations. However, the "buy the dip" mentality remains strong among the retail base.
AMD
This one is a bit of a wild card:
Assessment: Results are conflicting, one model which beats baseline by 12.5% assigns a bullish probability of 50%. The other, with the same baseline beat rate, sasigns a bullish probability of 93.2%, both indicating that the bullishness is likely to fade in either case after the initial release date, which is evidently slightly a concern.
Magnitude: A modest +/- 4%, however hte magnitude are always under-estimates usually. An interesting tidbit is that AMD's EPS estimate is beyond their historic estimates, meaning they are pricing in an earnings growth that they have never seen before.
My AI's position based on analyst ratings:
Here is the quantitative breakdown and sentiment analysis based on the latest intelligence for August 2026.
AMD (Advanced Micro Devices)
Earnings Date: August 4, 2026
Q2 2026 Expectations:
Revenue Forecast: ~$11.28 billion to $11.3 billion (representing ~47% YoY growth).
Earnings Per Share (EPS): Analysts are targeting $1.55 (a massive jump from $0.48 in the prior year).
Key Growth Driver: The Data Center segment remains the primary engine, having surged 57% to $5.8 billion in Q1. Investors are laser-focused on the ramp-up of the MI450 Series AI GPUs and the Helios rack-scale platforms.
AMD is currently in a "show me" phase. While the stock has seen a spectacular 130% rise year-to-date, it is trading at a premium valuation of approximately 75x forward earnings for 2026. To maintain this momentum, AMD likely needs to not only beat these estimates but also raise its full-year guidance. While some technical analysts warn of a potential correction toward $300 if momentum stalls, the fundamental "Wall Street" consensus remains highly optimistic, with price targets ranging from $500 to as high as $665 from firms like Barclays and Mizuho.
SNDK
Earning history is too short for full baseline assessment, but the assigned outcome is Bearish by 50%, this is equivalent to a coin flip however, so take this with a grain of salt.
Magnitude: Too short history. Their EPS estimate is also beyond anything they have reported before which was the case with their last earnings. Their last earnings rallied, putting this regime at 100% bullish; albeit with an n = 1 (so 1 case lmfao, highly ungeneralizable so don't trust this).
My ai's position based on analyst insights:
Earnings Date: August 5, 2026
Q4 2026 Expectations:
Revenue Forecast: Management guidance sits between $7.75 billion and $8.25 billion.
Earnings Per Share (EPS): The Zacks Consensus Estimate is pegged at $33.28, while management’s internal forecast is $30 to $33. This represents a staggering year-over-year surge compared to the $0.29 reported in the same quarter last year.
Valuation: Following a recent 45% pullback from its highs, SNDK is trading at a remarkably low 5.9x forward earnings.
SNDK presents a compelling "value-growth" opportunity. The market appears to have over-corrected on concerns regarding NAND pricing, overlooking the $42 billion in minimum revenue commitments SNDK has secured through its new long-term supply agreements. With an Earnings ESP of +4.13%, the data suggests a high probability of an earnings beat. This report could be the catalyst needed to bridge the gap between its current "discounted" share price and its robust fundamental growth.
WDC
Assessment: Bullish with 52.5% probability, being faded after initial day of release flipping bearish.
Magnitude: Modest return with 58% of their EPS estimates in their current range being a bullish outcome.
My ai's position based on Analyst insights:
The consensus for the quarter ending June 2026 reflects a massive growth trajectory:
Earnings Per Share (EPS): Analysts are looking for $3.35, which represents a staggering 101.8% increase year-over-year.
Revenue: Expected to hit $3.7 billion, up 42.2% from the same period last year.
Management Guidance: WDC’s own guidance for this quarter was slightly more conservative, ranging between $3.10 and $3.40, suggesting that analysts are leaning toward the top end of the company's expectations.
Analyst Sentiment and Price Targets
The mood on the Street is decidedly optimistic, with several major firms recently aggressive in their upward revisions:
JPMorgan & Morgan Stanley: Both firms recently hiked their price targets to $650, maintaining "Overweight" ratings. Morgan Stanley has even named WDC one of its “most-favored” picks, citing a structural supply deficit in the hard disk drive (HDD) market.
Top-Tier Targets: We are seeing some very bold calls, including Cantor Fitzgerald at $900 and BofA Securities at $732.
The "AI Supercycle" Narrative: Analysts are no longer viewing WDC as a purely cyclical play.
The consensus is that AI-driven demand for high-capacity storage is creating a "more permanent" re-rating of the stock.
APP
Unfortunately can't comment about this as the model fails to beat the baseline naive rate, so giving you the data is worse than taking a guess lol.
MY AI's position:
AppLovin has been one of the standout performers in the mobile tech space, and they are expected to report their results on August 5, 2026. After "crushing" their previous Q4 results, the bar has been set even higher for this quarter.
Earnings Expectations: The market expects an EPS of $3.72, a massive 64.6% increase year-over-year.
Revenue Forecast: Analysts are targeting $1.94 billion, up 54% from the year-ago quarter.
Analyst Sentiment: Out of 32 analysts, the majority support a "Buy" trend. While the consensus EPS estimate was nudged slightly lower (0.18%) in the last 30 days, this is viewed more as a minor recalibration than a shift in the bullish thesis.
Retail Perspective: Retail investors have been aggressively loading up on any price dips, with some Stocktwits users setting price targets in the high-$500 range. The sentiment remains bullish as the company continues to outpace the revenue growth of much larger tech peers.
Operational Context: The recent retraction of fraud allegations by CapitalWatch has removed a significant cloud of uncertainty, allowing the market to focus purely on APP's fundamental growth and its AI-driven advertising efficiency.
So where does this leave QQQ?
Volatile as usual. Expectations based on earnings and QQQ's own forecast is mostly whipsaw with a bullish tilt. The immediate target to watch is that 697 upside target, with a good chance of seeing some downside before or after this target is reached. But it should be reached by Thursday.
The ranges are posted in the chart for the week. We start a new month into Monday which presents new ranges and high probability targets. But as of now, this is my outlook for QQQ.
Overall verdict: Bullish till min 697.
Trend probability: Very low, most likely a lot of rip fading, dip buying leading to whipsaw and most moves occuring after hours.
Good luck and safe trades everyone!
Resrarch 03.08.2026🌏 Markets:
AMEX:SPY +3.44 0.46%(pre/m)
NASDAQ:QQQ +0.96 0.14%(pre/m)
🆕 Economic News:
Dow, S&P 500, Nasdaq futures rise as Trump calls off Iran attack
10:00 USA – ISM Manufacturing PMI
📈 Gap Ups
Reaction to earnings/guidance:
NYSE:ATKR NASDAQ:SUPN NYSE:CNH NASDAQ:INDV NASDAQ:MMYT NASDAQ:LIND $L NYSE:HESM
Other news:
NYSE:FERG on strong construction demand and infrastructure spending optimism.
NYSE:AMC Shatters Weekend Revenue Records - Sets the Highest Weekend Revenue Mark in the Company's 106-Year History
NYSE:BABA launched its biggest AI model yet, claiming it rivals Anthropic's best
Goldman Sachs reshuffled its U.S. Conviction List in its August update, adding Microsoft NASDAQ:MSFT and five other names ( NASDAQ:AMAT NYSE:DAL NYSE:VIK NASDAQ:ORLY NYSE:UPS ) while removing Broadcom NASDAQ:AVGO and three others ( NYSE:DKS NYSE:JNJ NYSE:NOW ).
NASDAQ:LNTH Announces Definitive Agreement to Merge with Lantheus
NYSE:KKR to Buy NYSE:ITGR for $4.3 Billion
NASDAQ:META Scales Back Wipro Outsourcing Following AI-Led Business Restructuring
Roth Capital and Morgan Stanley raised their Amazon NASDAQ:AMZN price targets, citing strong AI investment returns and improving AWS profit.
📉 Gap Downs
Reaction to earnings/guidance:
NASDAQ:SRAD NASDAQ:TWST NASDAQ:TGTX NYSE:TSN NASDAQ:MAR NYSE:AVA
Other news:
NYSE:GME : company said it has agreed to exchange about $1.4 billion of its outstanding convertible senior notes for shares of its Class A common stock in a private transaction. This move will significantly reduce its long-term debt but also increase its outstanding share count.
NYSE:CRCL Leads Crypto Stocks Lower After Morgan Stanley Downgrade Adds To Bitcoin, CLARITY Act Pressure / NYSE:BMNR NASDAQ:COIN
LSE:AZN shares slide 7% on talks to buy NYSE:BMY
Memory sector plunges on SK Hynix NASDAQ:SKHY , Samsung’s $1.3T Spending Worries US Chipmakers / NASDAQ:MU NASDAQ:SNDK NASDAQ:WDC NASDAQ:STX
NYSE:BE Sued for Securities Law Violations
‼️ Additional
Trump announced talks with Iran on Monday.
-- Trump said the US and Iran had reached understandings on the Strait of Hormuz and that he also expects a deal on the nuclear program.
-- Following Trump’s statement that talks with Iran are beginning today, Iran’s Foreign Ministry said it does not plan “in these days” to host a delegation or send an Iranian delegation for talks with the US.
The US Senate has 72 hours left to vote on the CLARITY Act crypto market structure bill before lawmakers leave for the summer recess.
Goldman Sachs warns that reducing the length of FOMC commentary and the number of FOMC meetings, as proposed by new Fed Chair Warsh, could lead to pricing errors and increase market volatility.
📋 List of tickers involved:
NYSE:ATKR NASDAQ:SUPN NYSE:CNH NASDAQ:INDV NASDAQ:MMYT NASDAQ:LIND $L NYSE:HESM NYSE:FERG NYSE:AMC NYSE:BABA NASDAQ:MSFT NASDAQ:AMAT NYSE:DAL NYSE:VIK NASDAQ:ORLY NYSE:UPS NASDAQ:AVGO NYSE:DKS NYSE:JNJ NYSE:NOW NASDAQ:LNTH NYSE:KKR NYSE:ITGR NASDAQ:META NASDAQ:AMZN NASDAQ:SRAD NASDAQ:TWST NASDAQ:TGTX NYSE:TSN NASDAQ:MAR NYSE:AVA NYSE:GME NYSE:CRCL NYSE:BMNR NASDAQ:COIN LSE:AZN NYSE:BMY NASDAQ:SKHY NASDAQ:MU NASDAQ:SNDK NASDAQ:WDC NASDAQ:STX NYSE:BE
Best regards – hi2morrow team.
SPY Finally Broke 748 - But The Surface Disagrees.SPY Finally Broke 748 - But The Surface Disagrees.
After seven rejections, SPY finally pushed through 748 and is trading 750.94, with the two-week ceiling cleared. That is the break we have watched for all along. The catch matters: the break is happening on a bottom-quartile conviction surface, with the hourly thesis actually reading short and the entry signal still on wait. Price cleared the level, but the conviction engine has not confirmed it - the exact divergence that has trapped breaks all month. A real break that the surface does not yet believe. Neutral, watching whether it holds.
Resistance: 753.22 - first level overhead
Key resistance: 755.66 - the prior high
Current price: 750.94
Support: 748.00 - the broken ceiling, now support to hold
Key support: 740.44 - the range floor
Structural floor: 736.87 - deeper support
Two paths from here:
748 holds as support and the surface catches up. If SPY holds above 748 and the conviction surface rotates up to confirm, the two-week range resolves up and 753 then 755.66 open. A break that holds and earns confirmation is the real thing.
The break fails back below 748. A breakout on bottom-quartile conviction with a short-reading surface is the classic trap setup. A loss of 748 back into the range would make this the eighth failure - the cruelest one, a false break. The surface disagreement is the warning.
SPY did the thing it could not do seven times and broke 748 - but it broke with the conviction surface pointing the other way. That divergence is exactly what has trapped breaks all month, so the honest read is to watch whether 748 holds as support before trusting it, not to chase the break.
Built with SYNTHESIS v3.3 | SOM / ACE / IMP / SYNTHESIS
Study, not financial advice.  Short
Short
SPY: Bearish structure. Neutral tape. Those are two different si⚖ 𝗦𝗣𝗬 | 𝗧𝗵𝘂 𝟳/𝟯𝟬/𝟮𝟲, 𝟳:𝟮𝟰𝗔𝗠 𝗣𝗧 | 𝟭𝟱𝗠
Bearish structure. Neutral tape. Those are two different signals.
🪨 𝗦𝗧𝗥𝗨𝗖𝗧𝗨𝗥𝗘
Fib anchored 754.58 high (7/15) to 729.10 low (7/29). AMEX:SPY 737.93 is stalled at the 0.618 line (738.83), which is only a 38.2% retracement of the decline. Shallow retrace, weak buyers. Descending trendline off the July high still unbroken near 752. Lower highs intact.
🧭 𝗠𝗔𝗖𝗥𝗢
Fed held rates with three dissents in favor of a HIKE. 30Y above 5.2%, highest since 2007. Oil bid on renewed strikes. SPCFD:SPX closed 7,316.15 Wednesday, off 1.52%. Today's bounce is NASDAQ:MSFT and semis, not breadth. NASDAQ:AMZN and NASDAQ:AAPL print after the close.
📊 𝗧𝗛𝗘 𝗧𝗔𝗣𝗘 (𝗼𝗽𝘁𝗶𝗼𝗻𝘀 𝗳𝗹𝗼𝘄, 𝟮 𝘀𝗲𝘀𝘀𝗶𝗼𝗻𝘀)
▪ $468M SPY premium. Put premium 2.2x call premium.
▪ Net directional +$34M BULLISH. Bull share 53.7%. Aggressive orders 54.4%. Prints over $1M, 57.6% bullish.
▪ Today: Aug 21 725P and Sep 670P sold in size. Aug 21 702P and 720P bought. That is a hedge roll down and out, not a directional short.
▪ Only genuinely new size on the tape: Aug 21 702P, 7,000 lots lifted above ask, volume above open interest. Someone is paying for sub 710 by 8/21.
▪ Jun 2027 730C and Mar 2027 725C bought at ask. Structural longs adding on the dip.
▪ Front IV 27.7 vs 16.3 in the 10 to 45 day bucket. Event premium is rich and about to reset.
⚔ 𝗟𝗘𝗩𝗘𝗟𝗦
Supply: 738.83 / 740.79 / 741.84 / 743.18
Invalidation: 15m close above 744.84, then 746.70 opens the trendline near 752
Support: 736.69 / 734.55 / 732.00 / 729.10
Extension (only if 729.10 closes broken): 723.09 / 719.37 / 716.37 / 713.36 / 709.08
🛡 𝗧𝗛𝗘 𝗧𝗥𝗔𝗗𝗘
Short 741.00 to 743.20 on rejection, stop 746.75. T1 736.69, T2 732.00, T3 729.10. That is roughly 2.0R to 3.4R. Selling 737.93 in the middle of a 729 to 743 range is a coin flip, not a setup. The 713 leg is a second trade, triggered only by a 15m close under 729.10 and a failed retest.
🪞 𝗧𝗛𝗘 𝗥𝗘𝗔𝗗
The direction is defensible. The timeline on the chart is not. Structure says down. Positioning says balanced and hedged, which produces chop with a downward drift, not an impulse. The one desk paying up for downside is targeting 702 by August 21, not 713 by August 6. Trade the level, not the arrow.
NFA. Process over prediction. Risk-first, always.
#wavervanir #volanx #optionsflow #spy #0dte Short 

Short 
Short 
Updated SPY | SPX Strategy/Outlook | FED Special (29 JUL)Updated SPY | SPX Strategy/Outlook
Market Update | Fed Special
Markets are entering one of the highest uncertainty events of the year.
The renewed US-Iran conflict, the disruption of shipping through the Bab el-Mandeb Strait that has pushed oil prices sharply higher, and China's rapid progress in domestic semiconductor manufacturing have created a challenging backdrop for global risk assets.
With tonight's FOMC rate decision approaching, uncertainty has reached extreme levels. Although the market still expects rates to remain unchanged, the probability of a surprise hawkish outcome remains elevated, and more importantly, the tone of Chair Powell and Kevin Warsh's comments will likely determine the market's medium-term direction.
Risk Index
The Risk Index continues to price in short-term downside risk.
The long-term model remains firmly risk on.
However, both the short and medium-term models continue to warn that a sharp downside flush remains a realistic possibility.
Until market conditions improve, risk management should remain the primary focus.
SPY | SPX Strategy / Outlook
Before discussing today's trade setups, I want to emphasize one point.
I do not recommend initiating new positions ahead of tonight's FOMC rate decision.
The unnecessary volatility surrounding the announcement creates poor risk-to-reward conditions, even when technical setups appear attractive.
The trading plans below are intended to be executed only after the Fed decision, once volatility begins to normalize and price confirms direction.
Long Scenario 1
KEY Level 1 (738.5)
This is the first major demand zone. If price reclaims this level with a confirmed 1-hour bullish candle close, long exposure can be considered.
Trigger: Price must test the level and produce a bullish 1-hour candle close back above the zone.
Targets: Take partial profits after every $1 advance.
Invalidation: 1-hour candle close below 734.
Long Scenario 2
KEY Level 2 (723)
This is the second major demand zone. If price reclaims this level with a confirmed 1-hour bullish candle close, long exposure can be considered.
Trigger: Price must test the level and produce a bullish 1-hour candle close back above the zone.
Targets: Take partial profits after every $1 advance.
Invalidation: 4-hour candle close below 718.
Short Scenario 1
Main Supply (747)
This area represents the primary supply zone and the upper boundary of the current trading range. A confirmed rejection from this level could provide a tactical short opportunity.
Trigger: Retest of the zone followed by a 1-hour bearish rejection candle.
Targets: Take partial profits after every $1 decline.
Invalidation: 4-hour candle close above 750.
Short Scenario 2
Breakdown Below Key Level 1 (734)
If price breaks impulsively below the lower boundary of Key Level 1 at 734 and confirms the move with a 1-hour candle close, short exposure can be considered.
Trigger: An impulsive breakdown below 734, followed by a retest and a confirmed 1-hour bearish rejection candle.
Targets: Take partial profits after every $1 decline.
Invalidation: 1-hour candle close above 739.
Position Management Rules
1. Entry model: 1-hour candle close above or below the designated level.
2. Take profits in stages because market reversals can happen quickly.
3. After the first profit target is reached, move all remaining stop losses to breakeven and convert the position into a risk-free trade.
4. A reaction from the level must be confirmed. We do not predict price. We react to price.
5. Invalidation levels are unique to each scenario. Read them carefully.
6. Charts use RTH (Regular Trading Hours). ETH can provide incorrect candle confirmation.
Notice: Starting a fresh, fully transparent track record for SPY, QQQ, and core equities here on TradingView. Going forward, all daily market updates, tactical SPY/SPX - QQQ outlooks, institutional research, weekly outlooks, and mid week market updates will be documented and tracked consistently.
This analysis is for educational purposes only and reflects my personal opinion. It is not financial advice.
QQQ / NDX Weekly Outlook – Week 30 of 2026 (27-31 JUL)QQQ / NDX WEEKLY MARKET OUTLOOK
UA CAPITAL RECAP | WEEK 20–24 JUL
2026's 29th week ended slightly green after the combination of the trades taken throughout the week and the profits generated following the loss we experienced midweek.
Although this was not a deep green PnL week, we continued to maintain our no red week since YTD record through disciplined risk and position management.
(For reference I have included last week's outlook on the right)
Markets spent the week caught between geopolitical uncertainty and tightening macro liquidity conditions. During the first half of the week, price action remained relatively choppy and range-bound as markets attempted to digest the evolving geopolitical environment.
As the situation deteriorated further and additional negative headlines emerged, markets transitioned into a more pronounced downside trend from the middle of the week onward.
Monday's Weekly Market Outlook did not produce a QQQ trade, as none of our predefined scenarios triggered.
On Wednesday, an updated Daily SPY/SPX | QQQ/NDX Tactical Playbook was published in response to the changing market structure. However, no QQQ trade was taken according to the updated scenarios.
Thursday also passed without a QQQ trade.
Friday delivered a significantly more active session.
Based on the Daily SPY/SPX | QQQ/NDX Tactical Playbook, we monitored both SPY and QQQ while executing through ES and NQ futures.
The QQQ structure produced two highly precise opportunities.
The initial long trade taken around the opening session captured an approximately 4.5-point move, representing roughly 0.66% upside.
Later around midday, we transitioned into a short position and captured a full 6-point decline, approximately 0.87% to the downside.
Both QQQ trades finished profitably.
QQQ therefore finished the week with two trades and two winners.
On the SPY side, both long and short opportunities were executed through ES futures based on the SPY structure.
The initial morning long trade captured approximately 20 points in ES in roughly 10 minutes.
Later, the short setup also delivered a 4.5-point downside move in SPY terms, approximately 0.62%.
Both trades closed profitably.
Overall Recap
In total, seven trades were executed throughout the week across both options and futures.
The final result was:
6 wins
1 loss
Approximately 85% win rate
More importantly, all five futures trades taken during the week finished as winners, resulting in a 100% win rate across our futures execution.
This was a significant achievement from both an execution and risk management perspective.
Risk Index
This oscillator reads macro conditions and converts them into a technical risk framework. It was developed internally at UA CAPITAL and remains the primary indicator I use for both short-term and long-term positioning decisions.
The Risk Index algorithm is currently signaling the potential for a short-term bounce. However, the broader short to medium-term environment continues to price in the possibility of another significant downside flush.
The long-term algorithm remains firmly risk on, while the medium-term outlook continues to lean slightly bearish.
This combination typically creates elevated volatility.
Both sides of the market remain under pressure, and the probability of a larger directional move continues to increase. Markets could eventually resolve this compression through either a deeper correction or a powerful upside breakout.
Given the possibility of acceleration in either direction and potentially violent reversals, we will continue to focus on aggressive profit-taking and disciplined risk management.
We do not need to predict the direction of the next major move.
We will wait for price to reach our predefined levels, wait for confirmation, and react accordingly.
Scenarios / Strategies
Long Scenario 1
KEY Level 1 (688)
This is the first major demand zone. If price reclaims this level with a confirmed 1-hour bullish candle close, long exposure can be considered.
Trigger: Price must test the level and produce a bullish 1-hour candle close back above the zone.
Targets: Take partial profits after every $1 advance.
Invalidation: 1-hour candle close below 681.
Long Scenario 2
KEY Level 2 (663)
This is the second major demand zone. If price reclaims this level with a confirmed 1-hour bullish candle close, long exposure can be considered.
Trigger: Price must test the level and produce a bullish 1-hour candle close back above the zone.
Targets: Take partial profits after every $1 advance.
Invalidation: 4-hour candle close below 653.
Swing Zone Breakout Long Scenario
FLIP Level (712)
This is the major swing zone.
If price reclaims this level with a confirmed 1-hour bullish candle close above, the market could transition into a more bullish structure and begin moving toward the higher supply zones.
Trigger: Price must break above 712 and produce a bullish 1-hour candle close above the Flip Level.
Targets: Take partial profits after every $1 advance.
Invalidation: 1-hour candle close below 705.
Short Scenario 1
FLIP Level (705)
This area represents the primary supply zone and the upper boundary of the current trading range. A confirmed rejection from this level could provide a tactical short opportunity.
Trigger: Retest of the zone followed by a 1-hour bearish rejection candle.
Targets: Take partial profits after every $1 decline.
Invalidation: 1-hour candle close above 712.
Short Scenario 2
Main Supply (735)
This area represents the primary supply zone and the upper boundary of the broader trading range. A confirmed rejection from this level could provide a tactical short opportunity.
Trigger: Retest of the zone followed by a 1-hour bearish rejection candle.
Targets: Take partial profits after every $1 decline.
Invalidation: 4-hour candle close above 744.
Position Management Rules
1. Entry model: 1-hour candle close above or below the designated level.
2. Take profits in stages because market reversals can happen quickly.
3. After the first profit target is reached, move all remaining stop losses to breakeven and convert the position into a risk-free trade.
4. A reaction from the level must be confirmed. We do not predict price. We react to price.
5. Invalidation levels are unique to each scenario. Read them carefully.
6. Charts use RTH (Regular Trading Hours). ETH can provide incorrect candle confirmation.
Notice: Starting a fresh, fully transparent track record for SPY, QQQ, and core equities here on TradingView. Going forward, all daily market updates, tactical SPY/SPX - QQQ outlooks, institutional research, weekly outlooks, and mid week market updates will be documented and tracked consistently.
This analysis is for educational purposes only and reflects my personal opinion. It is not financial advice. SPY / SPX Weekly Outlook – Week 30 of 2026 (27-31 JUL)SPY / SPX WEEKLY MARKET OUTLOOK
UA CAPITAL RECAP | WEEK 20–24 JUL
2026's 29th week ended slightly green after combining the trades taken throughout the week with the profits generated following the loss we experienced midweek.
Although this was not a deep green PnL week, we continued to maintain our no red week since YTD record through disciplined risk and position management.
(For reference I have included last week's outlook on the right.)
Markets spent the first half of the week caught between geopolitical uncertainty and tightening macro liquidity conditions. Price action initially remained choppy and range-bound as markets attempted to digest the evolving geopolitical environment.
As the situation deteriorated further and additional negative headlines emerged, markets transitioned into a more pronounced downside trend from the middle of the week onward.
Monday's Weekly Market Outlook scenario eventually triggered at Tuesday's open.
Our SPY Long Scenario 1 produced a 2.25-point move, approximately 0.3% to the upside. We took two partial profits during the move and subsequently moved the remaining position to breakeven.
The remaining runner was eventually stopped at breakeven following Wednesday's opening. Overall, the trade delivered a profitable outcome as planned.
On the QQQ side, none of our planned scenarios triggered, so no trade was taken.
On Wednesday, an updated Daily SPY/SPX | QQQ/NDX Tactical Playbook was published in response to the changing market structure.
A SPY trade was taken according to the updated scenario. However, the position moved into drawdown without reaching our initial partial profit targets.
Since the invalidation level had not been reached, we remained committed to the plan and continued holding the position into the close.
After further downside movement overnight and during the premarket session, price eventually bounced at the open. We used that reaction to exit the position at a loss.
The trade resulted in an approximately 10-point decline, representing a loss of roughly 1.3%.
Although the trade ended in a loss, the position was managed according to the predefined invalidation framework rather than being closed prematurely based on emotion.
On Thursday, the SPY technical structure produced a highly successful ES futures trade.
The trade generated approximately 18 points of profit and provided an excellent opportunity through the futures market.
No QQQ trade was taken on Thursday.
Friday delivered a significantly more active session.
Based on the Daily SPY/SPX | QQQ/NDX Tactical Playbook, we monitored both SPY and QQQ while executing through ES and NQ futures.
The execution was highly precise and resulted in several profitable trades.
On the QQQ side, the initial long trade taken around the opening session captured an approximately 4.5-point move, representing roughly 0.66% upside.
Later around midday, we transitioned into a short position and captured a full 6-point decline, approximately 0.87% to the downside.
QQQ therefore finished Friday with two trades and two winners.
On the SPY side, both long and short opportunities were executed through ES futures based on the SPY structure.
The initial morning long trade captured approximately 20 points in ES in roughly 10 minutes.
Later, the short setup also delivered a 4.5-point downside move in SPY terms, approximately 0.62%.
Both trades closed profitably.
Overall Recap
In total, seven trades were executed throughout the week across both options and futures.
The final result was:
6 wins
1 loss
Approximately 85% win rate
More importantly, all five futures trades taken during the week finished as winners, resulting in a 100% win rate across our futures execution.
Overall, it was another highly successful week.
The combination of risk management, position sizing, partial profit taking, breakeven management, and disciplined execution allows the overall portfolio to remain profitable even when individual trades do not work.
The no red week since YTD record remains intact.
This Week's Scenarios / Prediction
Risk Index
This oscillator reads macro conditions and converts them into a technical risk framework. It was developed internally at UA CAPITAL and remains the primary indicator I use for both short-term and long-term positioning decisions.
The Risk Index algorithm is currently signaling the potential for a short-term bounce. However, the broader short to medium-term environment continues to price in the possibility of another significant downside flush.
The long-term algorithm remains firmly risk on, while the medium-term outlook continues to lean slightly bearish.
This combination typically creates elevated volatility.
Both sides of the market remain under pressure, and the probability of a larger directional move continues to increase. Markets could eventually resolve this compression through either a deeper correction or a powerful upside breakout.
Given the possibility of acceleration in either direction and potentially violent reversals, we will continue to focus on aggressive profit-taking and disciplined risk management.
We do not need to predict the direction of the next major move.
We will wait for price to reach our predefined levels, wait for confirmation, and react accordingly.
Scenarios / Strategies
Long Scenario 1
KEY Level 1 (742)
This is the first major demand zone. If price reclaims this level with a confirmed 1-hour bullish candle close, long exposure can be considered.
Trigger: Price must test the level and produce a bullish 1-hour candle close back above the zone.
Targets: Take partial profits after every $1 advance.
Invalidation: 1-hour candle close below 740.
Long Scenario 2
KEY Level 2 (736)
This is the major Put Wall and an important demand area. If price reclaims this level with a confirmed 1-hour bullish candle close, long exposure can be considered.
Trigger: Price must test the level and produce a bullish 1-hour candle close back above the zone.
Targets: Take partial profits after every $1 advance.
Invalidation: 1-hour candle close below 735.
Long Scenario 3
KEY Level 3 (730)
This is the second major demand zone. If price reclaims this level with a confirmed 1-hour bullish candle close, long exposure can be considered.
Trigger: Price must test the level and produce a bullish 1-hour candle close back above the zone.
Targets: Take partial profits after every $1 advance.
Invalidation: 4-hour candle close below 727.
Short Scenario
Main Supply (752)
This area represents the primary supply zone and the upper boundary of the current trading range. A confirmed rejection from this level could provide a tactical short opportunity.
Trigger: Retest of the zone followed by a 1-hour bearish rejection candle.
Targets: Take partial profits after every $1 decline.
Invalidation: 4-hour candle close above 757.
Position Management Rules
1. Entry model: 1-hour candle close above or below the designated level.
2. Take profits in stages because market reversals can happen quickly.
3. After the first profit target is reached, move all remaining stop losses to breakeven and convert the position into a risk-free trade.
4. A reaction from the level must be confirmed. We do not predict price. We react to price.
5. Invalidation levels are unique to each scenario. Read them carefully.
6. Charts use RTH (Regular Trading Hours). ETH can provide incorrect candle confirmation.
Notice: Starting a fresh, fully transparent track record for SPY, QQQ, and core equities here on TradingView. Going forward, all daily market updates, tactical SPY/SPX - QQQ outlooks, institutional research, weekly outlooks, and mid week market updates will be documented and tracked consistently.
This analysis is for educational purposes only and reflects my personal opinion. It is not financial advice.
 Long
Long
Short 

Long 


