Long
Long

Long 
$QQQ Weekly Close — Week ending Sep 11The week opened 720.91, pushed less than a point higher to 721.89, sold off fourteen points to 706.86, and closed 714.88 in the upper half of the range. Down 0.57% on the week.
That's a test candle. Price probed lower, supply didn't appear, buyers took it back into the close.
One honest qualifier. A test carries the most weight when it follows a heavy-volume down week, because you're testing whether that supply is still sitting there. This test follows five weeks of volume drying up — 144.53M this week against a 196.98M average, 73% relative volume, the lightest in months. There's no supply event to test against. Structurally a test, but a quiet one.
The bigger picture. Since the July high near 748, price has been chopping between roughly 686 and 748 with volume declining the whole way. Weekly range came in at 15.03 against a 27.08 ATR — 56%, a narrow week. The weekly @ripster47 5-12 EMA cloud is flat, not sloped.
That's a two-month compression. Compressions resolve. They don't announce which way in advance.
Weekly levels: 724.20 is the cap and 700.00 is the floor, with the all-time high at 748.65 above and 686.78 below. A weekly close outside 724.20 or 706.86 ends the range.
Until then there's nothing here worth forcing. $QQQ Daily Close — Sep 11NASDAQ:QQQ Daily Close — Sep 11
Gap up after CPI, then chop. NASDAQ:QQQ closed 714.88, up 0.87%, back above both @ripster47 EMA clouds. The market held the 5-12 curl. No clear direction yet.
The detail on the bar
The whole gain was the gap. Opened 715.68, closed 714.88 — below its own open. Once the session started, price did nothing: a 4-point range, 44% of a normal day, the narrowest of this entire sequence. Volume 26.58M against a 30.89M average, 86% relative volume.
An up bar, narrow range, low volume, closing at the bottom of its own range. That's no demand.
Put the last two days side by side. Yesterday price broke both clouds on 31.33M — 102% relative volume, the first above-average day in a week. Today price reclaimed both clouds on 26.58M — below average.
Sellers brought volume yesterday. Buyers didn't bring it back today. The reclaim came from a gap, not from demand showing up.
Levels
717.63 is today's high, 713.63 the low. Above, 721.89 then the 724.20 Key Level. Below, 706.86 is the line, then 700.
A close through 724.20 or 706.86 on volume above 31M gives something to trade. Anything in between is more of the same.
No position here. Mid-range, flat clouds, no volume behind either side. SPY Elliott Wave: Wave 3 Target Near 745, Larger Head & ShoulderThis is a developing Elliott Wave interpretation and will be adjusted as price action unfolds. Educational purposes only, not financial advice.
This chart shows my current Elliott Wave count for SPY on the 1-hour timeframe, alongside a potentially developing larger Head & Shoulders topping structure.
Larger Elliott Wave Structure
The June high is labeled Wave III, followed by a broad Wave IV correction. I am counting that correction as an A-B-C-D-E structure, completing near the early-August low.
From there, SPY produced a strong five-wave advance labeled 1-2-3-4-5, completing Wave V near 779. That high also forms the Head (H) of the larger Head & Shoulders pattern, with the June high representing the Left Shoulder (LS).
Current Decline
From the August high, I am counting a new bearish impulse.
The first decline completed Wave 1, followed by a Wave 2 retracement into the early-September high. SPY is now potentially progressing through Wave 3.
The smaller white and green counts show the lower-degree subdivisions I am tracking within this decline. The expectation is for these nested waves to ultimately complete the larger Wave 3 around the primary target zone.
Wave 3 Target: 745.37
My primary target for Wave 3 is approximately 745.37, based on the 1.618 Fibonacci extension.
This level also lines up with the projected completion of the lower-degree wave structure, giving the area additional technical significance.
If SPY reaches this zone and completes five waves down, I would look for a corrective Wave 4 bounce, followed by another decline in Wave 5 toward roughly 735.
That would complete the larger Wave I decline from the August high.
Potential Right Shoulder
After Wave I completes, the chart projects a larger Wave II recovery back toward approximately 760.
If that occurs, the recovery could form the Right Shoulder (RS) of the larger Head & Shoulders:
Left Shoulder: June high
Head: August high near 779
Right Shoulder: Potential Wave II recovery toward 760
This creates an interesting overlap between the Elliott Wave count and the classical topping pattern.
Bigger Picture
If the right shoulder forms and subsequently breaks down, the chart projects the beginning of a much larger Wave III decline, with the broader downside path potentially extending toward the low 700s/710s.
That longer-term projection remains speculative and depends on the intermediate wave structure developing as shown.
For now, the sequence I am watching is:
Wave 3 → ~745 → Wave 4 bounce → Wave 5 toward ~735 → Wave II recovery / Right Shoulder → potential larger Wave III decline.
The 745.37 level is the immediate focus. Price behavior there should help determine whether this count continues to develop as projected.
This is a developing Elliott Wave interpretation and will be adjusted as price action unfolds. Educational purposes only, not financial advice. Short 
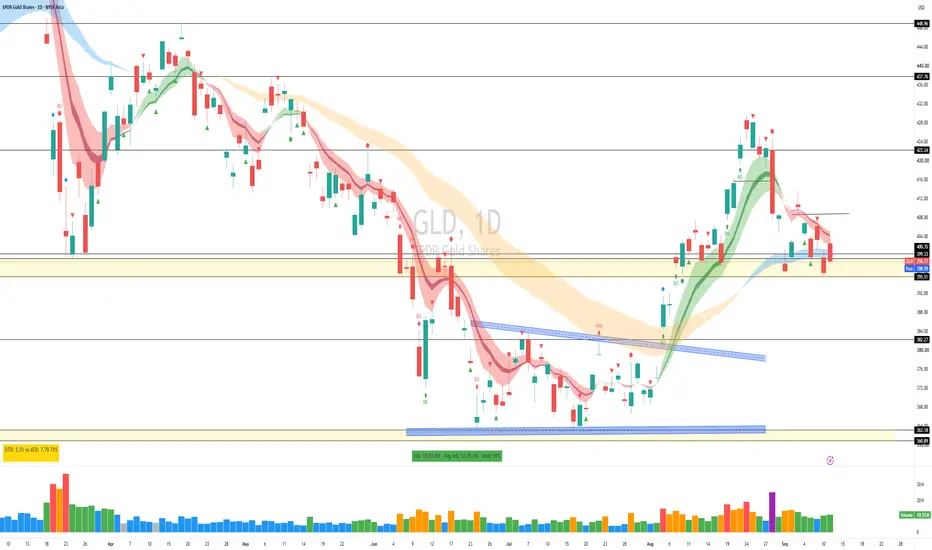
$GLD — Sep 11 closeAMEX:GLD — Sep 11 close
This one is worth paying attention to. Two red candles in a row — one on a down day, one on an up day — both with increasing volume. Buyers are trying their best to lift this market and something is going on underneath.
Today shows it clearly. Gapped up to 403.65 on the print, then got sold all day to close 398.77, right near the low and back under 400. Volume rose again. Effort with no result — that's supply meeting every rally.
Fundamentally, CPI m/m came in hot, and the market went up and then straight back down. It tricked players on both sides.
AMEX:GLD closed below the 400 psych level. Below here the ladder is 390, 385, 380.
But here's what's interesting, and it cuts the other way. On the weekly, we have two Tests sitting right on the 34/50 cloud (@ripster47 EMA cloud) — and this week printed above-average volume with a below-average range, closing off the low. Heavy volume that produces almost no movement means someone is absorbing the selling.
So the daily says supply is capping rallies. The weekly says something is buying this level. That's why price is stuck.
The line settling it is 395.51 — the weekly 34/50 and the Stopping Volume low together. It has not broken on a close. Today's low was 398.14, a higher low.
400 is the key and this is the pivot. Lose 395.51 on a close and the 390/385/380 ladder is live. Hold it and reclaim the 5-12 cloud (@ripster47 EMA cloud) and the weekly absorption wins.
One more thing to keep in mind — if we get a ceasefire between Iran and the US, that cools gold fast. Watch the headlines as much as the chart.
Trigger down: close under 395.51. Trigger up: 5-12 Curl. Short 
A reason for hope - long SPY @ 758.04It's been a rough week for the markets. If today continues red, it will be the first 4 day losing streak for SPY since March and before that it was late December 2025. If it feels unusually bleak, it's not your imagination.
But amidst rising bond yields, oil prices surging, a war that isn't over in the week it was promised to be and now spreading throughout the Middle East, inflation looming and the rising threat of AI exterminating our species, I have some statistically good news. The odds point to up, and relatively soon.
On Tuesday, SPY did something it hasn't done since the end of July, and it isn't a good thing, intrinsically. It marked its worst open to low intraday drop in the last 10 trading days. Obviously not a good thing. HOWEVER, it has done that 272 times in the last 10 years. That's a span covering the COVID crash as well as the market debacle that was 2022.
In those 272 instances, if you traded SPY on that day and closed the trade on the first day it became a profitable trade at the close, that trade made money 92.3% of the time within 10 trading days. Only 21 times in 10 years did it not. If you look out further, within 6 months you made a profit 98.5% of the time. Only 4 times in 10 years did that trade not pay within 6 months.
It's not a blowout trade return, mind you, but both windows' per day returns handily beat the long term market daily average return of +0.043%. The 10 day window average daily return per day held was almost 2.5x that (+.109%) and the 126 day window was almost exactly 2x that (+.084%), both generating annualized rates of return of over 20%.
And yes, the last 10 years have been good for the market, but this is not particularly anomalous. Using the whole history of SPY, going back to 1993 and thus folding in the dot com crash and the 2008 Global Financial Crisis, as well as the Asian Contagion in 2015-16, the results are not terribly dissimilar.
10 day daily returns all time are actually even better, at +.117% (+29% annualized) and the 126 day average daily return was +.069% (+17%), with time constrained win rates of 89.9% and 98.6%, respectively. Keep in mind, these are not the returns for a 10 or 126 day hold. They are the daily rates of return on a First Profitable Close exit strategy. Some of the trades in that 10 day window only lasted 1 or 2 days, and the same is true for that 126 day window (which encompasses the 10 day results as well). In fact, the vast majority of trades closed profitably in 1 or 2 days - which, somewhat ominously, we are already past at the end of the day today.
As always, this time could be different. it could be the 13th time in the last 33 years (850 instances total) that this signal was wrong over that 6 month horizon. I just don't bet against those kind of odds. For the record, this is not a trade I am taking personally. I have plenty of held positions that will benefit this much and more if this signal is correct. It does ease my mind that all the capital I've been trading this week that hasn't been paying off should, statistically, see better times ahead soon.
It is worth noting that on the rare occasions this signal is wrong, it is typically spectacularly wrong. All time, the average non-profitable trade (within the time constraints mentioned above) was -3.8% for the 10 day window and -20.5% for the 126 day window. But those returns are baked into the per day returns mentioned earlier. In trading you take the bad with the good. The key is to either make the good a lot better than the bad, or, in this case, make the good a LOT more common than the bad.
As always - this is intended as "edutainment" and my perspective on what I am or would be doing, not a recommendation for you to buy or sell. In this particular case, it is simply a statistical analysis of past performance under these conditions - nothing more. Act accordingly and invest at your own risk. DYOR and only make investments that make good financial sense for you in your current situation.
P.S. Sorry for the boring chart, but this is a statistical analysis, not a chart setup. Hate me for that if you must. Long 
Short 
 Long
Long
SPY Reclaimed 759.13 And Is Back At 762.57.SPY Reclaimed 759.13 And Is Back At 762.57.
SPY sold to 756.63 on the PPI reaction Thursday and has spent the overnight session climbing back, trading at 762.30 - above the 759.13 range low it lost and right at the 762.57 shelf it broke on Tuesday. That makes this a retest from below of a level it has already lost twice, which is a different thing than a hold. The 4H still reads impulse continuation lower with a Q4 short surface near 38 and its first non-waiting entry state in weeks, while the 1H is neutral at Q3 with volatility in the 90th percentile and the daily still reads bull-transitional - three timeframes, three different answers. Neutral.
Resistance: 765.52 - the level it broke Tuesday
Key resistance: 771.43 - the range mid
Current price: 762.30
Support: 759.13 - the range low, reclaimed overnight
Key support: 756.63 - Thursday's low
Structural floor: 753.22 - deeper support
Two paths from here:
It holds 762.57 and works back toward 765.52. A held session above the shelf turns the two-day break into a failed one, and 765.52 becomes the level that decides whether the range is back. Nothing above 762.57 matters until that happens.
It rejects 762.57 and returns to the lows. Failing here puts 759.13 back in play as the line, and losing that again opens 756.63 and then 753.22. A second rejection at this shelf would confirm it as resistance rather than support.
Inflation data lands before the open, so the overnight recovery is a setup and not yet an answer - what the chart does with 762.57 after the reaction is the read. 762.57 to repair it, 759.13 to lose it again.
Built with SYNTHESIS v3.3 | SOM / ACE / IMP / SYNTHESIS
Study, not financial advice.  Long
Long
SPY / SPX Weekly Outlook – Week 36 of 2026 (SEP 07 -11)SPY / SPX WEEKLY MARKET OUTLOOK
SPY Weekly Recap Outlook
Price came very close to the Demand 1 level we were watching, but missed the target I gave for Long Scenario 2 by just 0.7 cents.
However, according to the CC Model, this setup could have been confirmed through ES.
Once the Flip Level broke, price moved higher exactly as expected.
Overall, it was a successful strategy. We captured a 2% move, equivalent to 15 points, from the confirmation zone.
(For reference, I have included last week's outlook on the right.)
UA CAPITAL Trading Desk Weekly Execution Metrics | WEEK 35
Total Trades Closed: 12
Winning Trades: 8
Losing Trades: 4
Overall Win Rate: 67%
Index Options: 2 Trades (2 Wins)
Futures Desk: 7 Trades (4 Wins / 3 Losses)
Equities (Stocks): 2 Trades (1 Win / 1 Loss)
Precious Metals/Commodities: 1 Trade (1 Win)
Result: A solid Green Week.
This Week's Scenarios / Prediction
Risk Index
This oscillator reads macro conditions and converts them into a technical risk framework. It was developed internally at UA CAPITAL and remains the primary indicator I use for both short-term and long-term positioning decisions.
Long term: Risk on
Mid term: Risk on
Short term: Neutral
A warning: Macro liquidity conditions remain fragile, and a negative news catalyst could still trigger a sharp downside flush. Geopolitical risk, particularly the Iran conflict, remains elevated, while the macro environment continues to show significant compression and imbalance.
SPY Technical Look
There are two zones where I expect bullish reactions.
Flip Level: 767.5
Main Bounce Zone: 760
If price finds support and bounces from either of these two levels, I expect the following bullish targets:
Bullish Target 1: 774.5
Bullish Target 2: 779.5
A break below the Flip Level could initiate a move toward the First Key Level below.
This analysis is for educational purposes only and reflects my personal opinion. It is not financial advice. Long 
QQQ / NDX Weekly Outlook – Week 36 of 2026 (SEP 07-11)QQQ WEEKLY MARKET OUTLOOK
QQQ Weekly Recap Outlook
Long Scenario 2 worked exceptionally well on QQQ.
As planned, we took the trade on the retest from the Demand 1 zone.
Price delivered a 2.5% move, equivalent to 17 points, from Demand 1.
(For reference, I have included last week's outlook on the right.)
UA CAPITAL Trading Desk Weekly Execution Metrics | WEEK 35
Total Trades Closed: 12
Winning Trades: 8
Losing Trades: 4
Overall Win Rate: 67%
Index Options: 2 Trades (2 Wins)
Futures Desk: 7 Trades (4 Wins / 3 Losses)
Equities (Stocks): 2 Trades (1 Win / 1 Loss)
Precious Metals/Commodities: 1 Trade (1 Win)
Result: A solid Green Week.
This Week's Scenarios / Prediction
Risk Index
This oscillator reads macro conditions and converts them into a technical risk framework. It was developed internally at UA CAPITAL and remains the primary indicator I use for both short-term and long-term positioning decisions.
Long term: Risk on
Mid term: Risk on
Short term: Neutral
A warning: Macro liquidity conditions remain fragile, and a negative news catalyst could still trigger a sharp downside flush. Geopolitical risk, particularly the Iran conflict, remains elevated, while the macro environment continues to show significant compression and imbalance.
QQQ Technical Look
There are two zones where I expect bullish reactions.
SWING LEVEL: 710
SUPPORT 2: 686
If price finds support and bounces from either of these two levels, I expect the following bullish targets:
FLIP LEVEL: 726.5
BULLISH TARGET 1: 738
BULLISH TARGET 2: 747
Flip Level Rejection: If price gets rejected at the Flip Level, we may look for a short opportunity targeting the Swing Level first, with further downside toward Support 2.
Decision Zone: The Flip Level appears to be a critical decision zone for the next directional move.
Blue Box Breakdown: If price breaks below the Blue Box, we may look for a short setup targeting Support 2.
A strong break above the Flip Level could initiate a move toward the Bullish Targets above.
This analysis is for educational purposes only and reflects my personal opinion. It is not financial advice.  Long
Long
 Long
Long