Stock Market Forecast | BTC TSLA NVDA AAPL AMZN META MSFT0:00 — Introduction
Overview of the S&P 500, QQQ, Bitcoin, and the "Magnificent 7" stocks.
0:21 — Sector Data & Rotation
Analysis of how money is moving between Tech (XLK), Financials (XLF), and Healthcare (XLV). Why rotation is a sign of market health and what the Energy sector (XLE) tells us about inflation.
1:49 — Fear & Greed & AAII Sentiment
Current readings at 67 (Greed) and a look at why 40% bearishness during all-time highs provides "fuel" for the market to move higher.
2:45 — Oil Dark Pool Activity
Breaking down the recent "Number 7" largest dark pool prints and whether these represent accumulation for a leg higher in energy prices.
3:37 — Software Sector ( CBOE:IGV )
Why software has been lagging behind semiconductors and the potential for a "catch-up" rotation led by names like Microsoft.
4:33 — Earnings Recap & Economic Calendar
A review of the "beat and raise" trend from the Mag 7 and a preview of upcoming heavy-hitting data: AMD earnings, JOLTS, ISM, and the Non-Farm Payroll report.
Major Indices & Crypto
5:47 — SPY (S&P 500) CME_MINI:ES1!
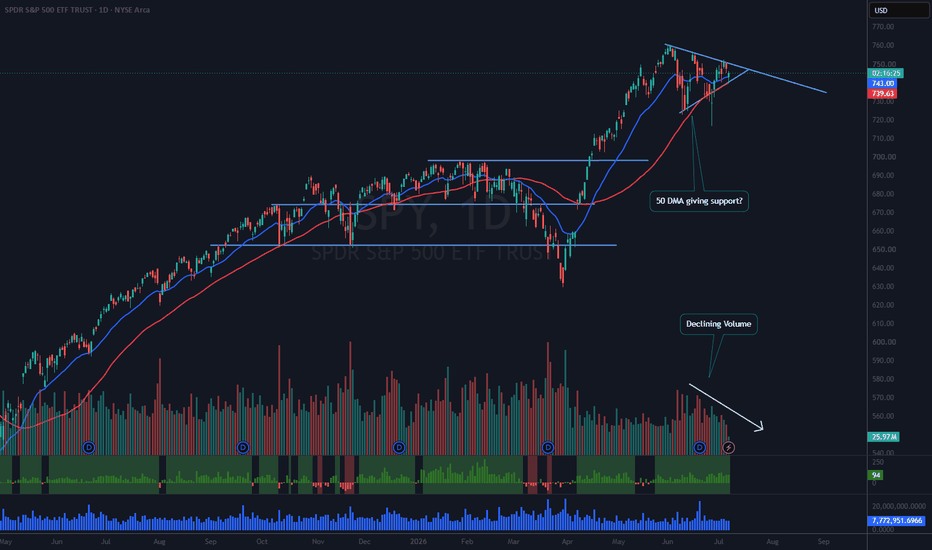
Technical analysis of the "insanely shallow" 1.2% pullback. Discussion on the lack of overhead resistance and the target for a healthy sideways consolidation.
8:29 — QQQ (Nasdaq 100) CME_MINI:NQ1!
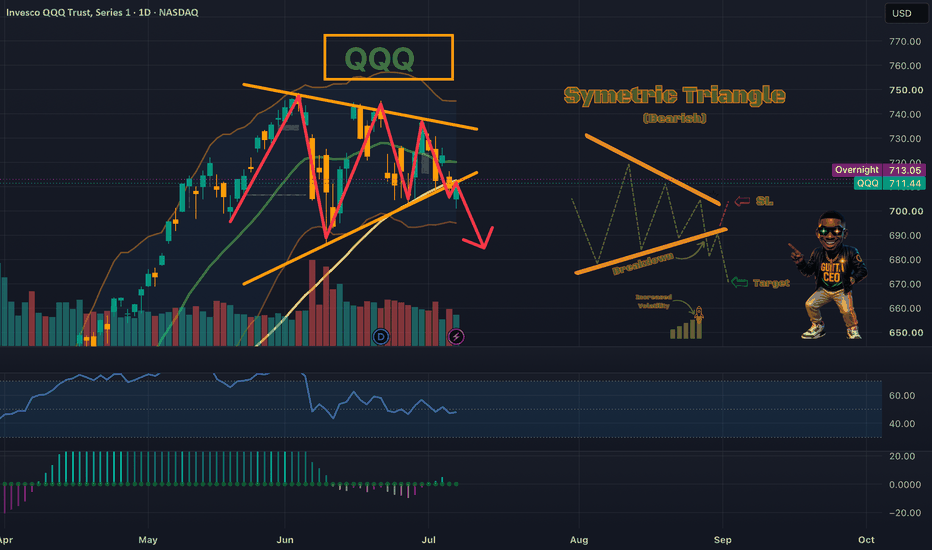
Tech outperformance and the climb toward the 688 resistance zone. A look at RSI levels and why "overbought" can stay that way in a bull market.
11:02 — Bitcoin ( CRYPTOCAP:BTC )
Bitcoin is rejecting its rising channel for the 7th time but is forming higher lows. A look at the "striking distance" for a break toward the $80,000 – $85,000 range.
The Magnificent 7 Analysis
13:12 — Tesla (TSLA)
The "Make or Break" week. A perfect backtest of the 409 level. Bulls need to hold this as support to confirm the new uptrend toward 420.
15:01 — Meta (META)
Analysis of the 8% post-earnings drop. Why the stock is entering a daily downtrend and a sideways consolidation phase following increased Capex spending.
16:38 — Amazon (AMZN)
Extremely strong price action. Prior resistance is now acting as firm support. The best-case scenario for bulls is consolidation above the 248 mark.
17:52 — Microsoft (MSFT)
The key driver for the software rotation. How Microsoft hitting 455 could stabilize the broader market if other tech names take a breather.
18:34 — Google (GOOGL)
The strongest chart in the group. A confirmed monthly bull flag with zero overhead resistance following an "insane" earnings beat.
18:49 — Apple (AAPL)
A look at the break from the long-term tightening range. Bulls need to clear the current double-top resistance to avoid more sideways chop.
19:16 — Nvidia (NVDA)
Consolidating above prior highs while waiting for the final earnings report of the group. Targets for a move to 250 or a crack back into the lower structure.
20:02 — Closing Thoughts
Final summary and invitation to check out the commodities update.
ETF market
Pivotal moment for SPYPersonal opinion, this is not financial advice.
I don’t usually use Fibonacci, but when confluence is in context, that is reason for me.
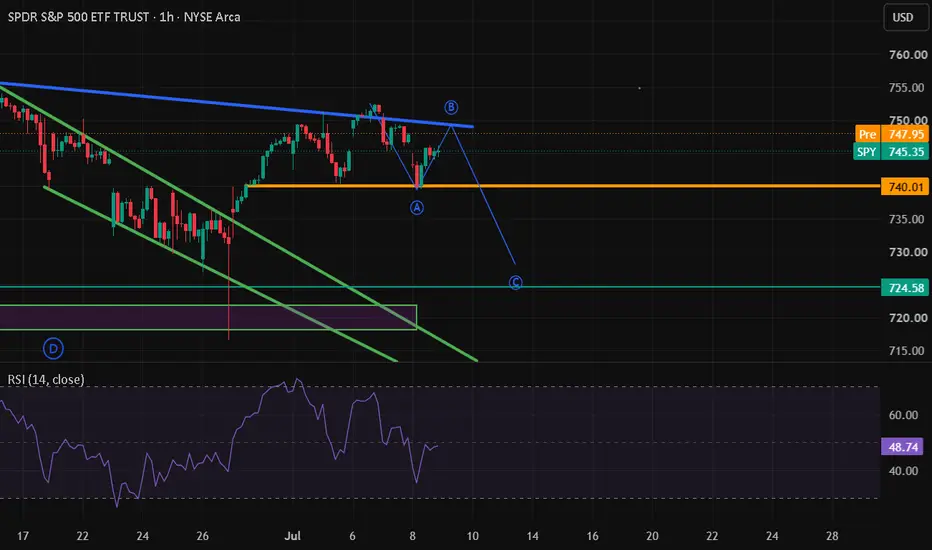
SPY’s multiple month’s upward channel resistance + Fibonacci drawn from the recent strong low seem to be forming a natural tight flag at 725-730 area. If coupled with the 5EMA, SPY breakout and retest successfully, I am inclined to go long with the trend with TP at 1.25 of Fibonacci. If it fails though, I will respect the channel resistance and go short towards the Fibonacci level of 0.75.
TLT It is gonna hurt...NOT a BULLISH long term set up for TLT holders, yet there is still time to pull out;
it is only May...rates blow off by MID fall/AUTUMN..
The information and publications are not meant to be, and do not constitute, financial, investment, trading, or other types of advice or recommendations
Markets research 01.05.2026🌏 Markets:
AMEX:SPY +1.86 +0.26%(pre/m)
NASDAQ:QQQ −0.31 −0.05%(pre/m)
🆕 Economic News:
10:00 USA – ISM Manufacturing Employment
10:00 USA – ISM Manufacturing PMI
📈 Gap Ups
Reaction to earnings/guidance:
NASDAQ:AAPL NASDAQ:TEAM NYSE:TWLO NYSE:RDDT NYSE:EL NYSE:NVT NASDAQ:MRNA NYSE:ZETA NASDAQ:ROKU
Other news:
NASDAQ:AAPL approved a new buyback of up to $100 billion and increased its dividend.
NYSE:VEEV Set to Join S&P 500 on May 6 / replacing NYSE:CTRA ( NYSE:DVN is acquiring CTRA)
Investor sentiment across cannabis stocks improved after the U.S. Justice Department moved state-regulated marijuana toward Schedule III. NASDAQ:AKAN delivered one of the biggest rallies in April among cannabis stocks, rocketing ~2200%
NASDAQ:CUE Announces $30 Million Private Placement
NASDAQ:NVDA NASDAQ:MSFT NASDAQ:AMZN SIGN PENTAGON AI DEALS
📉 Gap Downs
Reaction to earnings/guidance:
NYSE:RBLX NASDAQ:SMMT NASDAQ:WDC NASDAQ:SNDK NYSE:RYAN NASDAQ:AXTI LSE:NWG NYSE:ATMU NASDAQ:AMGN
Other news:
Morgan Stanley Downgrades NYSE:ELF to Equalweight from Overweight, Lowers PT to $67 from $80
‼️ Additional
Today, Trump is expected to justify to Congress the continuation of the military operation against Iran.
-- Most analysts believe Congress will give the “green light” for the continuation of hostilities.
🏢 IPO
NASDAQ:COAG – Hemab Therapeutics Holdings, Inc.
Company develops under-the-skin treatments for rare blood clotting disorders. Lead drug, sutacimig / HMB-001, has completed Phase 2 and is ready for Phase 3 in Glanzmann thrombasthenia, a rare bleeding disorder. The company also has earlier programs for Factor VII deficiency and Von Willebrand Disease. No revenue yet.
Price: $18.00
Shares: 16.8M
Raised: $301.5M
LTM:
Revenue: $0
Net Income: -$63.9M
Comparable public companies: NASDAQ:BMRN , NASDAQ:QURE , NASDAQ:RARE , NASDAQ:ALNY , NYSE:NVO
NASDAQ:SPTX – Seaport Therapeutics
Company develops oral treatments for depression, anxiety and other neuropsychiatric disorders. Its platform is designed to make existing drug mechanisms work better as pills by improving absorption and reducing side effects. Lead candidate, GlyphAllo, is being tested for major depressive disorder, with key Phase 2b data expected in 2027. Second candidate targets anxiety and sleep-related symptoms.
Price: $18.00
Shares: 14.2M
Raised: $254.9M
LTM:
Revenue: $0
Net Income: -$74.9M
Comparable public companies: LSE:SAGE , NASDAQ:AXSM , NASDAQ:CMPS , NASDAQ:ATAI , NASDAQ:GHRS
📋 List of tickers involved:
AMEX:SPY NASDAQ:QQQ NASDAQ:AAPL NASDAQ:TEAM NYSE:TWLO NYSE:RDDT NYSE:EL NYSE:NVT NASDAQ:MRNA NYSE:ZETA NASDAQ:ROKU NYSE:VEEV NYSE:CTRA NYSE:DVN NASDAQ:AKAN NASDAQ:CUE NASDAQ:NVDA NASDAQ:MSFT NASDAQ:AMZN NYSE:RBLX NASDAQ:SMMT NASDAQ:WDC NASDAQ:SNDK NYSE:RYAN NASDAQ:AXTI LSE:NWG NYSE:ATMU NASDAQ:AMGN NYSE:ELF NASDAQ:COAG NASDAQ:SPTX
Best regards – hi2morrow team.
India, Pakistan, Afghanistan … War in 2026
May Peace & Blessings be Upon You ,
Red Alert - India, Pakistan, Afghanistan …
No “NEW” International Investor should Purchase or Enter the Market right now.
Many laws have not yet been implemented, and it will take more time.
After the New World Laws are implemented, you should all return to the market.
Please check our posts / books:
“27 October 2025 Asia War in 2026”
“ Jun 06 2025 · 16:31: “No World War 3 in 2025”
“ Jun 30 2025 · 16:31: “200% Increase.”After 2030, most product prices are expected to rise by AT LEAST 200%”
“ Jun 06 2025 · 16:09: “Inflation 2025>2030, Secret CPI
Related industries must consider this Point in their annual research. Check our “VIP Letter” for
Entry/Exit Strategy.
> Smart people position themselves.> Stop asking what's going up or down today start asking why?
>Wealth doesn't come from predicting the future perfectly it comes from preparing for a range of outcomes and positioning yourself accordingly right now with the market
= Win isn't about avoiding risk it's about managing it intelligently
Thank You
Sulaiman Solution
01 May 2026
SPY — Friday, May 1 Setup
SPY is trading at 719.87 in the pre-market session, sitting just above the call wall at 720 and pressing against the 15-minute EMA9 at 719.79 — the 15-minute trend is a clean uptrend with RSI at 60.98, so short-term momentum has been constructive. The GEX regime is negative gamma, however: spot at 718.66 is below the zero gamma flip at 725, which means dealers amplify moves rather than dampen them. The single most important question for Friday's open is whether SPY can hold and clear 720 with conviction — because in a negative GEX environment, a confirmed break above the call wall doesn't stall the way it would in positive gamma; it tends to accelerate.
---
## 1. GEX Snapshot — Where the Pressure Is
**Top-line metrics:**
* Net Gamma: $357.4M (negative regime)
* C/P Ratio: 0.26 — heavily put-heavy
* Max Pain: $700.00
* Dealer Hedge: short gamma — dealers sell into weakness and buy into strength, which amplifies trends and expands range
* Zero Gamma Flip: $725.00
**Call gamma stack:**
* C1: $720 — primary call wall (heaviest call concentration)
* C2: $715
* C3: $710
* C4: $725
* C5: $714
**Put gamma stack:**
* P1: $700 — primary put wall (heaviest put concentration)
* P2: $710
* P3: $690
* P4: $705
* P5: $680
**Dealer behavior:** With a C/P ratio of 0.26, put positioning vastly outweighs calls — dealers are heavily short puts, which means downside support is structurally stronger than it looks on the surface. That said, we're in negative GEX, so dealers amplify directional moves in both directions rather than fading them. Price is sitting right on top of C1 at $720, which is the heaviest call concentration in the structure. In a negative GEX regime, breaking above C1 at $720 with a real bid doesn't get faded the way it would in a positive GEX day — the gamma structure turns into an accelerant, and the next meaningful resistance in the call stack is C4 at $725, which is also the zero gamma flip. On the downside, P2 at $710 is the first serious put concentration below spot, and P1 at $700 is where put gamma is densest; pullbacks toward those levels carry mechanical support from dealer hedging. The put-heavy positioning tells us there's a lot of downside protection in the market structure, but in this regime, if $710 cracks, momentum can carry.
---
## 2. Scalp Setups — 5-min trigger, 15-min context
**Long setup — clear and hold above $720:**
* **5-min trigger:** Green 5-minute close above $720.00 with price sustaining above the level on the subsequent bar — not just a wick through it.
* **15-min context:** 15-minute trend is confirmed uptrend. EMA9 at $719.79 is above EMA20 at $719.17, both rising and supporting price. RSI at 60.98 has room before overbought territory. Long direction aligns cleanly with the 15-minute structure.
* **Entry:** $720.25 on the confirmed close and hold.
* **Stop:** $718.80 — below the 15-minute EMA9 at $719.79 and back inside the C1 strike; losing this invalidates the breakout.
* **Target 1:** $722.50 — midpoint extension toward the zero gamma flip.
* **Target 2:** $725.00 — zero gamma flip and C4 concentration; partial and trail above here if momentum holds.
* **R:R:** Approximately 1:1.5 to T1, 1:3.3 to T2 from entry.
* **Skip if:** Price wicks above $720 and immediately reverses with a red 5-minute close — that's a failed breakout in a heavy gamma node and the long thesis is off. Also skip if VWAP at $715.92 is tested before the breakout setup forms, which would suggest the upside momentum is already stalling.
---
**Short setup — rejection at $720, fade back toward $715:**
* **5-min trigger:** Red 5-minute close back below $719.50 after an attempt at $720 that fails to hold — long upper wick or two consecutive red bars under the level is the signal.
* **15-min context:** 15-minute trend is uptrend, so this is a counter-trend fade — use only if the 5-minute rejection is decisive. RSI at 60.98 has not reached overbought, but the C1 call wall at $720 is a known gamma node where supply concentrates. In negative GEX, a failed breakout can still generate a sharp flush. Treat this as a shorter-duration trade with a tighter leash.
* **Entry:** $719.25 on confirmation of the red close below $719.50.
* **Stop:** $720.75 — above the C1 strike; reclaiming $720 cleanly kills the short.
* **Target 1:** $717.00 — first area of breathing room between C2 at $715 and spot.
* **Target 2:** $715.92 — VWAP, where dealer hedging and mechanical support converge with C2 at $715 just below.
* **R:R:** Approximately 1:1.5 to T1, 1:2.3 to T2 from entry.
* **Skip if:** SPY prints a clean green 5-minute close above $720.25 before the rejection setup triggers. Also skip if the 15-minute RSI pushes above 70 with price holding $720 — that changes the read from rejection to potential breakout and the 15-minute trend context is no longer supportive of the fade.
---
## 3. Risk Levels — Where the Read Breaks
The framework hinges on two levels. To the upside: a sustained close above the zero gamma flip at $725 shifts the regime to positive GEX and mean-reversion logic takes over — momentum longs above $725 become fades, not chases. To the downside: if P2 at $710 breaks with a confirmed 5-minute close below it, negative GEX amplification takes over on the sell side and the next hard support isn't until P1 at $700 and max pain at $700; there's little structural gamma between those two levels to slow the move. If $710 goes, don't fade it — follow it.
---
## Bottom Line
Negative GEX, uptrend on the 15-minute, and price parked on the heaviest call concentration in the structure at $720 — Friday opens with a binary at that level, and in this regime the resolution tends to be directional, not a chop. Respect the breakout if it confirms; respect the flush if it doesn't.
No hype. No bias. Just levels.
Trade safe. Plan ahead. Win together.
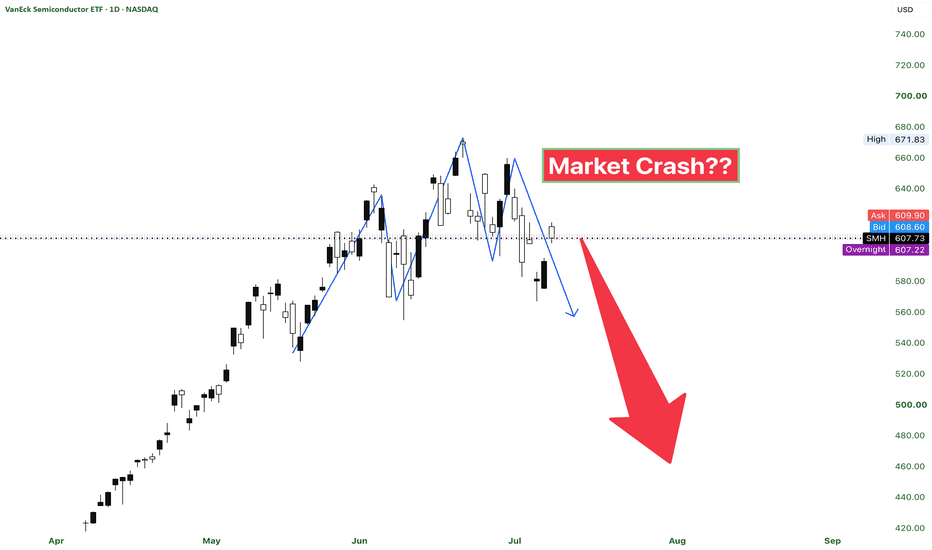
SMH puts offer a good risk-reward hereWith all major semis (NVDA, etc.) and main SMH holdings (AVGO) topping out, this one seems like a good short opportunity towards the annotated levels. May 29 puts seem appealing at these premiums for strikes 460 and below. $460p at $8 now, $450p at $6, $400p a $1.76. Stamped 4/30/2026 at 1 pm ET.
Late-stage rally with bearish momentum divergence. Reversal riskWhat would confirm the reversal
I would not call it confirmed until price does at least one of these:
Breaks below the 3-hour Supertrend
Fails to reclaim the recent high
SQZMOM crosses toward/under zero
Lower high forms on the next bounce
Price closes back into the prior range
Markets research 30.04.2026🌏 Markets:
AMEX:SPY +1.00 +0.14%(pre/m)
NASDAQ:QQQ +1.43 +0.22%(pre/m)
🆕 Economic News:
FOMC — Fed interest rate = 3.75% / Expected: 3.75% / Previous: 3.75%
08:30 USA – Core PCE Price Index
08:30 USA – GDP Growth Rate
08:30 USA – Employment Cost
08:30 USA – Personal Income/spending
📈 Gap Ups
Reaction to earnings/guidance:
NASDAQ:MRAM NASDAQ:GOOGL NASDAQ:AMZN NYSE:LLY NYSE:MA NYSE:CAT NYSE:MRK NASDAQ:QCOM BME:BBVA NYSE:CVNA NASDAQ:VIAV NASDAQ:FORM NASDAQ:VISN NYSE:RCL NASDAQ:PI NASDAQ:TTMI
Other news:
BofA Upgrades NYSE:ABBV to Buy from Neutral, Raises PT to $234 from $226
BofA Securities Upgrades NYSE:NTR to Buy from Neutral, PT $82
📉 Gap Downs
Reaction to earnings/guidance:
NASDAQ:MSFT NASDAQ:META NASDAQ:KLAC NYSE:STLA NYSE:AMRZ NASDAQ:EQIX NASDAQ:CHKP
Other news:
JPMorgan Downgrades NASDAQ:META to Neutral from Overweight, Lowers PT to $725 from $825 / Analyst comments: "We believe full-stack AI competition is intensifying and Meta has a more challenging path to returns on heavy AI capex beyond advertising.
‼️ Additional
Fed:
-- Inflation remains somewhat elevated.
-- Uncertainty has increased due to the conflict in the Middle East.
Traders now price in a 0% probability of a Fed rate cut at the next FOMC meeting — CME FedWatch data.
Powell:
-- We think policy is currently in a “good” place.
-- No one was thinking about raising rates.
-- If we need to raise rates, we will signal it and then raise.
-- We will act depending on the situation.
-- The rise in energy prices has not even peaked yet.
-- There is a lot of uncertainty.
-- We expect tariff-driven inflation to ease over the next two quarters.
🏢 IPO
NASDAQ:AVLN – Avalyn Pharma
Company develops inhaled treatments for pulmonary fibrosis — a serious lung disease where scar tissue makes breathing worse over time. Current oral drugs can slow the disease, but many patients stop using them because of side effects. Avalyn’s idea is to deliver similar medicines directly into the lungs, potentially making treatment easier to tolerate.
Price: $18.00
Shares: 16.7M
Raised: $300.1M
LTM:
Revenue: $0
Net Income: -$85.2M
Comparable public companies: NASDAQ:BMRN , NASDAQ:IONS , NASDAQ:VRDN , NASDAQ:CRNX , NASDAQ:GILD
AMEX:SBMT – Silver Bow Mining Corp.
Company explores silver, zinc, gold, lead and copper assets in Montana. Main property is the Rainbow Block, backed by historical exploration and mining data, but the company is still at the exploration stage with no production and no revenue. Core thesis depends on successful drilling, feasibility work and future production potential.
Price: $11.50
Shares: 5.2M
Raised: $59.8M
LTM:
Revenue: $0
Net Income: -$10.37M
Comparable public companies: NYSE:HL , NYSE:PAAS , NYSE:AG , NYSE:CDE , LSE:SILV
📋 List of tickers involved:
AMEX:SPY NASDAQ:QQQ NASDAQ:MRAM NASDAQ:GOOGL NASDAQ:AMZN NYSE:LLY NYSE:MA NYSE:CAT NYSE:MRK NASDAQ:QCOM BME:BBVA NYSE:CVNA NASDAQ:VIAV NASDAQ:FORM NASDAQ:VISN NYSE:RCL NASDAQ:PI NASDAQ:TTMI NYSE:ABBV NYSE:NTR NASDAQ:MSFT NASDAQ:META NASDAQ:KLAC NYSE:STLA NYSE:AMRZ NASDAQ:EQIX NASDAQ:CHKP NASDAQ:AVLN
Best regards – hi2morrow team.
TQQQ- 4/29/2026 - HOPD Buy Gave this a try as we made a 15 m close up here . Overhead resistance at around 3R up ... if it acts ok I will try to carry it over .
That being said we are probably going to create a more obvious trading range going forward that will last several weeks/months. That overhead resistance could very well end up becoming the top of a range I think . Just following my routine though, so I bought .
TLT Bullish RetracementToday’s bond selloff appears to be driven more by uncertainty than by a deterioration in the long-term macro outlook, creating what looks like an attractive dip-buying opportunity in duration. Rising geopolitical tensions have added risk premium to yields while markets continue to reprice the timing and magnitude of future Fed cuts, pressuring Treasuries in the short term. At the same time, the easing of political resistance to Kevin Warsh’s Fed chair confirmation removes a layer of uncertainty and introduces a potential positive catalyst for fixed income if markets interpret his leadership as supportive of a clearer or more flexible policy path. If this move higher in yields is being driven primarily by fear and positioning rather than a sustained resurgence in inflation, current levels may offer compelling entry for investors looking to lock in elevated yields ahead of eventual policy normalization.
MOO...n't ? VanEck - Another textbook distribution patternhigher volume than usual on that swing, If you zoom in you'll recognize all the characteristics of distribution, maybe UTAD is missing so let say its valid till 97 to 103 (will update if needed)
also not shown on chart but this level is 0.618 retracement fib from apr 22 high (109)
first TP is 0.5 retracement at 71.8 to ~68 - prob several months to get there
second tp is at 47.3 and below - prob several years to get there
cheers
Trouble Shooting Layout GlitchHello Tradingview
I wanted to make this vide to demonstrate the glitch that is happening with the layout on the platform for me. as you see when the vertical divider is mode to the right the charts on the right are not adjusting their size, they are actually being covered by the chart on the left. This is happening with any layout I choose and is happening on the web-browser version as well as with the desktop version. I am not sure if I mention this on the video but I am on an Imac desktop computer.
Hopefully you guys can help me return to a working layout.
Regards
Markets Research 29.04.2026🌏 Markets:
AMEX:SPY +0.27 +0.04%(pre/m)
NASDAQ:QQQ +1.76 +0.27%(pre/m)
🆕 Economic News:
08:30 USA – Building Permits
08:30 USA – Durable Goods Orders
08:30 USA – Housing Starts
14:00 USA – Fed Interest Rate Decision (The last FOMC with Jerome Powell as the chair of the Federal Reserve)
14:30 USA – Fed Press Conference
📈 Gap Ups
Reaction to earnings/guidance:
NASDAQ:STX $V NYSE:ABBV NASDAQ:TMUS EURONEXT:TTE NYSE:APH NASDAQ:SIMO NYSE:BE NASDAQ:NXPI NYSE:RSI NASDAQ:COCO NYSE:GNRC NYSE:UMC NYSE:ETSY NYSE:TEVA NYSE:GD NYSE:UBS NYSE:LMND NASDAQ:SBUX
Other news:
Growing following STX earnings: NASDAQ:WDC NASDAQ:MU NASDAQ:SNDK
📉 Gap Downs
Reaction to earnings/guidance:
NASDAQ:CAR NASDAQ:BKNG NASDAQ:HOOD NASDAQ:SOFI NASDAQ:GEHC NASDAQ:TER NASDAQ:WING NASDAQ:ENPH NYSE:GSK NYSE:HUM NYSE:AZN
Other news:
China Suspends Autonomous Driving Permits After NASDAQ:BIDU Outage
CLARITY Act Latest Update: Tillis Adds Fresh Problem, NASDAQ:COIN Fires Back And Expert Calls Bill Dead
‼️ Additional
The UAE has decided to leave OPEC and OPEC+ starting May 1.
-- The UAE will gradually increase oil production.
The Senate is expected to vote today on confirming Warsh as Fed Chair.
🏢 Closed-End Fund / IPO
NYSE:PSUS / NYSE:PS – Pershing Square USA / Pershing Square Inc.
Pershing Square is Bill Ackman’s alternative asset manager with about $30.7B in AUM and $20.7B in fee-paying AUM. This is not a normal company IPO: it is a combined offering involving a closed-end fund, Pershing Square USA ( NYSE:PSUS ), and the asset management company, Pershing Square Inc. ( NYSE:PS ). The structure gives investors exposure to Ackman’s investment platform and permanent-capital strategy.
Price: $50.00
Shares: not fully disclosed / combined structure
Raised: ~$5.0B
LTM:
Revenue: $762.5M
Net Income: $249.8M
Comparable public companies: NYSE:BX , NYSE:KKR , NYSE:APO , NYSE:ARES , NYSE:OWL
📋 List of tickers involved:
AMEX:SPY NASDAQ:QQQ NASDAQ:STX $V NYSE:ABBV NASDAQ:TMUS EURONEXT:TTE NYSE:APH NASDAQ:SIMO NYSE:BE NASDAQ:NXPI NYSE:RSI NASDAQ:COCO NYSE:GNRC NYSE:UMC NYSE:ETSY NYSE:TEVA NYSE:GD NYSE:UBS NYSE:LMND NASDAQ:SBUX NASDAQ:WDC NASDAQ:MU NASDAQ:SNDK NASDAQ:CAR NASDAQ:BKNG NASDAQ:HOOD NASDAQ:SOFI NASDAQ:GEHC NASDAQ:TER NASDAQ:WING NASDAQ:ENPH NYSE:GSK NYSE:HUM NYSE:AZN NASDAQ:BIDU NASDAQ:COIN NYSE:PSUS NYSE:PS
Best regards – hi2morrow team.
XBI Testing 52‑Week High – Setup Favors Short-Term PullbackCurrent Price: 133.28 (Analysis was generated on Monday Morning)
Direction: SHORT
Confidence level: 42%(Limited trader data but commentary noted a weak close and aggressive pullback into the daily 50 while price sits at major resistance near the 52‑week high. That setup favors a short‑term rejection.)
Targets
Target 1: 129.00
Target 2: 125.00
Stop Levels
Stop 1: 136.00
Stop 2: 139.00
Key Insights:
Here's what's driving this setup right now. XBI has rallied strongly and is currently pressing directly against its 52‑week high near $133. That level matters because breakouts from multi‑month highs either accelerate quickly or reject sharply. When I look at the trader commentary and recent chart structure, I'm seeing caution rather than breakout enthusiasm.
Several professional traders pointed out that the ETF had an aggressive pullback into the daily 50 moving average recently and that the weekly close didn't look particularly strong. That kind of price behavior near major resistance often leads to short‑term profit taking before any sustained move higher.
Another factor worth watching is positioning. Biotech has already moved substantially off its 2025 lows, and the sector has been attracting speculative momentum again. When an ETF approaches a key high after a strong run, short‑term traders frequently fade the first test of resistance.
Recent Performance:
You can see this tension in the recent price action. XBI climbed from the low $120s earlier in the month and pushed quickly toward the $133 area. That move brought the ETF right back to the top of its yearly range. Volume has remained steady, but price has started stalling right where sellers previously stepped in.
Over the last several sessions, the ETF has hovered near this resistance zone rather than breaking cleanly through it. That kind of hesitation often signals consolidation or a short pullback before the next directional move.
Expert Analysis:
Traders are watching the $131.50 area closely. Several professional traders highlighted that level as a key pivot because it's close to recent support and sits near the short‑term trend structure. If price slips below that zone, momentum traders typically start taking profits.
What's interesting is that none of the trader commentary showed strong breakout conviction above the highs. Instead, the discussion focused on chart weakness after the pullback and the risk of retracing toward support zones if buyers can't push decisively higher.
Because the ETF is sitting almost exactly at resistance, the risk‑reward favors a tactical short rather than chasing the move higher.
News Impact:
Recent sector news has been moderately supportive. Developments around GLP‑1 related healthcare interest and biotech deal activity have brought attention back to healthcare ETFs like XBI. At the same time, policy uncertainty around pharmaceutical pricing and regulatory leadership changes continue to create volatility in biotech stocks.
So while the macro backdrop isn't strongly negative, it also isn't strong enough to justify an immediate breakout above major resistance.
Trading Recommendation:
Here's my take. XBI is pressing a major resistance level around $133 after a strong run, and trader commentary shows caution about the chart structure following the recent pullback. That combination makes a short‑term fade attractive.
I'd consider a tactical SHORT position near current levels with downside targets at $129 first and $125 if momentum accelerates. Risk should be tightly managed above the resistance breakout zone, which is why stops sit at $136 and $139.
If price breaks above $136 with strong volume, the short thesis likely fails and a breakout trade becomes the new setup. Until that happens, the risk‑reward still favors a pullback from these highs.
GBTC Following Spot BTC Structure with Breakout PotentialCurrent Price: 60.37 (Analysis was generated on Monday Morning)
Direction: LONG
Confidence level: 85%(Trader consensus remains unified across group metrics.)
Targets
Target 1: 63.20
Target 2: 65.00
Stop Levels
Stop 1: 58.80
Stop 2: 57.90
Key Insights:
GBTC tends to move slightly more aggressively than some other Bitcoin ETFs because of its trading dynamics and investor base. When Bitcoin begins trending, GBTC often amplifies those moves.
Right now the ETF is hovering just above $60, which is acting as a psychological support level. The real technical picture shows a consolidation between roughly $59 and $63.
If Bitcoin pushes higher this week, GBTC could quickly revisit the upper end of that range and potentially break through it. Momentum traders frequently rotate into GBTC during BTC strength because of its strong correlation.
Recent Performance:
GBTC has been trading in a narrow band, refusing to lose the $59–$60 zone. That type of price behavior usually indicates accumulation rather than distribution.
Expert Analysis:
Traders discussing GBTC alongside BTC are focusing on ETF flow stabilization. When the selling pressure from redemptions fades, the product tends to track spot moves more cleanly.
X sentiment is neutral, but professional traders watching ETF charts are leaning bullish given Bitcoin’s support structure.
News Impact:
The broader Bitcoin ETF landscape in 2026 has matured, and GBTC remains one of the most liquid instruments for equity traders wanting BTC exposure. That keeps it highly responsive to any upside breakout in the underlying asset.
Trading Recommendation:
Bias stays LONG this week while price holds above the high‑$50s. If BTC pushes toward $80K+, GBTC could test mid‑$60 levels quickly.
QQQ Holding Momentum as AI Spending Drives Nasdaq LeadershipCurrent Price: 663.88 (Analysis was generated on Monday Morning)
Direction: LONG
Confidence level: 85%(Trader consensus remains unified across group metrics.)
Targets
Target 1: 682.00
Target 2: 705.00
Stop Levels
Stop 1: 648.00
Stop 2: 635.00
Key Insights:
QQQ continues to sit right in the middle of the global AI investment boom. With Nvidia, Microsoft, Alphabet, and other mega-cap tech companies dominating the ETF weighting, any surge in AI infrastructure spending feeds directly into QQQ price action. The recent news around Google's potential $40B investment in Anthropic reinforces the narrative that hyperscalers aren't slowing down their spending cycles.
Another factor supporting QQQ is capital concentration. Institutional flows have continued rotating into large-cap tech because it's seen as both a growth trade and a defensive play during macro uncertainty. When geopolitical tensions rise, investors often prefer companies with strong balance sheets and global revenue streams — exactly what dominates the Nasdaq 100.
What's interesting this week is the divergence between geopolitical headlines and market positioning. Traders are aware of the energy risk around the Strait of Hormuz, but until oil actually spikes, the market continues prioritizing growth narratives.
Recent Performance:
QQQ has been grinding higher and holding above key breakout zones while repeatedly finding buyers on shallow pullbacks. The ETF has maintained strong trend structure, with higher lows continuing to form even as volatility from geopolitical headlines appears intraday.
Expert Analysis:
Several professional traders I track on YouTube highlighted the same technical structure: strong institutional support zones just below current price and persistent dip buying. Many are watching the mid‑$640s to $650 area as a strong support cluster.
Over on X, sentiment remains strongly bullish. Traders frequently mention the ongoing AI spending cycle and continued momentum in semiconductor stocks as the main reason they're staying long rather than fading rallies.
News Impact:
The geopolitical backdrop around Iran and shipping disruptions in the Strait of Hormuz remains a risk. However, the market hasn't seen the oil spike that many feared. Meanwhile, massive AI investments from major tech companies continue to support the Nasdaq’s growth narrative.
Trading Recommendation:
I’m staying bullish on QQQ for the coming week. As long as macro shocks don’t escalate dramatically, the combination of AI spending and strong institutional demand should keep momentum pointing higher.