Seems like a good idea to sell the volatility on jet fuelAMEX:JETS
Jade Lizard Trade:
Call credit spread above the price:
+1 $27 Call 5/29
-1 $26 Call 5/29
Short put below the price:
$24 Put 5/29
~$150 credit (TBD)
Breakeven ~$22.50
Jade Lizard Trade = the credit received
to open the trade exceeds the max loss
of the credit spread, (in this case, no risk
to the upside, just reduced profit.
The downside on the other hand...).
At expiration: If share price is > $27 then
buy to close the call credit spread for $100.
Trade profit of ~$50.
If share price is between $24 and $26 then
realize max profit of ~$150 (the credit to
open the trade).
If share price is < $24 then assigned to
buy 100 shares at an average cost of
~$22.50 per share.
ETF market
SPY is topped. Near term downtrend is upon us.Since 20 April 2026, the net buy volume for SPY started decreasing, while the price remained in an uptrend.
Net buying tends to reverse before the price does.
On top of net buying going negative on the daily, the intraday and overnight price action have both remained bullish since the sharp price reversal weeks ago and have both reached local highs. Sustained bullishness on both intraday and overnight price action for the SPY is extremely rare since options flow tends to determine intraday moves, which flips periodically. Overnight price is, in my opinion, more ore less determined through swaps and flow external to the US markets.
Since we have sustained bullishness on intraday and overnight price action up to the local highs for both, a reversal in net buying, and the FOMC meeting tomorrow (29 April 2026), now is the perfect time for the price to start the next trend… which is in the downwards direction. Flow has been pointing that way for the past week anyways.
Observing Point Of ControlThe black line represents the Point of Control (POC) at 607.81 — the level where the highest volume has traded.
Notice how price consistently gravitates back toward this area. This reflects a zone where the market previously found the most agreement, making it a key reference point within the structure.
What stands out is that some of the strongest moves are developing directly from this level — not randomly, but from a zone of confirmed participation.
At the same time:
• RSI showed its strongest expansion from this area
• OBV began trending higher from this level as well
This alignment suggests the move is not just price-driven, but supported by momentum and participation building at the same location.
⭐ Final Clarity Note ⭐:
High-volume levels like the POC act as decision zones within the market.
When price, momentum, and participation all strengthen at the same level, it often leads to the most meaningful moves.
SPY - The Importance of VolumeThis post is an add on to my Wyckoff Distribution Schematic for SPX. That idea can be found here:
Now I will be examining SPY and explaining the importance of volume in relation to the current state of the market.
Looking back at the 2025 price and volume fractal, we could be seeing something very similar begin to unfold in 2026. Given that price is still in the "Upthrust After Distribution" phase, the correction could be right around the corner and the volume data is starting to support that hypothesis.
Phase 1: Price Rising, Volume Declining
In early 2025, as price rallied toward the all time highs at that time, volume began to decline. This created a clear divergence near the highs as the increase in price was not supported by volume. Smart money was not participating in the rally at the same level retail was.
Phase 2: Price Declining, Volume Climbing
This divergence then led to a selloff as SPY entered Phase 2. Price began to decline and volume started to climb.
Final Phase: Price Collapses, Volume Skyrockets
Then with Trump's 2025 tariffs, price collapsed and volume skyrocketed. That massive volume spike showed significant interest from market participants at the April 2025 lows and contributed enough buying pressure to establish a bottom and fuel the rally to new all time highs later in the year.
What Is Happening Right Now:
What is interesting about the present day is a very similar pattern appears to be unfolding. The S&P just made history. Since 1928 it has not seen a 5% to 10% pullback recover in just 11 trading days. The largest V shaped recovery the index has seen in a very long time.
So why is volume declining? Why is there no interest or support to give this rally the fuel to continue higher? This is where things seem unusual.
Volume is continuing to decline as price rises, just like what we saw in Phase 1 of 2025 before the crash. Even yesterday, the S&P posted its second lowest volume day since this large V shaped recovery began. The index keeps reaching new all time highs but there is no volume to support the move.
The only way volume appears likely to start increasing again is if Phase 2 begins and price starts to decline. This would lead SPY back toward the Point of Control around $680 before volume really starts to pick up. Here is the idea that outlined that VRVP level which will need to be closely monitored going forward:
If price starts to decline and re-enters the primary established range of the Wyckoff Distribution Schematic, the final phase of price collapse combined with skyrocketing volume will be right around the corner. There will likely need to be some sort of catalyst to trigger the move, but it seems experienced market participants are already positioned and waiting for exactly this to happen.
Even when the S&P began to drop before the V shaped recovery, Warren Buffett called the selloff "nothing" compared to prior crashes he has navigated, noting markets were only about 5% to 6% cheaper than recent highs, while stating he had no plans to deploy Berkshire Hathaway's $373 billion cash pile.
Now the index has completely recovered and continued to print new all time highs and it is still not enough to entice smart money. That is precisely why such low volume is being recorded.
One way or another, something has to give. This divergence between price and volume will not last much longer.
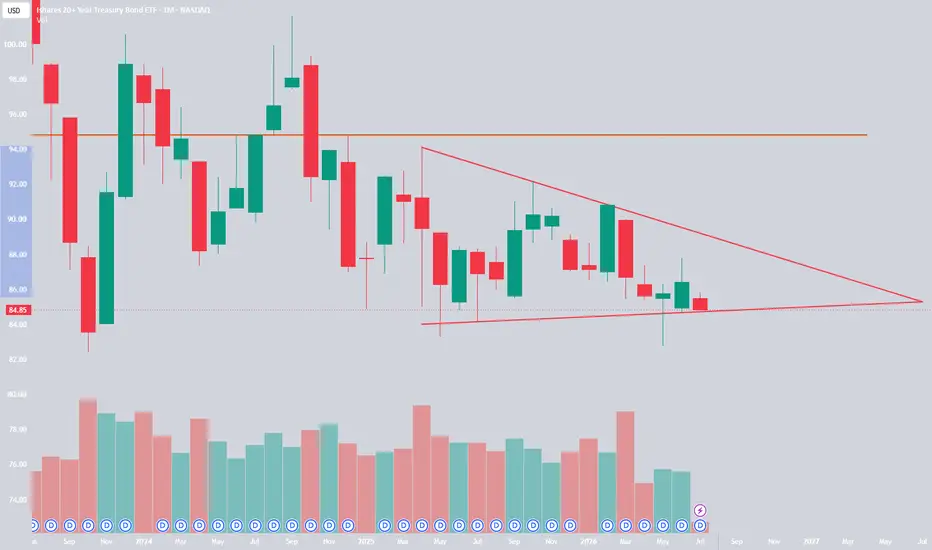
Long $TLT $97 to $120?Everyone is betting on rates going higher and I see the opposite happening.
Rates look like they're topping here, and this coincides with NASDAQ:TLT bottom.
If we look at the chart, we're retesting a major support area here and I think it's going to lead to a reaction that sends TLT higher.
If we end up breaking the trend line, which I think we will the next time we test it, it'll lead to a sharp move in TLT higher. How high?
I've marked off resistance levels on the chart, but I think it could easily break $100 on the next move and potentially go all the way up to $120. I think this will be a bounce within a bear trend, not a change of direction. Macro, I think we're in a higher rate environment over the long term, but if you time this well, you should be able to capitalize on a large bounce.
Largely I think now is a good time to go into safer assets (like TLT) and scale out of equities.
Markets research 28.04.2026🌏 Markets:
AMEX:SPY −4.70 −0.66%(pre/m)
NASDAQ:QQQ −8.14 −1.23%(pre/m)
🆕 Economic News:
OpenAI reportedly missed revenue targets.
08:15 USA – ADP Employment Change Weekly
10:00 USA – CB Consumer Confidence
📈 Gap Ups
Reaction to earnings/guidance:
NYSE:BBBY NASDAQ:OMCL NASDAQ:KNSA NASDAQ:AXGN NASDAQ:CECO NYSE:LC NASDAQ:SANM NYSE:SEI NYSE:BP NYSE:KO NYSE:GM
Other news:
NASDAQ:RVMD has advanced what could turn out to be one of the most important cancer drugs in a generation. In a late-stage clinical trial, its pill nearly doubled survival compared with chemotherapy.
NYSE:PKX Raised to Buy From Neutral by UBS
NASDAQ:NEXR today announced that its wholly-owned subsidiary, KeepZone AI Inc, has received an official letter of authorization from a provider of protective infrastructure solutions to introduce and represent the Provider’s advanced composite structural survivability system for fuel storage tanks and critical energy infrastructure with select clients in the Gulf region.
📉 Gap Downs
Reaction to earnings/guidance:
NASDAQ:RMBS NYSE:CLS NYSE:SPOT NASDAQ:AMKR NYSE:GLW NASDAQ:SRAD NYSE:QGEN NASDAQ:GLXY NYSE:UPS NYSE:AWI NYSE:ZBH LSE:BSC NYSE:NVS NASDAQ:CDNS NYSE:HLT
Other news:
NASDAQ:ERAS shares fell after the company disclosed a patient death in an early-stage trial of its experimental cancer drug, even though analysts said the incident was unlikely to signal a broader safety issue.
‼️ Additional
OpenAI CFO Sarah Friar has told other company leaders she is worried the company may not be able to pay for future computing contracts if revenue does not grow fast enough, according to people familiar with the matter. - WSJ
Stock futures were sliding on Tuesday as investors fretted about an apparent lack of progress in peace talks between the U.S. and Iran. (potentially)
📋 List of tickers involved:
AMEX:SPY NASDAQ:QQQ NYSE:BBBY NASDAQ:OMCL NASDAQ:KNSA NASDAQ:AXGN NASDAQ:CECO NYSE:LC NASDAQ:SANM NYSE:SEI NYSE:BP NYSE:KO NYSE:GM NASDAQ:RVMD NYSE:PKX NASDAQ:NEXR NASDAQ:RMBS NYSE:CLS NYSE:SPOT NASDAQ:AMKR NYSE:GLW NASDAQ:SRAD NYSE:QGEN NASDAQ:GLXY NYSE:UPS NYSE:AWI NYSE:ZBH LSE:BSC NYSE:NVS NASDAQ:CDNS NYSE:HLT NASDAQ:ERAS
Best regards – hi2morrow team.
USO Likely to Mirror Crude Pullback This WeekCurrent Price: 132.4 (Analysis was generated on Monday Morning)
Direction: SHORT
Confidence level: 85%(Trader consensus remains unified across group metrics.)
Targets
Target 1: 129.80
Target 2: 127.60
Stop Levels
Stop 1: 134.20
Stop 2: 136.00
Key Insights:
USO is trading around $132.4 and tends to follow WTI futures very closely, so the same structural pressures affecting crude show up here as well. The ETF has rallied alongside oil but is now approaching a zone where buyers previously struggled to maintain momentum.
What stands out is the slowing pace of upside movement. Price is still elevated, but momentum is fading and volatility is compressing. When an ETF tracking commodities behaves like that, it often signals that the underlying futures market is losing steam.
If crude rolls over even slightly, USO usually amplifies that move because ETF flows adjust quickly when traders start rotating out of energy exposure. That’s why downside targets can appear faster than many expect.
Recent Performance:
Throughout early 2026, USO climbed steadily with the crude rally and pushed back toward the upper range of its recent trading band. However, the most recent sessions show smaller candles and less aggressive buying, suggesting the rally may be running out of momentum.
Expert Analysis:
Unlike CL=F, sentiment signals here are quieter. X discussions around USO are mostly neutral right now, which often happens when traders focus more on crude futures than the ETF itself.
Professional traders who track energy ETFs generally view USO as a proxy trade for crude. Since many of those same analysts are leaning cautious on oil futures, the expectation is that USO follows the same short‑term downward move.
News Impact:
Energy sector headlines still dominate macro discussions in 2026, especially around supply management and geopolitical tensions. While these factors support long‑term volatility, they haven't produced a clear catalyst for immediate upside continuation this week, leaving USO vulnerable if crude starts sliding.
Trading Recommendation:
My approach this week is to treat USO as a short alongside crude futures. If CL=F retraces from the mid‑$90s, USO should drift lower toward the high‑$120s fairly quickly.
SMH Breakout Watch: Semiconductors ETF Pressing $515 CeilingCurrent Price: 506.44 (Analysis was generated on Monday Morning)
Direction: LONG
Confidence level: 64%(Multiple professional traders highlight strong semiconductor momentum and sector leadership driven by AI demand. X sentiment also leans bullish with significantly more positive than negative signals. Confidence reduced slightly due to traders warning the sector is extended after a rapid rally.)
Targets
Target 1: 520
Target 2: 535
Stop Levels
Stop 1: 480
Stop 2: 470
Key Insights:
Here’s what’s driving this setup right now. Several professional traders repeatedly point out that semiconductors are the strongest sector in the market. The ETF has surged roughly 40% off recent lows and even logged a weekly gain close to 9%, which tells us capital is aggressively rotating into AI‑related chip names.
Another thing multiple traders keep mentioning is the AI infrastructure spending wave. Hyperscalers are expected to invest over $600B into AI infrastructure this year, and that demand flows directly into GPU, memory, and data‑center chips. Because SMH holds many of these companies — Nvidia, AMD, TSMC, Micron — the ETF tends to move first when that theme accelerates.
At the same time, a few traders are waving a small caution flag: the move has been extremely fast. The sector gained around 40% in roughly 18 trading days according to several trading desks tracking the momentum surge. That doesn’t usually reverse immediately, but it often leads to brief pauses before another push higher.
Recent Performance:
You can see this strength clearly in the chart. SMH is trading near $506 after reclaiming record territory and pushing close to the $515 resistance zone. The ETF has stayed well above the 50‑day moving average around $460 and the 200‑day around $440, showing strong institutional trend support. Volume has also expanded recently, which typically signals accumulation rather than exhaustion.
Expert Analysis:
Traders across multiple desks are focused on the same technical story: semiconductors are leading the entire equity market. Several traders mentioned that Nvidia approaching all‑time highs and strong moves in AMD and Intel helped fuel the ETF’s rally. One interesting observation from the professional trading community is the heavy call‑option activity in semiconductor names, suggesting institutions are positioning for additional upside.
At the same time, many traders emphasize the importance of maintaining trend structure. The daily trend support — roughly aligned with the short‑term moving averages — is the level professionals are watching to confirm continuation. As long as price stays comfortably above the $470–$460 zone, the bullish structure remains intact.
News Impact:
Recent news continues to reinforce the bullish thesis. Strong earnings reactions from semiconductor companies, combined with ongoing AI spending headlines, keep investors focused on the sector. The market narrative remains centered on chip shortages and AI compute demand, both of which support higher revenue expectations across the industry.
Trading Recommendation:
So where does this leave us? I’m leaning LONG on SMH for the coming week. The combination of strong sector leadership, institutional volume, and continued AI‑driven demand suggests momentum could push price through the $515 resistance zone. If that breakout happens, a move toward $520 and potentially $535 is realistic within the week.
Risk management matters here because the rally has been fast. I’d watch $480 as the first warning level and $470 as the structural stop. As long as price holds above that zone, the trend remains in favor of buyers.
XLP double‑bottom setup hints at a defensive sector reboundCurrent Price: 83.23 (Analysis was generated on Monday Morning)
Direction: LONG
Confidence level: 48%(Professional trader snippets indicate a potential move higher with a double-bottom pattern and explicitly state the setup is not bearish. Social sentiment also leans bullish but volume is extremely limited, reducing conviction.)
Targets
Target 1: 84.90
Target 2: 86.00
Stop Levels
Stop 1: 82.00
Stop 2: 80.80
Key Insights:
Here's what's driving this setup. Several professional traders are watching a developing double‑bottom pattern in XLP while broader markets potentially move sideways. The idea is simple: if the S&P 500 pauses, defensive sectors like consumer staples often rotate higher. That's exactly the dynamic traders are discussing right now.
What's interesting is the tone from the trader analysis. The consensus isn't aggressively bullish, but traders consistently emphasize that the setup “isn't bearish” and could allow XLP to move higher while growth sectors cool off. That type of defensive rotation often appears when investors look for stability.
Another factor worth noting is the technical backdrop. XLP has been hovering close to longer‑term support areas and just above major moving averages. When defensive ETFs hold those levels while risk assets stall, they sometimes produce short bursts of upside momentum.
Recent Performance:
XLP has been trading in a relatively tight band recently, hovering around the low‑$80s after pulling back from earlier highs. The ETF’s current price around $83 places it near a key consolidation zone where buyers have historically stepped in. The price action hasn’t shown strong momentum yet, but it also hasn’t broken down, which explains why traders are watching the base formation closely.
Expert Analysis:
Several professional traders highlighted the potential for XLP to “rip higher” if broader markets move sideways. The key idea from trader consensus is sector rotation: capital leaving high‑beta tech names and moving into defensive areas like consumer staples.
Multiple traders also mentioned monitoring the developing double‑bottom structure. That pattern typically signals that selling pressure is fading. If price pushes above nearby resistance in the mid‑$84 region, it could trigger short‑term momentum buying that drives a move toward the $86 zone this week.
News Impact:
Macro headlines are quietly supporting the defensive trade. Concerns around energy prices and inflation pressures can sometimes benefit consumer‑staples companies because they maintain relatively stable demand. On top of that, analysts discussing pricing pressure and valuation resets in the sector have brought more attention to the group. None of this is explosive news, but it helps explain why traders are considering rotation into XLP.
Trading Recommendation:
So where does this leave us? I'm leaning LONG on XLP this week, mainly because the trader analysis points to a possible defensive rotation combined with a developing double‑bottom. The setup isn't extremely strong, so position sizing should stay modest. I'd look for entries around the $83 area with targets at $84.90 and $86.00. Risk should be controlled with stops near $82.00 and $80.80 in case the pattern fails. If the ETF clears the mid‑$84 zone early in the week, momentum traders may push it toward the second target quickly.
# SPY Intraday Preview — April 28
Heading into Tuesday's session, SPY is trading at 716.26 in the premarket — sitting above Friday's session high of 715.63 and above the 9 EMA at 716.26 and 20 EMA at 716.13. The prior session closed with a bullish bias: price finished above VWAP and above the opening range high. That strength is carrying forward into the open, but we're in a negative GEX regime with the zero gamma flip at 735 well above current price. That framing matters a lot. This is not a mean-reversion environment. Trending behavior, extended ranges, and momentum follow-through are the base case. Fades are dangerous here.
Tuesday opens with a potential gap up relative to Friday's session high of 715.63. If that holds at the open, the structure is constructive — but in negative GEX, breakouts can accelerate and pullbacks can turn into something more. Respect the regime, trade with momentum, and don't lean on walls to magically stop price the way they would in a pinning environment.
---
## 1. Session Context — Where We Left Off
Friday closed with SPY at 716.26 (as measured by the EMAs and current premarket price), well above VWAP at 714.23 and firmly through the opening range high at 714.41. The session opened at 713.17, found its low at 712.30, and pushed to a high of 715.63 — so the prior session's range was approximately 3.33 points. Price ended the day with the 9 EMA at 716.26 and the 20 EMA at 716.13 essentially underneath current price, a tight alignment that shows upside momentum carried into the close.
Premarket Friday ran from 712.72 on the low to 714.43 on the high — Tuesday's open at 716.26 is above that entire premarket band, which adds another layer to the case that buyers controlled the end of that session. The prior day data is not available in the pack, so we can't reference PDH/PDL. We work off what we have.
The ATR intraday reads at 0.11, which is unusually compressed — worth noting as a potential artifact of the data point, not a read on expected range for Tuesday. In a negative GEX regime, assume the actual session range could expand meaningfully beyond that figure.
---
## 2. GEX (Gamma Exposure) — Negative GEX Regime, Trending Environment Expected
Total GEX on SPY is 53,689,313 — and importantly, spot at 715.17 is well below the zero gamma flip at 735. That puts us squarely in a negative gamma regime. Dealers are short GEX here, which means their hedging activity amplifies price moves rather than suppressing them. When price goes up, dealers buy more; when it goes down, they sell more. That dynamic fuels trends and discourages clean reversals.
The practical implication for Tuesday: don't fade strength expecting a quick snap back to VWAP. If the open holds above Friday's high and momentum continues, the next meaningful GEX resistance is the call wall at 720. That's the heaviest call GEX concentration in the structure and the first real speed bump on the upside. But in a negative GEX regime, even the call wall is not a guaranteed cap — it can be a pause before continuation rather than a hard ceiling.
On the downside, the put wall sits at 700 with the largest put GEX concentration in the structure. That's the gamma-defined floor, roughly 16 points below current price. There's also notable put GEX at 710, which clusters as an intermediate support zone if price pulls back intraday.
The key takeaway: the GEX regime says trade with the tape. If the open holds up, momentum longs are the primary setup. If price reverses hard and loses structure, the 710 zone becomes the first real downside test before anything more serious develops.
---
## 3. Key Intraday Levels
**Above price (716.26):**
* 720.00 — Call wall, heaviest call GEX concentration; first significant gamma-driven resistance on upside
* 725.00 — Secondary call GEX concentration, next level if 720 breaks cleanly
**Below price (716.26):**
* 716.13 — 20 EMA, immediate momentum support
* 716.26 — 9 EMA, coincident with current price; holding above this on a pullback keeps the trend intact
* 715.63 — Friday session high; a prior-session high now becomes the first support test on any gap-fade
* 714.41 — Opening range high from Friday / premarket high from Friday (coincident); losing this is meaningful
* 714.23 — Friday VWAP; reclaiming this on any dip is the line between pullback and trend failure
* 712.60 — Friday opening range low; break here opens the door to the 710 zone
* 710.00 — Intermediate put GEX concentration; significant downside support cluster
* 700.00 — Put wall, heaviest put GEX concentration; gamma-defined floor for the session
---
## 4. Scalp Setups — Watch For at the Open
**Long scalp — momentum continuation off the open.**
Watch for the open to hold above 715.63 (Friday's session high) on the first 5-minute bar. If price opens, pulls back briefly, and finds buyers at or above 715.63 with a green 5-minute close confirming the hold, that is the long trigger.
* Entry: 716.00, on the reclaim and hold above 715.63
* Stop: 714.97 (below Friday session high by a full point — gives room for noise without taking full heat back to VWAP)
* Target 1: 718.50 — midpoint between Friday high and call wall, partial here
* Target 2: 720.00 — call wall; trail stop to entry after T1 fills
* R:R: approximately 1:2.5 to T1, 1:4 to T2
* Skip if: the open gaps and immediately fades through 715.63 without a clean base forming, or if price loses 714.23 (Friday VWAP) in the first 30 minutes — that changes the intraday structure materially
**Short scalp — failure and flush through Friday VWAP.**
If price opens and rallies early but then rolls over and breaks cleanly through 714.23 (Friday VWAP) on a red 5-minute close with follow-through, the short is on. In a negative GEX regime, a VWAP failure can travel fast.
* Entry: 713.90, on the first 5-minute close below 714.23
* Stop: 714.70 (just above Friday VWAP — if price reclaims it cleanly, the setup is busted)
* Target 1: 712.60 — Friday opening range low, partial here
* Target 2: 710.00 — put GEX cluster; trail stop to entry after T1 fills
* R:R: approximately 1:1.5 to T1, 1:4 to T2
* Skip if: price doesn't close a full 5-minute bar below 714.23, or if the market gaps down aggressively at the open and you're chasing — this setup requires a clear fail from an elevated open, not a gap-down entry
---
## 5. Risk Levels — Where the Framework Breaks
The most important level in Tuesday's structure is the zero gamma flip at 735. We're trading 18+ points below it, which anchors the negative GEX regime and everything that comes with it — trending behavior, momentum validity, fade risk. If price somehow rallied to 735 and through it during Tuesday's session, the entire GEX framework shifts to positive gamma, and mean-reversion logic takes over. That is unlikely in a single session but worth knowing.
Within the day, losing 710.00 (intermediate put GEX) on meaningful volume would be the warning that the put wall at 700 is a realistic downside target, not just a theoretical floor. Don't underestimate how quickly price can travel to put walls in a negative GEX environment — dealer hedging accelerates the move, it doesn't dampen it.
On the upside, if 720.00 breaks and holds on a 15-minute close, respect the negative GEX regime and do not fade it. The next call GEX level is 725 — that becomes the new momentum target.
---
## Bottom Line
Tuesday sets up as a momentum session in a negative GEX regime with the call wall at 720 as the upside test and VWAP at 714.23 as the line in the sand — hold it and longs have room, lose it and the 710 cluster comes into view fast. Trade with the tape, not against it.
No hype. No bias. Just levels.
Trade safe. Plan ahead. Win together.
Still Waiting on the High Volume Reversal Bar — SPY Not There YeSPY continues to grind higher… but the high volume reversal bar still hasn’t printed.
That matters.
Because without that confirmation, this move can continue squeezing — even if it looks extended.
What’s interesting is that IWM has already shown the signal.
That tells you something:
👉 Institutions are starting to show their hand… just not across the entire market yet.
This is where traders get caught.
They see price stretched, they try to front-run the reversal, but without volume confirmation, it’s just guessing.
What I’m watching for on SPY:
• A true high volume spike at resistance
• Failure to continue after that spike
• Clear signs of absorption (not just rejection)
Until that shows up, this isn’t a confirmed reversal — it’s a setup in progress.
The Institutional Pivot Matrix already has the location mapped.
Now it’s about patience and confirmation.
👉 Location without confirmation = low probability
👉 Location + confirmation = trade
I’ll be tracking this live as it develops.
SPXL - 4/27/2026 High of prior day BO buy Per my SPY idea published on Sunday , seems like the less probable scenario 1 is occurring which requires me to buy back into the market . Lets see if it works out ... not the play I wanted to happen but maybe it will make me $$ still ..
5M chart shown on chart too for clarity which is what I actually bought this on today .