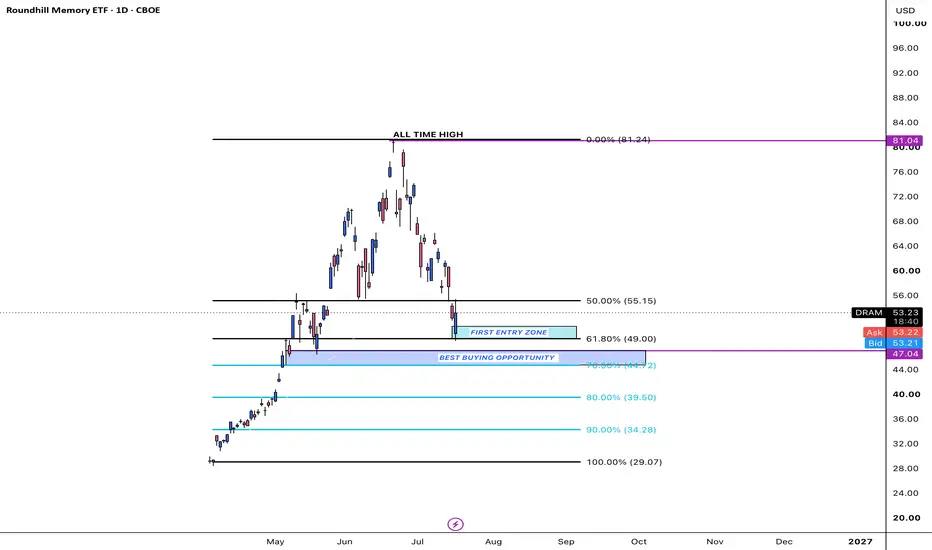
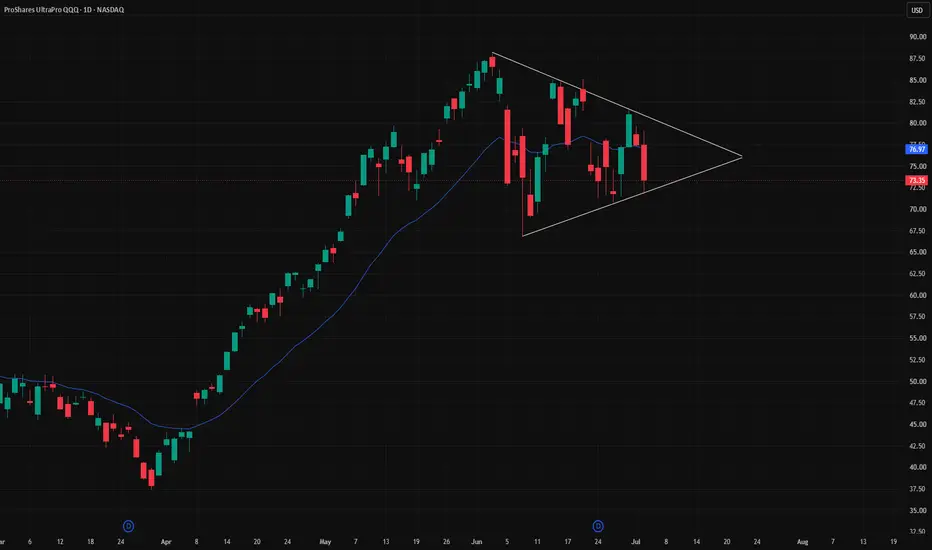
Markets Research 15.05.2026🌏 Markets:
AMEX:SPY -8.54 -1.14%(pre/m)
NASDAQ:QQQ -11.74 -1.63%(pre/m)
🆕 Economic News:
TRUMP LEAVES CHINA
Jerome Powell’s term as Fed Chair expires.
08:30 USA – NY Empire State Manufacturing Index
09:15 USA – Industrial Production MoM
📈 Gap Ups
Reaction to earnings/guidance:
NYSE:FIG NYSE:BOOT NASDAQ:STNE NASDAQ:HTHT
Other news:
NYSE:MICC announced additional share acquisitions by the company's management.
NYSE:FIG jumps after AI-powered growth lifts annual revenue forecast
NYSE:RDW / NYSE:HMC earnings second day
Experian Partners With NYSE:NOW to Scale Trusted Decisioning to Agentic AI
NYSE:TM files for approval on $2bn Texas assembly line expansion
NASDAQ:GEMI exchange raised $100 million in strategic investment from Winklevoss Capital at $14 per share.
📉 Gap Downs
Reaction to earnings/guidance:
NASDAQ:POET NASDAQ:DLO NYSE:INFQ NYSE:NU AMEX:USAS NASDAQ:AMAT NASDAQ:RUM NYSE:NGG
Other news:
NYSE:BW Announces Pricing of Common Stock Offering of 10,810,811 shares of its common stock at a price to the public of $18.50 per share, for gross proceeds of approximately $200 million
NYSE:BA shares closed down 5% yesterday, their biggest one-day drop since October 2025, even though Trump announced that China was ready to buy 200 aircraft.
-- Trump told Fox News that Xi initially wanted to buy 150 aircraft, but later decided to order as many as 200.
-- In reality, the expectation was that an agreement for 500 aircraft would be signed during the China visit.
‼️ Additional
THE CRYPTO MARKET STRUCTURE BILL, THE CLARITY ACT, PASSED A VOTE IN THE US SENATE BANKING COMMITTEE.
-- Next step: a vote in the Senate.
NYT: NASDAQ:NVDA future in China remains unclear after the Trump-Xi summit.
Trump said China did not buy NASDAQ:NVDA H200 chips despite US approval for the sale. He said China “chose not to” and wants to develop its own technology.
Trump: We did not discuss tariffs with Xi.
-- Trump said he will decide in the coming days whether to lift sanctions on Chinese oil companies that buy Iranian oil.
Axios: The CIA chief said the US is ready to cooperate with Cuba if reforms are implemented.
🏢 IPO
AMEX:VIDA – VIDA Global
Company is building an AI Agent Operating System for enterprise workflow automation. The idea is to help businesses automate internal workflows through AI agents. Business is still very early-stage, with minimal revenue and losses, so the stock is more of a speculative AI micro-cap than a proven software platform.
Price: $4.00
Shares: 3.75M
Raised: $15.0M
LTM:
Revenue: $0.55M
Net Income: -$2.9M
Comparable public companies: NYSE:AI , NYSE:PATH , NASDAQ:PLTR , NYSE:NOW , NYSE:BBAI
📋 List of tickers involved:
NYSE:FIG NYSE:BOOT NASDAQ:STNE NASDAQ:HTHT NYSE:MICC NYSE:RDW NYSE:HMC NYSE:NOW NYSE:TM NASDAQ:GEMI NASDAQ:POET NASDAQ:DLO NYSE:INFQ NYSE:NU AMEX:USAS NASDAQ:AMAT NASDAQ:RUM NYSE:NGG NYSE:BW NYSE:BA NASDAQ:NVDA AMEX:VIDA NYSE:AI NYSE:PATH NASDAQ:PLTR NYSE:BBAI
Best regards – hi2morrow team.
ETF market
XLE: Why a Failed Ceasefire Is Bullish for This ChartTrump just called Iran's latest offer "totally unacceptable" and the ceasefire is hanging by a thread. Energy quietly built a structure off the April lows that most traders haven't drawn yet. Here's the chart, the catalyst, and the exact level that decides whether this works or doesn't.
Climatic Exhaustion?Climatic Exhaustion?
Before I get silly comments, let me make one thing clear. I am not a semiconductor bear. If you look at my trade ideas you will see I was one of the very few that posted a trade idea for AMD when it was under $100, targeting the $450 region way in advance of us getting there. I told you to buy Tower Semiconductor at the lows. I was long ONTO innovation, AEHR semi and MPWR at the lows.
Aside from the AI trade, I told you to long privacy altcoins – the only altcoins that performed well this cycle. I know the AI sector extremely well, hence why I was buying when others are fearful, years before you clowns had heard of chatgpt. But I have been selling now that others are greedy.
In my humble opinion, we are witnessing a climatic exhaustion to the semiconductor trade. I am not calling the top here, I am not a fortune teller. However, I am pragmatic. I look at this move up in semis as a ticking time bomb.
There are a few danger signs you need to be wary of:
- The USD/JPY is at a double top – a spike in the Yen will negatively impact US equities (carry trade).
- We are in the fifth wave of this move, which started in March 2020
- We are at the golden ratio extension target
- RSI is at 85, last seen in 2018
- The war of choice, inflation spiking, rates may increase
We could literally go 40% either direction here. This could be a bear trap and the shorts continue to get squeezed. However, I favour a move down but I will not be placing money on it, that would be gambling. It’s hard to say if it will be a mid or late cycle drop, the latter will be catastrophic.
I’m watching this intently; I will not short this move but it will help me determine the next course of action in the market.
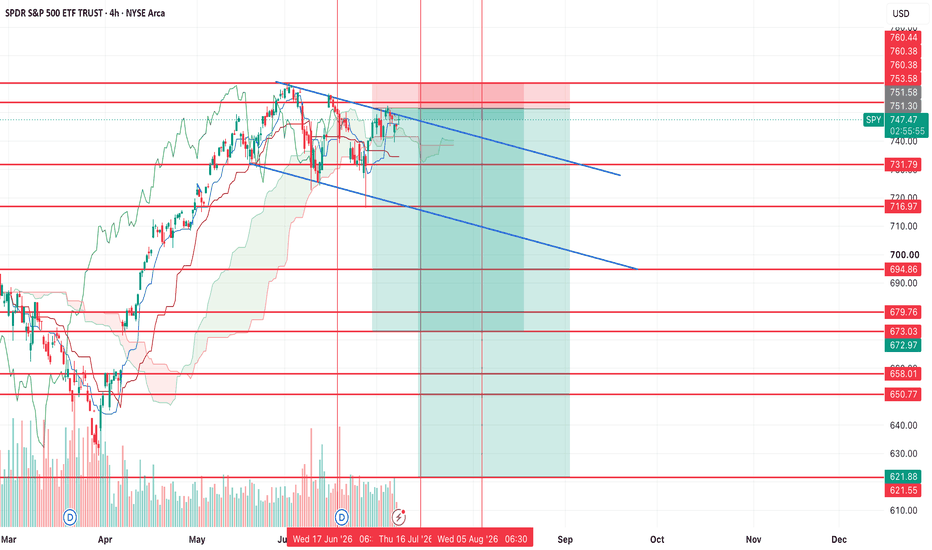
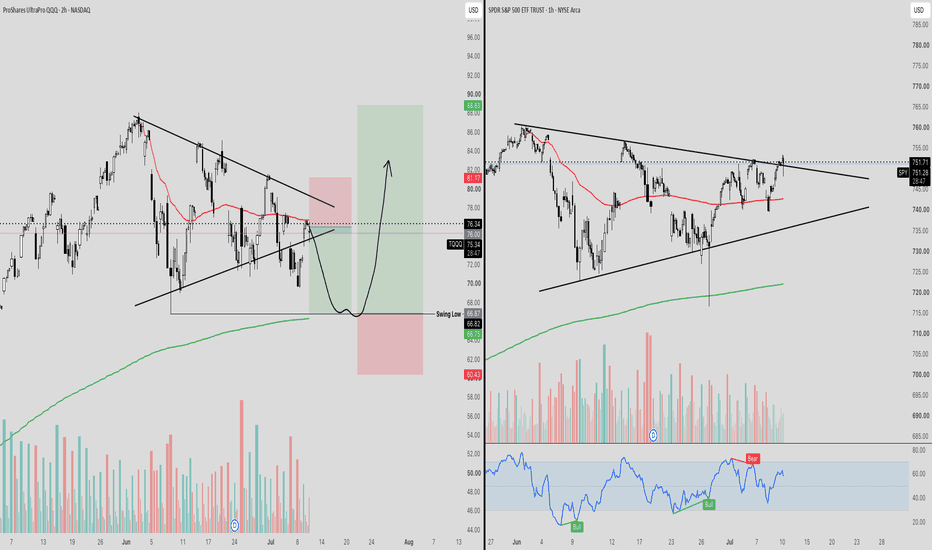
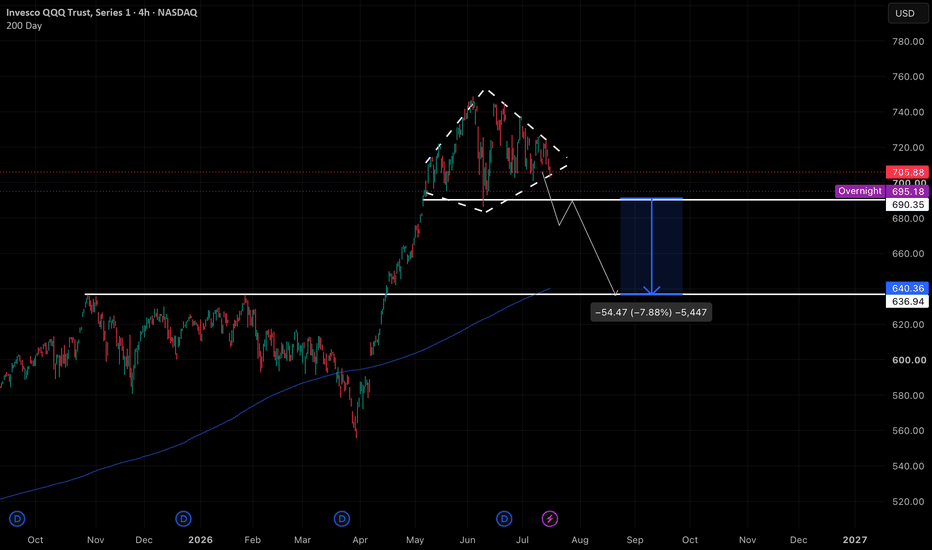
The big short $SPYI think it's finally time for the short to play out.
We've hit all key levels across many of the charts I'm watching and
SPY
hit an upper trend line (not pictured) on my other charts.
I think the next move from here is a 25-36% move from these highs.
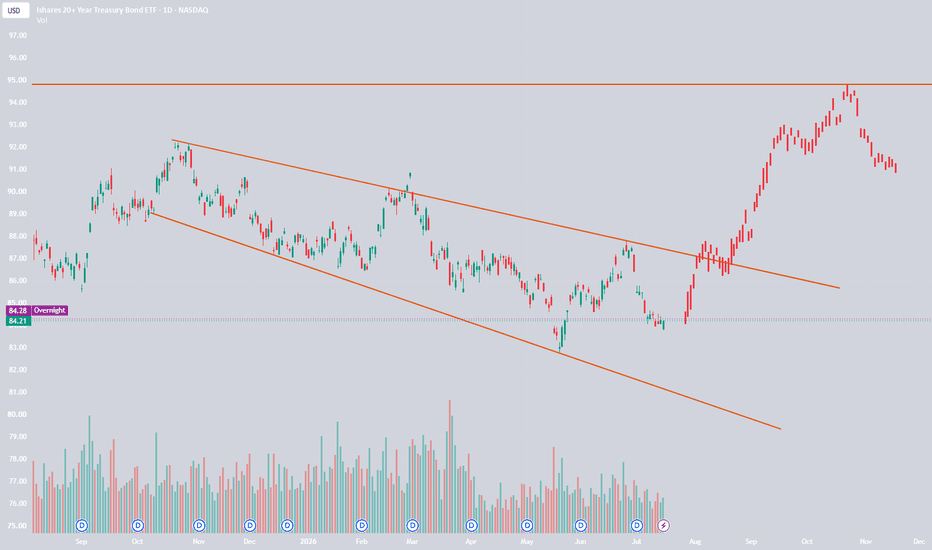
If you look at DXY, TLT and HYG they're already starting to show warnings. I've never been a believer that we're going to $800 on this move like many other people are posting about on X.
I've largely had a short bias from Jan-March, flipped bullish at the end of March and I posted today that I exited all of my longs.
Let's see if this final move plays out. This will be the best dip buy of the next decade if you have the cash to buy it, and it plays out.
Nasdaq Leadership ETF Holding Momentum Into Today's SessionCurrent Price: 721.68
Direction: LONG
Confidence level: 85%(Trader consensus remains unified across group metrics.)
Targets
Target 1: 725.50
Target 2: 730.00
Stop Levels
Stop 1: 716.80
Stop 2: 712.50
Wisdom of Professional Traders:
Here’s my take for TODAY only: the Nasdaq complex continues to trade with strong upward momentum driven primarily by mega‑cap AI leaders and institutional accumulation. When I combine the signals from professional traders on YouTube with X sentiment, the key pattern is clear — traders broadly expect continued intraday upside in the AI-heavy Nasdaq complex even though the market is technically overbought.
Several professional traders I tracked highlighted the same structural theme: AI infrastructure spending remains the dominant driver for the Nasdaq 100 in 2026. Companies like NVIDIA, Broadcom, Microsoft, Alphabet, and Amazon continue attracting institutional capital as hyperscalers scale AI compute. That leadership is showing up clearly in dark‑pool activity where large blocks accumulated QQQ, NVDA, AMZN, AAPL, and GOOGL simultaneously.
X sentiment adds another piece of the puzzle. While there are warnings about narrowing breadth, the majority of active trading commentary today still leans bullish. The real story here is liquidity and positioning: traders expect any dips to be bought quickly during TODAY’s session. Traders are especially watching potential catalysts tied to U.S.–China tech discussions and continued AI optimism, which are pushing Nasdaq futures higher.
So where does this leave us for TODAY only? The intraday bias remains LONG across the Nasdaq complex. The strategy is continuation trading — looking for moderate upside extensions within tight intraday ranges (generally 0.5–1.5%). However, the rally is stretched, meaning pullbacks toward support are likely to be bought rather than chased at highs.
Key Insights:
QQQ remains the clearest expression of mega‑cap AI leadership in the market right now. The ETF continues grinding higher inside a strong upward structure driven by Nvidia, Apple, Microsoft, and Alphabet. What’s interesting is that despite warnings about weak market breadth, the largest Nasdaq names continue attracting the majority of capital flows.
For TODAY only, the technical structure suggests continuation rather than reversal. The ETF recently re‑entered a bullish channel structure and traders are focusing on momentum continuation above the 720 area. As long as price holds above intraday support, the path of least resistance remains upward.
Another factor supporting the LONG bias today is institutional flow. Dark‑pool accumulation signals suggest large buyers stepped in aggressively in QQQ, aligning with visible exchange activity.
Recent Performance:
QQQ recently pushed to fresh highs after recovering from a short consolidation phase. The ETF has been trending upward consistently with tech stocks leading the broader market during the last few sessions.
Expert Analysis:
Several professional traders noted that QQQ’s price action is being driven almost entirely by AI‑related names. On X, many traders are pointing to continued upward momentum while acknowledging the rally is narrow. Even those cautious about breadth still expect upside continuation TODAY.
YouTube technical analysts also emphasized that dips toward support zones are likely to attract buyers rather than trigger a breakdown during this session.
News Impact:
Recent headlines highlighting AI spending and tech leadership continue supporting sentiment. Institutional accumulation in mega‑caps has reinforced bullish positioning for today's session.
Trading Recommendation:
For TODAY only, QQQ favors a LONG continuation setup as momentum remains strong.
Markets Research 14.05.2026🌏 Markets:
AMEX:SPY +2.63 +0.35%(pre/m)
NASDAQ:QQQ +1.76 +0.25%(pre/m)
🆕 Economic News:
Xi Jinping tells NASDAQ:NVDA , NASDAQ:TSLA and NASDAQ:AAPL CEOs that China will ‘open wider’
08:30 USA – Export/Import Prices
08:30 USA – Initial Jobless Claims
08:30 USA – Retail Sales
10:00 USA – Business Inventories
📈 Gap Ups
Reaction to earnings/guidance:
NYSE:FPS NASDAQ:CSCO NYSE:KLAR NASDAQ:ONDS NYSE:BN NYSE:VIK NYSE:HMC NASDAQ:VSNT NYSE:STUB NYSE:YETI NASDAQ:LGN TSX:AYA
Other news:
NASDAQ:POET and Lumilens today announced they have entered into a supply agreement that establishes a strategic joint development and commercial technology partnership to advance a new class of wafer-level photonic integration for frontier AI infrastructure.
NYSE:UMC Announces Release of 14nm eHV FinFET Platform, Advancing Innovation in Next-Generation Smartphone Displays
NYSE:WOLF shares extend rally after Citrini spotlights AI infrastructure potential / NYSE:WOLF is considered as one of the main candidates for a short squeeze, since its short float exceeds 50%.
NYSE:NOK shares jump after Cisco’s blowout quarterly print
NASDAQ:BIIB Topline Results from Phase 2 CELIA Study of Diranersen (BIIB080): First Study to Show Reduction in Tau Pathology and Cognitive Benefit in Patients with Early Alzheimer's Disease
NASDAQ:TTWO
NASDAQ:TTWO GTA 6 pre-order emails have reportedly been sent out to some with a pre-order window between May 18th and 21st
NASDAQ:MRVL Stock Climbs After AMD Reveals Surprise Stake in MRVL
NYSE:TSM raises global chip market forecast to $1.5 trillion as AI demand surges
Bessent expects large NYSE:BA orders during Trump’s visit to China.
📉 Gap Downs
Reaction to earnings/guidance:
NYSE:DOCS NYSE:BLSH NASDAQ:LWLG NASDAQ:FRMI NASDAQ:LUNR NYSE:SMFG NASDAQ:USAR NASDAQ:CLBT NASDAQ:TNGX
Other news:
New report shows NASDAQ:AMD and NASDAQ:ARM continue server share gains at NASDAQ:INTC expense
NASDAQ:CBRS set for debut in stock market gripped by AI mania / Competing chipmakers that bet on AI chips are falling: NASDAQ:QCOM NASDAQ:AMD NASDAQ:ARM
‼️ Additional
The meeting between Xi Jinping and Trump has ended in Beijing. It lasted a little over two hours.
-- Musk: Trump’s meeting with Xi Jinping went “wonderfully.”
-- Trump invited Xi Jinping to the US on September 24.
-- Xi Jinping confirmed that results were achieved in the China-US trade talks.
-- Trump said US-China relations will be better than ever before, trade will be fully reciprocal, and the US and China will have a fantastic shared future.
NASDAQ:NVDA has surpassed the entire Indian stock market in market capitalization.
-- NVIDIA CEO Jensen Huang expressed hope for successful business negotiations in China.
-- The US has cleared sales of NVIDIA H200 chips to 10 Chinese firms — RTRS.
Annual inflation in the US has been rising quickly since the start of the conflict with Iran.
-- BofA: Inflation is becoming very uncomfortable for the Fed.
-- Still, it remains at a relatively acceptable level. For example, wholesale prices in India rose 8.3% YoY in April after +3.8% in March, which is a much sharper acceleration in inflation.
Anthropic has overtaken OpenAI in enterprise adoption for the first time.
-- According to the Ramp AI Index, 34.4% of companies now use Anthropic, versus 32.3% for OpenAI.
-- Anthropic adoption has increased fourfold over the past year, while OpenAI grew by only 0.3%.
🏢 IPO
NASDAQ:CBRS – Cerebras Systems Inc.
Company designs AI processors, systems and cloud compute for AI training and inference. Its core product is the Wafer-Scale Engine, a very large AI chip built to reduce complexity versus massive GPU clusters. Main thesis is faster AI training/inference, lower power usage and demand from enterprises, cloud providers, sovereign AI programs and research institutions.
Price: $185.00
Shares: 30.0M
Raised: $5.55B
LTM:
Revenue: $510.0M
Net Income: $237.8M
Comparable public companies: NASDAQ:NVDA , NASDAQ:AMD , NASDAQ:AVGO , NASDAQ:MRVL , NASDAQ:SMCI
NYSE:EROK – EagleRock Land LLC
Company owns and manages land in the Permian Basin and collects royalties/fees from oil and gas production on its acreage. It controls about 236,000 acres across the Delaware and Midland sub-basins, plus additional acreage tied to water infrastructure assets. Core thesis is exposure to Permian drilling, surface use, water infrastructure and future power/infrastructure demand without being a direct oil producer.
Price: $18.50
Shares: 17.3M
Raised: $320.1M
LTM:
Revenue: $72.2M
Net Income: -$73.1M
Comparable public companies: NYSE:TPL , CSEMA:STR , NASDAQ:VNOM , NYSE:KRP , NYSE:BSM
🏢 Direct Listing
NASDAQ:AIAI – AIAI Holdings Corp.
Company plans to build an AI-driven holding platform using licensed proprietary AI from M2, an investment firm founded by chairman John Rochon. The structure is built around acquiring six very different businesses: construction, blockchain data validation, telehealth, edge analytics, healthcare case management and office/tech hardware resale. This is not a traditional operating company with one clear business line, but more of an AI-themed roll-up / holding structure.
Reference Price: $20.00
Shares: up to 69.5M
Raised: $0 — Direct Listing, no new capital raised
LTM:
Revenue: $272.0M
Net Income: -$159.7M
Comparable public companies: NYSE:AI , NYSE:BBAI , NASDAQ:SOUN , NASDAQ:PLTR , NASDAQ:TYGO
📋 List of tickers involved:
NASDAQ:NVDA NASDAQ:TSLA NASDAQ:AAPL NYSE:FPS NASDAQ:CSCO NYSE:KLAR NASDAQ:ONDS NYSE:BN NYSE:VIK NYSE:HMC NASDAQ:VSNT NYSE:STUB NYSE:YETI NASDAQ:LGN TSX:AYA NASDAQ:POET NYSE:UMC NYSE:WOLF NYSE:NOK NASDAQ:BIIB NASDAQ:TTWO NASDAQ:MRVL NASDAQ:AMD NYSE:TSM NYSE:BA NYSE:DOCS NYSE:BLSH NASDAQ:LWLG NASDAQ:FRMI NASDAQ:LUNR NYSE:SMFG NASDAQ:USAR NASDAQ:CLBT NASDAQ:TNGX NASDAQ:ARM NASDAQ:INTC NASDAQ:CBRS NASDAQ:QCOM NASDAQ:AVGO NASDAQ:SMCI NASDAQ:AVGO NYSE:EROK NYSE:TPL CSEMA:STR NASDAQ:VNOM NYSE:KRP NYSE:BSM NASDAQ:AIAI NYSE:AI NYSE:BBAI NASDAQ:SOUN NASDAQ:PLTR NASDAQ:TYGO
Best regards – hi2morrow team.
The Sovereign Surge: CPSE ETF's Multi-Year Structural BreakoutFundamental Drivers
The move toward the linear target of 138.32 is backed by strong macroeconomic tailwinds:
De-leveraging & Efficiency: Major constituents have undergone massive balance sheet cleaning and operational efficiency improvements over the last three years.
Dividend Yield & Value Re-rating: Traditionally viewed only as high-dividend "value traps," these companies are being re-rated as "growth" engines due to aggressive government CapEx in energy and infrastructure.
Energy Transition: With heavy weights in power and oil, these entities are the primary vehicles for India’s green energy transition, securing their long-term relevance.
Policy Continuity: Increased government focus on indigenisation (Atmanirbhar Bharat) provides a steady order book for engineering and manufacturing constituents.
Core Components by Weight
Here are the top holdings by weight:
20.3% — #NTPC (Power Generation)
19.1% — #PowerGrid (Power Transmission)
15.2% — #ONGC (Oil & Gas Exploration)
14.8% — #CoalIndia (Mining & Energy)
12.4% — #BEL (Bharat Electronics - Defense/Tech)
5.7% — #OilIndia (Energy)
4.3% — #NHPC (Hydro Power)
3.9% — #SJVN (Renewable Energy)
2.5% — #NLCIndia (Mining/Power)
1.8% — #CochinShipyard (Defense/Marine)
Technical Analysis Note
As seen in the chart, the "Big Breakout Level" at 106.99 marks the completion of a massive accumulation phase.
The "Initial Breakout" near the 96.00 handle served as the base for the handle formation, confirming strong absorption of supply before this latest leg up.
XLE: Elliott Wave & Geopolitical Macro AnalysisXLE remains structurally bullish, but it is now entering a zone where the distinction between sustained secular trend and late-stage geopolitical premium becomes critical.
Elliott Wave Structural View
From the 2020 Covid low, XLE appears to be tracing a highly credible long-term impulsive five-wave structure:
Wave 1: Initial recovery off the Covid capitulation low into 2021.
Wave 2: Deep corrective retracement, resetting sentiment.
Wave 3: Major impulsive expansion through 2021–2022, driven by inflation, commodity supercycle repricing, and the global energy shock.
Wave 4: Extended multi-year sideways consolidation from 2022–2025, consistent with classic fourth-wave behavior — more time correction than price destruction.
Wave 5: 2026 breakout above the consolidation ceiling, suggesting the final leg of the larger bullish cycle is now underway.
This breakout above prior resistance strongly implies that the Wave 4 base is complete, and the market has likely transitioned into a new bullish expansionary phase.
Technical Structure
XLE is currently trading above both major moving averages:
Fast EMA: ~50.37
Slow EMA: ~43.90
This confirms:
Positive long-term momentum
Institutional accumulation
Trend integrity remains intact
Key structural support zones:
Primary bullish support: 50–52
As long as price remains above this region, Wave 5 remains valid.
Major invalidation zone: 37.13
A break below this level would materially challenge the entire impulsive bullish thesis.
Elliott Wave Price Targets
If Wave 5 continues normally:
Base target:
62–65
Extended geopolitical premium scenario:
68–72
Commodity-related fifth waves often become highly emotional, driven by scarcity narratives, supply shocks, and speculative momentum. This means upside can accelerate sharply, but volatility and reversal risk also increase substantially near cycle maturity.
Geopolitical Macro Context
The broader geopolitical environment currently supports the bullish thesis:
Key drivers:
Iranian conflict and regional instability
Hormuz Strait disruption risk
Potential global supply chain interruptions
Strategic petroleum reserve limitations
OPEC+ supply discipline
Underinvestment in upstream production globally
This creates a sustained geopolitical risk premium in oil markets, directly benefiting XLE’s major holdings:
ExxonMobil
Chevron
ConocoPhillips
SLB
Williams Companies
XLE is not merely an oil proxy — it is effectively a leveraged play on U.S. energy security, production dominance, and capital rotation into hard assets.
Institutional Risk Considerations
Bullish case:
Continued Middle East instability
Elevated crude prices
Sticky inflation
Capital rotation away from overvalued growth sectors
Energy sector re-rating
Bearish case:
Iran ceasefire or de-escalation
Hormuz normalization
Global recession destroying demand
Political SPR intervention
Accelerated clean energy capital rotation
A genuine de-escalation could rapidly compress the geopolitical premium and trigger a sharp corrective pullback even without fully breaking the broader bullish cycle.
Tactical Outlook
Preferred institutional strategy:
Buy pullbacks into 52–50 support
Trend continuation above breakout highs remains valid
Avoid aggressive structural shorting unless key support fails
Bottom Line
XLE is likely in Wave 5 of a larger secular bullish structure, supported by both technical breakout and geopolitical energy repricing.
This remains a bullish market, but importantly:
It is no longer early-cycle.
Wave 5 environments can produce explosive gains, but they also carry:
Increased narrative saturation
Greater volatility
Higher reversal sensitivity
Core view:
Bullish trend remains intact until proven otherwise.
Strategic bias:
Buy dips, manage risk tightly, and monitor geopolitical headlines aggressively.
For now:
XLE represents one of the clearest institutional hard-asset bullish structures in global markets — but discipline is essential as late-cycle dynamics intensify.
Price Action Education Series: Descending Wedge PatternA descending wedge is a bullish pattern that often forms while price is still drifting lower, which is why many traders misread it at first.
At a glance, the chart looks bearish. Price is falling, momentum looks weak, and the market seems heavy. But in a true descending wedge, both trendlines slope downward and converge, meaning the range is tightening as price falls.
That tightening matters.
👉 Sellers are still pushing price lower
👉 Each push lower is becoming less effective
👉 The downtrend is losing force
That is what gives the pattern its bullish potential.
🧠 What the Pattern Looks Like
A descending wedge is built from:
• a falling upper resistance line
• a falling lower support line
• repeated price swings inside a narrowing range
The two lines are not parallel. If they were, the pattern would look more like a channel. A wedge is different because the compression itself is part of the message.
Price is still moving lower, but the market is no longer expanding downward with the same strength. That often signals seller exhaustion.
🔍 The Psychology Behind It
This pattern reflects a battle between weakening sellers and increasingly patient buyers.
As the wedge forms:
• weak holders keep selling
• bears remain active
• buyers begin absorbing at lower prices
• volume often starts to dry up
Each decline creates fear. Each bounce creates hope. Over time, fewer sellers remain aggressive enough to keep driving the market lower with authority.
That is why the descending wedge can become a bullish reversal setup. The market is still moving lower, but the quality of the selling pressure is deteriorating.
✅ What Confirms the Pattern
The pattern is not confirmed just because you can draw the lines.
A strong descending wedge usually includes:
• multiple touches on both trendlines
• clear convergence of the lines
• reduced activity during formation
• a decisive break above the upper resistance line
• ideally, stronger participation on the breakout
That breakout is the real signal. Until resistance breaks, the wedge is only a possibility.
📈 What Happens After Breakout
The breakout does not always lead to an immediate straight-up move.
Sometimes price breaks out and runs. Other times it breaks out, pauses, or lightly pulls back before continuing higher. That does not automatically mean failure.
A modest pullback after breakout can simply be the market testing whether the breakout level will now hold as support. The real warning sign is when price falls back inside the wedge.
🎯 Targets and Stops
A common way to estimate an upside target is to measure the height of the wedge at its widest point and project that distance upward from the breakout area.
Stops should also make sense structurally, such as:
• below the most recent important low
• below the lower wedge boundary
• below the post-breakout swing low
The goal is to define risk logically if the breakout fails.
🚨 Common Mistakes
Traders often misuse this pattern by:
❌ assuming every falling pattern is bearish
❌ entering before breakout confirmation
❌ ignoring whether the lines truly converge
❌ panicking over a normal post-breakout pullback
❌ confusing a retracement with a failed breakout
🔑 Bottom Line
📍 A descending wedge is a bullish reversal pattern
📍 It shows a falling market with weakening selling pressure
📍 The real signal is the break above resistance
📍 Small pullbacks after breakout can be normal
📍 A move back into the wedge is the real warning sign
📈 The message is simple:
price may still be falling, but sellers are running out of power — and once resistance breaks, the reversal can begin.
SEMICONDUCTORS: THE MOST CROWDED/ HYPED TRADES OF THE 2026Semiconductors go the market’s favorite battlefield in 2026 — a trade built on AI demand, inflation swings, geopolitics, and constant rotation between risk-on and risk-off.
NASDAQ:SOX , AMEX:SOXL , and AMEX:SOXS all matter here, but each tells a different story: the core trend, the leverage chase, and the contrarian hedge.
The semiconductor sector keeps attracting extreme attention because it sits at the intersection of growth, scarcity, and macro fear. When inflation expectations cool and liquidity improves, traders rush into chips as a high-beta growth proxy.
When geopolitical headlines intensify, supply-chain concerns, export restrictions, or war-related disruptions hit the tape, semis become one of the first sectors to reprice. That is why the trade stays crowded: everyone wants exposure to the same theme, but they are expressing it through different time frames and levels of risk.
Technically, NASDAQ:SOX is the anchor. It represents the broad semiconductor complex and is the cleanest way to read the sector’s underlying trend. When NASDAQ:SOX is trending above major moving averages and making higher highs with stable breadth, the bullish case remains intact. If NASDAQ:SOX loses trend support, the entire sector usually feels it quickly. In other words, NASDAQ:SOX is the confirmation chart, not the adrenaline chart.
AMEX:SOXL is the aggressive long version of that thesis. It is designed for traders who want amplified upside, but it demands discipline. Its technical strength shows up when breakouts are backed by strong volume, clean reclaim of prior resistance, and follow-through without immediate fade. In crowded conditions, AMEX:SOXL can move violently because it attracts momentum traders, breakout buyers, and fast money all at once. But it also punishes late entries, since leverage magnifies every pullback.
AMEX:SOXS is the inverse expression, and its chart often becomes a graveyard for overconfident bears. The setup works only when semiconductor momentum breaks hard and selling expands across the complex. Otherwise, AMEX:SOXS tends to decay as the sector grinds higher. On this chart, the long-term structure looks weak, which suggests the market has repeatedly preferred chip exposure over chip hedging. That makes AMEX:SOXS more of a tactical trade than a structural bet.
The real reason this trade stays so crowded is simple: semiconductors are no longer just another industry. They are the market’s shorthand for AI spending, memory cycles, GPU demand, data-center growth, SSD and RAM pricing, and the geopolitical struggle over technological control. Every new catalyst creates another wave of positioning.
Conclusion:
Semis are ultimately crowded because they combine narrative power with real earnings leverage. NASDAQ:SOX is the base trend, AMEX:SOXL is the momentum weapon, and AMEX:SOXS is the contrarian trap unless the trend truly breaks.
In 2026, this remains one of the market’s most emotional and hyped/ overowned trades.
--
Best wishes,
@PandorraResearch Team
MAGS Long 5/13/2026 Breakout and confirmation . MAGS is breaking out of a multi month but relatively comparatively "cleaner/tighter" base with nice price action . I took a position today will asses risk versus the breakout line.
best case scenario would be a longer term multi month cyclical hold period and worst would be a small loss under the breakout on failure . I prefer to use closes to asses this vs fixed stop , see recent action on Apple for a good example of that , we tested the breakout point the day after breakout .... but overall apple succeeded , NVidia succeeded after initially failing its first try google succeeded , and amazon is another bright star.
MAGS is a good way to get exposure to those guys and beautiful close today .
Momentum is still upI haven't been trading the SPX lately, but wanted to give an update. I'm very interested in Nat Gas here, for a swing trade into Summer. Oil still looks like it's consolidating and probably goes higher. Gold may also rally from here.
The Weekly RSI on SPX is showing multiple bearish divergences, but isn't in oversold territory yet.
The Epic Bond Capitulation - Where's The Bottom?Hooo boy, all those fund managers who were telling people to go balls to the walls on bonds earlier this year assuming interest rates would be lowered were truly addicted to the era of easy money. Some people have lost a lot recently. And it seems people are trying to now catch the falling knife (including myself, as I will explain).
In the above charts, you can see a popular long term bond ETF on the left (TLT), and long term bond yields on the right, inverted. The reason I inverted bond yields is so we can see more easily how the charts correlate. Looking at these two charts side by side, one can make a guess as to when bond prices may begin to find support. Right around here is a solid long term zone - but there is indeed room for TLT to drop into the mid-high 70's, or even the 60's if yields head towards 9-10%. Traders should be prepared for that.
Yields may indeed continue to push upwards past 5%. The U.S. economy can handle high interest rates. It's just that this is not what we're used to. It's also not necessarily true that a crash MUST happen soon, even considering I have been bearish on traditional markets for the last few years. But maybe that COVID crash was really it, at least for now. Sure, the amount of consumer and national debt is concerningly high. I don't think anyone would be surprised if the market had a huge meltdown, given current economic conditions. Under current circumstances, the likelihood of a black swan market event only increases. However, people would probably be surprised if it did extraordinarily well, and if bond yields continued way up. This is what's often called, "Climbing a Wall of Worry."
There were indeed periods when yields were above 9% and the market still grew. We're just not used to it, so all this repricing must occur. And it's quite the shock.
It's hard to parse out exactly what's going on. But it's possible we are about to finally see "authentic" growth from the stock market, meaning that it increases DESPITE tightening monetary policy. This is actually healthier market growth. In the midst of this, we'd also ideally like to see improved infrastructure and pay increases.
Now of course, if SPX heads below the recent lows, markets could be in trouble, but that remains to be seen.
I have begun entering TLT here, but I do acknowledge that there is further room to fall, perhaps as much as 30% from current levels. The volume looks like capitulation, so even if they fall further we may be due for a relief rally.
As always, this is not meant as financial advice. This is for speculation and entertainment only. I am really winding down my posts on here. If you'd like to stay updated about what I'm doing, please feel free to reach out.
-Victor Cobra
IWM: Day Trade ($IWM 15M Day Trade — May 13, 2026 10:10 ET)AMEX:IWM 15M Day Trade — May 13, 2026 10:10 ET
Overnight low $279.08 tagged EQL zone clean. Two strong green candles reclaimed $280 + daily 20 SMA. Currently $281.09 sitting at 0.447-0.541 fib of yesterday's drop.
Bounce active. Bounce-only thesis — not a swing.
Levels:
▪ Entry zone: $280.73-281.24 (current ATM fib)
▪ T1: $282.59 (0.786 fib + Equilibrium)
▪ T2: $283.01 (ORB high)
▪ T3: $285.05 (1.236 fib + prior horizontal)
▪ T4 stretch: $286.50-287.00 (Premium / Strong High)
▪ Stop: $279.50 (below today's EQL)
▪ Invalidation: 15m close < $280 = exit
Trigger: 15m close > $281.24 confirms momentum. Volume confirmation required — green candles fading would warn.
R:R to T2: 1.2x (tight, scalp only)
R:R to T3: 2.5x (target if confirmed)
Flow context honest:
Open flow (10am snapshot) showed IWM degraded from +14% bullish at the bell to +5% noise. $3.20M $269P 36DTE sold at bid defended the floor. But $4.38M $267P 36DTE bought at ask added NEW bear protection. Net: institutions defended downside while adding insurance.
This is a bounce in a degrading tape, not a thesis reversal. Day-trade only. No swings until $283 reclaims with volume.
Macro overhang: Hot PPI 1.4% MoM, Dow -0.5% premarket open. Small-caps are rate-sensitive — every bounce is on a clock until summit/CSCO catalysts clear.
Process over prediction. Risk-first, always.
Not investment advice.
HOW-TO: Use Key Levels From The Dobrusky Price Action EngineHOW-TO: Use Key Levels From The Dobrusky Price Action Engine
This post breaks down how I think about level hierarchy inside the Price Action Engine.
The main idea is simple: not all levels matter equally.
Higher-timeframe levels usually matter more for context, thesis, and larger targets. Lower-timeframe levels are usually more useful for precise intraday execution.
The mistake is treating every plotted line the same. A monthly level, weekly level, previous day high, daily gap, pivot, and close should not all be interpreted with the same weight.
Main concept: higher timeframe for context, lower timeframe for execution
In general, I separate levels into two broad categories:
Higher-timeframe levels: better for market context, daily thesis, and larger targets.
Lower-timeframe levels: better for precise entries, stops, and intraday trade location.
A higher-timeframe level can be very important, but that does not automatically make it a good entry level.
The reason is precision.
On an intraday chart, price may overshoot or undershoot a major higher-timeframe level before reacting. That can make it harder to define a clean entry, stop, and risk-to-reward.
Lower-timeframe levels are usually more actionable because price often interacts with them more precisely.
That does not make them more important overall. It just makes them more practical for execution.
Why hierarchy matters
Level hierarchy helps answer a few practical questions:
Which levels matter most for the bigger picture?
Which levels are realistic targets?
Which levels are precise enough for entries?
Which levels should stay visible, and which ones are just adding clutter?
Without hierarchy, the chart becomes a mess of equal-looking lines.
That creates a problem because every level starts to look important.
A useful chart should make it clear which levels are for context, which levels are for execution, and which levels are only secondary references.
How the levels are visually separated
The level styling is meant to make the hierarchy easier to read at a glance.
Monthly levels are larger dashed lines because I use them mainly for context, thesis, and larger targets, not direct intraday entries.
Weekly levels are solid and slightly wider than daily levels because they are important higher-timeframe reference points, but still actionable enough for intraday setups.
Daily levels are solid because they are some of the most actionable intraday reference points.
Daily gap ends are solid because I treat them as more actionable for entries.
Daily gap starts are dashed because I usually treat them more as targets or context.
Open levels are orange so current day, week, and month opens are easy to identify.
Close levels are dotted and yellow because I treat closes as secondary reference levels, not primary entry levels.
Pivot levels are dotted. Their colors vary, and their width corresponds to the timeframe or strength of the pivot.
The styling does not mean a level is automatically tradable.
It is only a visual shortcut for how I personally rank the levels.
In simple terms:
Solid levels are generally more actionable.
Dashed levels are usually more for context or targets.
Dotted levels are usually secondary references.
Wider levels generally represent more important higher-timeframe levels.
Yearly and quarterly pivots
Yearly and quarterly pivots are mostly higher-timeframe context levels.
I do not normally use them for intraday trading.
They can be useful for understanding the larger market structure, especially on weekly or higher-timeframe charts. They can also become useful when price is near all-time highs and there are no obvious nearby targets above.
That is the main exception.
If price is pushing into an area with no clear overhead structure, a nearby yearly or quarterly pivot can become a reasonable target reference.
But most of the time, I do not want those levels crowding my intraday chart.
A practical rule:
Use yearly and quarterly pivots for broad context.
Do not use them as normal intraday entry levels.
Consider them as targets only when there are no better nearby levels.
Keep them hidden when they are not relevant to the current price.
Monthly levels
Monthly levels are some of the most important levels on the chart from a big-picture standpoint.
They can help with:
Overall market context
Daily thesis
Larger targets
Understanding where price is relative to major structure
But I do not personally enter directly off monthly levels.
They are important, but they are not usually precise enough for the way I structure intraday trades.
A monthly high, monthly low, or current month open can matter a lot. Price may react around it, reject it, accept beyond it, or use it as a magnet.
But for actual entries, I would rather use a more actionable level nearby, such as a weekly level, daily level, gap end, or volume level.
Monthly levels are major context.
They are not my preferred execution levels.
Weekly levels
Weekly levels are a middle ground between higher-timeframe context and intraday actionability.
They still carry meaningful weight, but they are usually more practical for entries than monthly levels.
Examples include:
Previous week high
Previous week low
Current week open
These levels can be useful because they are meaningful higher-timeframe reference points, but they are often close enough to current price to matter intraday.
This is why I treat weekly levels as more actionable than monthly levels.
Weekly levels can be used for:
Trade location
Daily thesis context
Targets
Reversal areas
Breakout or failed breakout context
A weekly level is not automatically tradable, but it is often one of the first areas I care about when building an intraday plan.
Daily levels
Daily levels are where the chart becomes more actionable for intraday trading.
These are some of the levels I most often use for actual trade entries.
Examples include:
Previous day high
Previous day low
Current day open
Previous day close, depending on context
Daily gap levels
Daily levels are useful because they are close enough to current intraday price action to create clearer trade structure.
They can help define:
Where a signal is occurring
Where a stop may need to go
Where the nearest meaningful target is
Whether price is accepting above or below an important intraday reference point
The key is still context.
A signal near a daily level is more useful when it aligns with the broader thesis, market structure, and risk-to-reward.
Daily gaps
Daily gaps are more nuanced because I do not treat the gap start and gap end the same way.
In my process:
The daily gap end is more actionable for entries.
The daily gap start is more useful for targets or context.
This is why the two sides are visually separated.
The gap end is shown as a solid level because I treat it as the more actionable side.
The gap start is shown as a dashed level because I usually treat it more as a target or context area.
A daily gap level should not be treated as guaranteed support or resistance.
It is simply a reference point that can matter when price returns to that area.
Daily volume levels
Daily volume levels are also part of my hierarchy.
I use them for both entries and targets, but I still compare them against the broader level structure.
For example, if there is a daily volume level nearby, but a previous week high is not much farther beyond it, the previous week high may be the more important overall target.
That is the point of hierarchy.
A closer level is not always the better final target.
Sometimes it is only the first target or trim area. A more important level slightly farther away may be the better, larger reference point.
Pivots and closes
Monthly pivots, weekly pivots, daily pivots, and previous closes can all be useful, but I usually treat them as secondary.
I do not normally enter directly off pivot levels or close levels.
I am more likely to use them as targets when there are no stronger nearby levels.
This includes situations where:
Price is near all-time highs.
There are no obvious prior highs or lows nearby.
There are no clean gap levels nearby.
The chart lacks better structure.
Pivots are useful when needed, but I usually do not keep every pivot visible because they can add too much clutter.
The same applies to closes.
Previous closes can matter, but I generally prioritize highs, lows, opens, gaps, and more obvious structural levels first.
A practical rule:
Use pivots and closes as secondary references.
Do not treat them as primary entry levels.
Turn them on when the chart lacks better nearby targets.
Keep them off when they make the chart harder to read.
My practical level hierarchy
This is the simplified way I think about the hierarchy:
Yearly and quarterly pivots: broad context, rarely used intraday.
Monthly levels: important context and larger targets, not direct entries for me.
Weekly levels: important middle-ground levels, useful for context, targets, and possible entries.
Daily levels: highly actionable for intraday entries and targets.
Daily gap ends: more actionable for entries.
Daily gap starts: more useful for targets and context.
Daily volume levels: useful for entries and targets, but still ranked against nearby higher-priority levels.
Pivots and closes: secondary targets when no better levels are nearby.
This is not about memorizing a perfect ranking.
It is about knowing what role each level plays.
Some levels are for context.
Some levels are for entries.
Some levels are for targets.
Some levels are only worth showing when the price is actually near them.
How I use this in practice
My general process is:
Start with the higher-timeframe context.
Identify the major levels that could influence the day.
Drop down to the intraday chart.
Focus on the levels that are close enough to be actionable.
Wait for price action or a signal near a meaningful level.
Make sure the trade has a logical target and acceptable risk-to-reward.
I am usually looking to trade toward the nearest meaningful level.
In some cases, I may trim at the nearest meaningful level and try to hold part of the trade for a larger higher-timeframe target.
But the first target still matters.
I do not want to enter a trade without knowing where the nearest meaningful level is.
That target helps determine whether the trade is even worth taking.
Example framework
A simple short setup might look like this:
Price is below an important weekly level.
The daily thesis supports looking for shorts.
Price pulls back into a meaningful level.
A valid signal forms near that level.
The entry is placed where the risk-to-reward makes sense.
The stop goes beyond the swing and beyond the level.
The first target is the nearest meaningful level below.
For the entry itself, I may use a basic retracement such as the 50% or 61.8% area of the signal move.
There is nothing complicated about that.
The point is not to chase the signal.
The point is to enter at a location where the stop, target, and risk-to-reward make sense.
If the nearest meaningful level is too close and the trade does not offer enough room, then the setup may not be worth taking.
Targets and trims
Targets should come from meaningful levels, not random reward multiples by themselves.
Risk-to-reward matters, but the target still needs to make sense on the chart.
A practical target process is:
Find the nearest meaningful level in the trade direction.
Check whether the trade offers acceptable risk-to-reward to that level.
If there is a larger level beyond it, consider trimming at the first level and holding part for the larger target.
If there is no clean target, skip the trade or reduce expectations.
A nearby level can be a full exit or a trim area.
That depends on the setup, the strength of the thesis, and how much room exists beyond the first target.
The key point is that I do not want to trade without a target.
What this is not
Level hierarchy is not a prediction system.
A higher-ranked level is not guaranteed to hold.
A lower-ranked level is not automatically irrelevant.
A signal at a level is not automatically a trade.
The hierarchy is only a way to organize information so the chart is easier to read and decisions are more consistent.
The trader still has to judge context, entry location, stop placement, target quality, and whether the setup fits the plan.
Risk and limitations
All levels can fail.
Price can overshoot a level, break through it, reverse before reaching it, or ignore it completely.
Higher-timeframe levels may matter more overall, but they are not always precise enough for intraday entries.
Lower-timeframe levels may be more actionable, but they usually carry less weight.
That trade-off is the entire reason hierarchy matters.
The goal is not to find perfect levels.
The goal is to know which levels are most relevant for context, which ones are most useful for execution, and which ones should probably stay off the chart unless price is near them.
Closing
A clean level hierarchy keeps the chart usable.
Higher-timeframe levels help define context and larger targets.
Lower-timeframe levels help define entries, stops, and more immediate targets.
Pivots and closes can be useful when there are no better nearby levels, but they do not need to clutter the chart all the time.
Once the key levels are organized, the next step is understanding signal hierarchy: which signal types matter most, which ones need more confirmation, and how signals should be interpreted around these levels.
21st-Century Scammers, or How Cathie Wood Fed Everyone Fire WoodIn the modern financial arena, the loudest conviction often commands the most attention, yet the market remains stubbornly indifferent to how well a story is told. Cathie Wood, the face of innovation-led investing, famously declared that her portfolios would more than triple over a five-year horizon. However, as of May 2026, the divergence between that bold prophecy and the cold reality of the charts is impossible to ignore.
The visual contrast is staggering. As shown in the attached chart, the blue line representing the NASDAQ:QQQ — a benchmark for Nasdaq-100 innovation—has consistently outpaced the orange line of the ARKK ETF. While QQQ has delivered robust compounding, ARKK has struggled through a cycle of volatility and significant underperformance, leaving retail investors to wonder where the promised alpha went.
The disparity is compounded by the structural reality of the fees. Investors in QQQ benefit from a lean expense ratio of approximately 0.20%, allowing more of their capital to work within the market. In contrast, those tethered to ARKK have paid a premium 0.75% expense ratio for returns that have failed to justify the cost.
This situation illustrates a classic 21st-century trap: the conflation of vision with performance. In the age of social media, an articulate pitch can generate billions in inflows, but those inflows do not equate to asset appreciation. When the "Fire Wood" settles, we are left with the basic arithmetic of investing: hype is a fleeting commodity, but management fees are permanent.
For the trader or long-term investor, the lesson is clear: verify the narrative against the net-of-fee performance. While Wood continues to forecast a "Goldilocks" boom, the performance gap between her funds and standard index trackers suggests that being a visionary is secondary to being a prudent allocator.
SATO momentum building as whale activity fuels upsideCurrent Price: 19.19 (Analysis was generated on Monday Morning)
Direction: LONG
Confidence level: 70%(Strong bullish X sentiment (majority bullish posts) and positive whale profit news, but missing professional trader video analysis reduces confidence slightly.)
Targets
Target 1: 20.15
Target 2: 20.72
Stop Levels
Stop 1: 18.60
Stop 2: 18.20
Key Insights:
Here's what's driving this setup. Social sentiment across trading conversations is clearly leaning bullish. The majority of trading‑related posts tracked are pointing toward buying pressure rather than selling pressure. When you see a heavy imbalance like that—especially without visible bearish chatter—it usually means traders are anticipating continuation rather than exhaustion.
Another factor worth watching is whale activity. Recent on‑chain commentary highlighted a large wallet that flipped a significant loss into a six‑figure profit after accumulating during the dip. That narrative matters more than it might seem at first glance. In crypto markets, profitable whale stories often attract copycat momentum trades, and that can accelerate price moves quickly.
The structure of SATO’s pricing model is also interesting. Instead of relying purely on a standard AMM, the token uses a bonding‑curve pricing mechanism through smart‑contract hooks. That design can amplify upward moves when demand increases because price reacts directly to reserve inflows.
Recent Performance:
SATO has been extremely volatile over the past several sessions, with large swings in liquidity flows and aggressive trading activity. Reports show rapid reserve growth early in its lifecycle and a push toward new highs shortly after launch. This type of early‑stage volatility is typical for experimental on‑chain assets, but it also means momentum phases can be sharp and fast when sentiment flips bullish.
Expert Analysis:
Looking at trader behavior, the key takeaway is momentum alignment. The trading community is leaning toward accumulation rather than distribution. Social data shows a strong imbalance of bullish signals versus bearish commentary, suggesting traders expect continuation higher.
What I’m watching technically is whether the price can push through the psychological $20 region. That level sits just above the current price and acts like a magnet in short‑term trading. If SATO clears that zone with volume, it could quickly test the next cluster near $20.70 during the next several trading sessions.
News Impact:
The most important narrative catalyst right now is the whale profit story circulating through crypto media channels. These stories often spark speculative attention because traders interpret them as proof that large players are positioning successfully. Combined with broader optimism across risk assets in crypto markets, the news flow currently favors upward momentum rather than risk‑off behavior.
Trading Recommendation:
Here's my take: the momentum and sentiment skew point toward a short‑term continuation move. I’m taking a LONG position around the current price of $19.19, targeting a push toward $20.15 first and potentially $20.72 if momentum accelerates this week. Risk should be managed tightly because volatility is high, with protective stops placed near $18.60 and $18.20. If price holds above $19 and sentiment stays positive, the setup favors a continuation rally over the next several trading days.
USO Likely to Pull Back After Momentum Stall Near ResistanceCurrent Price: 133.59 (Analysis was generated on Monday Morning)
Direction: SHORT
Confidence level: 85%(Trader consensus remains unified across group metrics.)
Targets
Target 1: 131.20
Target 2: 128.90
Stop Levels
Stop 1: 135.40
Stop 2: 137.10
Key Insights:
USO has pushed higher alongside crude futures, but the ETF is now sitting in a zone where momentum has clearly slowed. The move into the $133–$135 area came quickly, and what's interesting is that volume hasn’t expanded with the latest push. That often signals a rally that’s running out of buyers.
Technically, the ETF is extended from short‑term moving averages, and several traders I follow pointed out that USO is starting to show intraday rejection wicks near the highs. When that pattern appears near a resistance cluster, it usually means sellers are stepping in earlier than expected.
Another factor is positioning. Commodity ETFs tend to react quickly when crude futures start pulling back, and because USO tracks front‑month exposure, even a modest drop in WTI can translate into a sharper short‑term decline in the ETF.
Recent Performance:
Over the past couple of weeks, USO rallied strongly as crude pushed toward the mid‑$90s. However, the last few sessions show smaller daily ranges and fading upside follow‑through. Instead of continuation buying, the ETF has been chopping sideways near highs — often a sign of distribution before a short-term correction.
Expert Analysis:
YouTube traders covering commodities this week aren’t aggressively bearish, but many of them highlighted the same thing: crude is at a technical ceiling. A few macro-focused channels noted that positioning from funds appears crowded on the long side after the recent rally.
On X, sentiment is mixed but slightly cautious. The shift is subtle — fewer posts calling for $100 oil immediately and more discussion about pullbacks toward the low $90s in WTI. When that tone shift happens while price stalls, it often precedes a short-term retracement.
News Impact:
Recent headlines around supply risks and geopolitical tensions helped drive the initial rally, but markets appear to have priced much of that in. Meanwhile, chatter about possible inventory builds and slower global demand growth in late 2026 is starting to creep into trader discussions, which can cap upside in the near term.
Trading Recommendation:
I’m looking for a short‑term fade in USO this week. If crude futures soften even slightly, USO could quickly retrace a few dollars from current levels as momentum traders lock in profits.
Markets RESEARCH 13.05.2026🌏 Markets:
AMEX:SPY (pre/m)
NASDAQ:QQQ (pre/m)
🆕 Economic News:
US Senate confirms Kevin Warsh as Chair of the Federal Reserve
08:30 USA – Core PPI MoM
10:30 USA – EIA Crude Oil/Gasoline Stocks Change
📈 Gap Ups
Reaction to earnings/guidance:
NASDAQ:EOSE NASDAQ:NXT NASDAQ:TSEM NASDAQ:NBIS NASDAQ:GLBE NYSE:VSH NASDAQ:TRMD NYSE:OKLO
Other news:
NASDAQ:NVDA rises after Trump says Huang joined China delegation
NYSE:WOLF stock was surging on Wednesday after Citrini Research—best known for its viral blog posts about AI wrecking the economy and the Strait of Hormuz—recommended the power-chip maker.
NYSE:COHR Coherent price target raised to $400 from $365 at BofA / Trump is bringing Jim Anderson (CEO of NYSE:COHR ) to China
NASDAQ:HIMX NASDAQ:PENG NASDAQ:MRAM chips pump
NASDAQ:AAOI today announced it is working with Mediacom to accelerate the upgrade and continued expansion of its fiber and coax network infrastructure.
NASDAQ:LUNR Stock Gains After Announcing US Space Force Surveillance Contract / Space sector rising NASDAQ:RKLB NASDAQ:ASTS
EURONEXT:ORA “Champions Campaign” with exclusive offers and an exceptional customer experience
Robinhood Ventures Fund I ( NYSE:RVI ), the brokerage company’s inaugural fund that aims to give retail investors exposure to pre-IPO companies like OpenAI and Stripe, rose more then for 130% in 4 days
NASDAQ:GOOGL is in talks with SpaceX about launching data centers into orbit — WSJ.
📉 Gap Downs
Reaction to earnings/guidance:
NASDAQ:WIX NASDAQ:WRD NYSE:BIRK NYSE:DT NYSE:BABA NASDAQ:ATAT NYSE:REZI NYSE:KRMN NYSE:DT NYSE:BIRK
Other news:
NASDAQ:AEP announced the commencement of a registered underwritten offering of $2.6 billion of shares of its common stock.
NASDAQ:MELI downgraded to NEUTRAL by Citigroup
NASDAQ:NICE Is Maintained at Neutral by Citigroup/ price Target Cut to $100.00/Share From $119.00
-- NASDAQ:NICE Is Maintained at Overweight by Morgan Stanley / Price Target Cut to $130.00/Share From $148.00
n8n, a provider of AI workflow orchestration technology, has reached a $5.2bn valuation following a strategic investment by $SAP.
A federal judge in Manhattan on Tuesday said Palantir Technologies $PTLR must arbitrate claims that three of its former engineers used the software company's secret information to launch "copycat" firm Percepta AI, instead of pursuing the case in court.
NASDAQ:WOK Collaborates with Novabioplus to Unlock Biological Data Value with AI, Advancing the “BioToken” Assetization Model
‼️ Additional
Trump has arrived in China.
A US appeals court temporarily allowed the Trump administration to collect the global 10% trade tariff.
Morgan raised its S&P 500 year-end 2026 target to 8,000 from 7,800.
Retail demand for call options on US Big Tech stocks has surged to extreme levels last seen during the 2021 meme-stock mania — CBOE data.
US Federal Budget Balance, April: +$215B vs +$157.2B expected / -$164B previous.
🏢 IPO
NASDAQ:FRVO – Fervo Energy Co.
Company develops enhanced geothermal systems (EGS) to generate electricity. Its technology uses horizontal drilling and hydraulic fracturing to access underground heat in locations where traditional geothermal power would not normally work. Core thesis is clean baseload power for rising electricity demand, especially from data centers and industrial users.
Price: $27.00
Shares: 70.0M
Raised: $1.89B
LTM:
Revenue: $0.14M
Net Income: -$57.8M
Comparable public companies: EURONEXT:ORA , NYSE:GEV , NYSE:NEE , NASDAQ:CEG , NYSE:BE
NYSE:GMRS – GMR Solutions
Company provides emergency medical services and alternate-site care in the U.S. Its business includes ambulance services, air medical transport, non-emergency transportation, disaster response and event medical support. The company has a massive operational footprint, but the IPO was priced sharply below the original range, which signals weaker demand from investors.
Price: $15.00
Shares: 31.9M
Raised: $478.7M
LTM:
Revenue: $5.74B
Net Income: $206.2M
Comparable public companies: SEED_ALEXDRAYM_BIGMAC:MODV , NYSE:SEM , NASDAQ:OPCH , NASDAQ:ADUS , NYSE:HCA
📋 List of tickers involved:
AMEX:SPY NASDAQ:QQQ NASDAQ:QUBT NYSE:PACS NASDAQ:ZBRA NYSE:SE NYSE:VG NASDAQ:ETOR NYSE:TME NYSE:RAL NASDAQ:RGTI NYSE:QBTS NASDAQ:FIGR $Q NASDAQ:JD NASDAQ:POET NYSE:CRCL NASDAQ:COIN NASDAQ:MSTR NASDAQ:PSIX NYSE:HIMS NASDAQ:ASTS NYSE:UAA NASDAQ:CLSK NYSE:ONON NYSE:AG NASDAQ:CAMT NASDAQ:EBAY NYSE:GME NASDAQ:GTLB NASDAQ:VOD NASDAQ:NVTS NASDAQ:TSLA NYSE:BLK NYSE:GS NASDAQ:META $V NYSE:MA NASDAQ:CSCO NASDAQ:AAPL
Best regards – hi2morrow team.