15-22% Annualized Return in a 2 year TLT Swing Trade? Targets are 100 and 110 respectively. I'm supposing that the yields will drop significantly within the next 2 years (by Dec 2028) and that long bonds will make a 30-42% recovery from current levels (apprx $82). TLT is paying nearly 5% dividend at these levels, I didn't factor in compounding.
Strategy one: Allocate 5% of portfolio to TLT and hold for 2 years, with 5% yield, your break even is theoretically $72 if you hold for 2 years. I don't suggest this strategy.
Strategy two: Allocate 2.5% of portfolio to an initial position around $80, then DCA over the next two years (this allows you to catch any significant drops and improve your cost).
I'm am following strategy two with a more aggressive total allocation goal of 10% of my portfolio.
If you must know, I'm also long quality SaaS (ADBE, INTU, CRM), payment services integrating Blockchain (V, PYPL, COIN), layer 1 and 2 crypto itself (LINK, ETH, SOL, etc), and finally nuclear power generation (VST, and indexes).
May the Lord Jesus bless and keep you.  Long
Long
Dealer Positioning Reinforces the Selloff Toward the $760 DESSPY is selling off aggressively, and current dealer positioning is reinforcing the downside move.
With SPY trading near $761.66, sell-side hedging pressure is visible across nearly every nearby strike. The strongest concentration sits at $760, which is also the current Dominant Exposure Strike (DES), with approximately $4 billion in potential dealer selling.
This makes $760 the immediate downside magnet.
Notable positioning includes:
• $765: approximately $1.1 billion in potential selling
• $763: approximately $1 billion in potential selling
• $761: approximately $1.1 billion in potential selling
• $760 DES: approximately $4 billion in potential selling
• $757: approximately $945 million in potential selling
This positioning helps explain why the decline is accelerating instead of immediately stabilizing. As price moves lower, dealer hedging activity may require additional selling, reinforcing the existing momentum.
My base case:
• Below $762: downside pressure remains active, favoring a test of the $760 DES.
• Holding $760: a temporary reaction or bounce could develop from the discount zone.
• Acceptance below $760: the selloff could extend toward $759 and potentially $757.
• Reclaiming $763 would reduce the immediate pressure, while a recovery above $765 would weaken the bearish thesis.
Dealer positioning does not guarantee direction, but when price action and hedging pressure align this clearly, the resulting move can become significantly stronger.  Short
Short
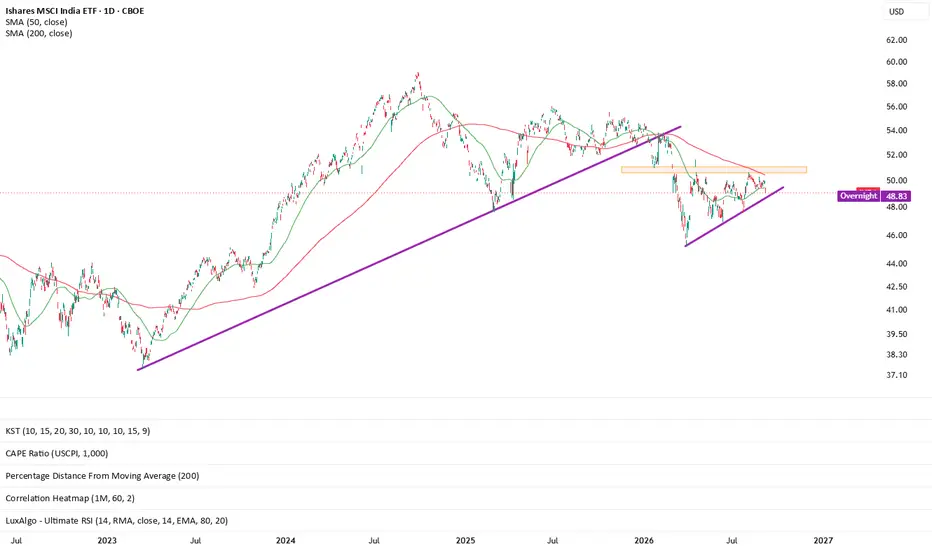
Short INDAGood morning traders,
INDA ETF is still bearish unless price recovers 200 MA. Breaking down below 48 will open the door to lower lows
My 6 trading rules
1. Never add to a losing position : Avoid averaging down. Adding capital to a trade that is moving against you dramatically increases your risk exposure on a failing idea.
2. Don't be the first to buy low/sell high, and don't be the last to exit : Avoid trying to perfectly time the exact absolute top or bottom of a market. Chasing extreme momentum or staying in a position until the very last second often leads to panic selling or getting trapped.
3. Think fundamental, manage technical : Build your core trade thesis around underlying fundamental value and macroeconomic conditions, but utilize strict technical analysis (charts, support/resistance, and moving averages) to execute precise market entries and exits.
4. Keep analysis simple : Overly complex strategies and cluttering charts with too many indicators frequently lead to confusion, analysis paralysis, and poor decision-making.
5. Start small, then scale : Begin your trade with small position sizes. Only increase your lot size and scale up exposure once the market actively moves in your direction and confirms the trend.
6. The complicated position is generally the correct one : The positions that require the most patience, strict discipline, or run entirely counter to popular retail crowd sentiment are often the ones built on real market logic.
In earlier frameworks, this rule also emphasized relying on a consistent, well-tested system and diversified portfolio. My track record is public.
Short 
 Long
Long
Short 
QQQ: levels to watch as the bounce tests harmonic zonesQQQ closed the regular session near 718 after bouncing from the early-September low around 704. The bounce is intact, but price is still below the late-August rebound high. That leaves two paths to watch on the 2-hour chart.
Upside — teal
A break and hold above the recent rebound high would put 727–730 in focus first. The higher projected band sits around 749–759. The current swing structure admits Gartley/Crab candidates in these areas, but neither is a confirmed reversal. Watch how price reacts if it gets there; touching a box alone is not a short signal.
Downside — amber
If the bounce rolls over and loses the early-September low near 704, 698.54 is the existing Bearish Butterfly’s remaining T3 reference. The pattern is marked “Closed below C.” Holding above the recent rebound high would weaken this near-term downside case.
Lower on the map — blue
664–675 belongs to a separate forming Bat candidate. It is not the Butterfly’s next target. That zone only becomes relevant if weakness extends materially; there is no assumption price has to reach it.
For now, price is between the recent low and rebound high. Let the range break and the reaction at each level do the talking. The arrows map possible directions, not timing or a forecast.
Chart: QQQ, 2-hour standard candles, regular hours, dividend-adjusted, 8 September 2026. Overnight quotes are separate. Zone ranges are approximate; 698.54 is the displayed T3 value. AHP uses swing strength 7, major swing strength 24 and 9% ratio tolerance. Pivots confirm with delay and are drawn back at the pivot; forming patterns can change or disappear. $GLD Daily Close — Sep 8AMEX:GLD was under pressure from the start of the day. Opened with a gap down and faded all day, closing 399.72, down 1.73%. It tested the 400 psych level and finished just underneath it.
On the volume, my read holds — 8.68M against a 12.13M average, 72% relative volume. Light. But I want to be precise about what light volume on a down day means, because it's the whole read. It doesn't mean heavy selling. It means nobody was selling with size at all. Professional money didn't dump this. What it also means is that nobody was buying it either. Price fell on light volume because there were no bids underneath, not because there was pressure on top.
One correction on my own framing: the range came in at 4.80 against a 7.90 ATR — 61% of a normal day. It felt like a big red candle because it closed on the lows and gave the whole thing back, but the spread was actually below average. In VSA the spread is half the signal, so that matters.
Here's what's missing, and it's the important part. Look back at the 395.51 bar in late August: wide spread, the heaviest volume on this entire chart, close well off the low. That was Stopping Volume — real absorption, professional money stepping in at the lows. Today at 400 we got the opposite on all three counts. Narrow spread, light volume, close right on the low. No absorption showed up at the level.
So the level is intact but it hasn't been defended yet. That's not the same thing. It's being held by an absence of sellers rather than a presence of buyers, and that's the version that gives way.
400 is the pivot for AMEX:GLD now. More precisely, 399.33 — that's the Key Level and the lower edge of the MTF cloud (@ripster47 EMA cloud), with the psych number sitting on top of it. Three reasons stacked in one point
As long as AMEX:GLD holds that, I'm a buyer. Below it I wait. If 400 fails and the market breaks 395.51, I start short positions targeting 390 and 384. Long side top is 420 and more, and there's heavy options flow up there — but there's no confirmed long trigger until a 5-12 Curl (@ripster47 EMA cloud) above 407.82.
What I want to see tomorrow if this level is going to hold: an up bar, wider spread than today, closing in the upper third, on volume above 12.13M. That's demand actually showing up.
And on either break — watch the volume. A break of 395 on 8M shares is a shakeout, not a trend change.
Pivot 399.33. Short trigger 395.51. Long trigger 407.82. $SPY Daily Close — Sep 8, 2026Fundamental & Geopolitical
Same as explained in the NASDAQ:QQQ post.
Technical Side
The important thing to check today: the daily 5-12 Break (@ripster47 EMA cloud). AMEX:SPY closed 765.96, below the cloud at 767.84–768.08. That's a confirmed break, and this break is the exit signal for longs.
AMEX:SPY was heavier than NASDAQ:QQQ today. I think this is profit booking from the retail side rather than institutions distributing, and here's why the volume backs that up.
Volume
35.75M against yesterday's 34.03M — up about 5%, so effectively flat. 98% relative volume, a dead-average day. The range was 4.56 against a 6.14 ATR, below normal.
So: a below-average-range red bar on average volume. The break is real. The supply behind it is not. Nobody is dumping here.
That distinction is the whole trade. A break on average volume is an exit signal. A break on expanding volume with a wide range would be a short signal. We got the first one, not the second.
Step back and look at four sessions: wide up bar on 113% volume, narrow down bar on 92%, an up day, and now this on 98%. Price has gone nowhere and volume has sat on average the entire time. Neither side has committed.
What I'm doing
No longs as long as the market stays under the 5-12 cloud (@ripster47 EMA cloud). Tomorrow either chops or reclaims. I'll consider longs back over 768 — and note the 34 EMA sits at 767.58, right underneath, so a reclaim triggers both together.
Below, PDL at 765.14 is the line. Lose that with the range expanding and volume actually above average, and then the downside is worth trading. Targets 762.75, then the 760.57 shelf.
Until one of those two things happens, flat is a position. $QQQ Daily Close — Sep 8Fundamental & geopolitical
No major data reported today, but yields are rising and there's plenty of news flow on the Iran-USA escalation. Rising yields are a headwind for tech specifically, since it's the most rate-sensitive part of the market. Price holding its level against that backdrop is worth something.
Technical side
Perfect daily 5-12 bounce. Price traded down to 715.57, tagged the @ripster47 5-12 EMA cloud, and closed back above it at 718.37. In the bigger picture the market is bouncing off the @ripster47 5-12 EMA cloud, and on the smaller timeframes I added long on the curls.
Volume
Volume was low — 22.88M against a 30.79M average, 74% relative volume. No real interest from the big players today.
But that's the good version of low volume, and it's worth understanding why. On Friday I said I was waiting for a low-volume pullback. This is it. Price came down into support, sellers had a clean shot at the cloud, and they couldn't put any volume behind the push. It closed back above the level.
That's a test. Sellers went quiet at the exact spot they needed to show up. Different from a quiet up bar — that one's No Demand and it's a warning. A quiet down bar that holds support and closes back up is the opposite signal.
One caveat I'll keep honest: a test carries more weight when it follows a heavy-volume down bar. This whole range has been quiet. So it's a valid test, not a maximum-conviction one.
What I'm doing
Watching the previous day low at 715.57 closely. I'll add long as long as PDL holds along with the @ripster47 5-12 EMA cloud. Those two are stacked in the same place — 715.57 sits right inside the 715.29–715.98 cloud. One level doing two jobs, which makes it more meaningful than either on its own.
Targets unchanged: 724.20, then 730, then the all-time high at 748.65.
What I want to see: a green bar tomorrow above 721.89 with volume back above 30M. Volume has been the missing piece on every up bar since the curl.
What I don't want: another up bar on volume lighter than today's. That's no demand, and we've had two of those already in this move.
Below 715.29 on rising volume and this becomes a 5-12 Break — that's my exit, not a decision I make in the moment.
One honest note on my own trading: I traded too much today. Long in premarket, short off an @ripster47 MTF cloud fail, then long again — on a day that closed six-tenths of a point from the open. The daily curl I've held since Sep 3 is what's actually working. The intraday flips are the leak. Worth saying out loud.  Long
Long
Long 
 Long
Long
 Long
Long
Short 
Long 
SPY Framework - September 8SPY Framework - September 7
Grading the last issue. Price broke below 763.79 as flagged, extended lower, then reversed sharply - a round trip that, in hindsight, was largely pre-holiday tape: choppy, low-conviction, not the kind of move worth chasing in real time.
Where we are. Zooming out, there are two honest ways to read the past month. The simpler one: this is a correction off the sharp thrust from the August low, still within a broader uptrend. The other: since that high, SPY has printed a pattern of lower highs and lower lows - worth noting, though a pattern like that has its own limits and can just as easily resolve as a normal pullback. The levels ahead should settle which read is closer to right.
Above: 771-772, then 775. A push through 771-772 that holds gives the bulls the edge; a further move above ~775 would be the stronger confirmation that the correction view is right and the recent highs are back in play.
Below: 769.08, then 762.63. 769.08 is the near level — a break below it is the first sign of weakness. 762.63, last week's low, is the more significant level; losing that would tilt the read bearish.
Posture. This is a level-driven decision point, not a lean either way yet. A hold above 771-772 favors the bulls; a loss of 769.08 followed by a break of 762.63 says the corrective read is losing and the more bearish structure has the edge. We'll need a clean break either way in order to get +1R trades.
A note on how this works: these bi-weekly posts mark the key structures over a two-week view — markets don't stay this tidy in between, and levels can shift before the next scheduled issue. Limited updates will reflect what's actually changed. Research 08.09.2026🌏 Markets:
AMEX:SPY -2.02 -0.26%(pre/m)
NASDAQ:QQQ +0.39 +0.05%(pre/m)
🆕 Economic News:
08:15 USA – ADP Employment Change
📈 Gap Ups
Reaction to earnings/guidance:
NYSE:UNFI
Other news:
NASDAQ:PHVS Announces Positive Topline Data from CHAPTER-3 Pivotal Study of Deucrictibant XR for Prophylaxis of HAE Attacks
NASDAQ:ROIV Announces Positive Results from PHocus Study of Mosliciguat in Patients with Pulmonary Hypertension Associated with Interstitial Lung Disease (PH-ILD) and Unveils Ongoing Phase 3 PHrontier Study
Trump Touts Intel NASDAQ:INTC Stock In AI-Generated Trading Image, Claims He Made ‘Billions’ For US
-- This week at the SPIE Photomask Technology + Extreme Ultraviolet Lithography conference, Intel Foundry NASDAQ:INTC and NASDAQ:ASML highlighted continued progress in bringing High Numerical Aperture (High NA) Extreme Ultraviolet (EUV) lithography into production and advancing the technologies that will shape its future adoption.
NYSE:IONQ Announces Increased Full-Year 2026 Financial Outlook Following SkyWater Acquisition
NASDAQ:PLTR and NASDAQ:NBIS Partner to Deliver a Complete Sovereign AI Stack to Palantir Customers
NASDAQ:ARM Extends AI Reach From Data Centers To Edge Devices
Brent crude pushed above $97 per barrel and escalating Middle East tensions sharpened fears of supply disruption. Gas and oil stocks are rising: NYSE:CVX NYSE:XOM NYSE:SHEL EURONEXT:TTE NYSE:BP OSL:EQNR
📉 Gap Downs
Reaction to earnings/guidance:
NYSE:ABM
Other news:
NASDAQ:DYN to Present Additional One-Year Clinical Data from Phase 1/2 ACHIEVE Trial of Z-Basivarsen (DYNE-101) for Myotonic Dystrophy Type 1 (DM1) at Upcoming Medical Meetings
NYSE:NVS said on Tuesday its experimental drug for a muscle-wasting disorder failed a late-stage study
NASDAQ:AMGN shares fell as investors assessed the implications of a Phase III trial result from Novartis NYSE:NVS involving an experimental Lp(a)-lowering treatment, alongside a downgrade from BMO Capital. BMO Capital downgraded Amgen from Outperform to Market Perform while maintaining a $450 price target.
NASDAQ:IONS Shares Fall After Pelacarsen Phase 3 Trial Misses Primary Endpoint
NASDAQ:BIDU Announces Inclusion of Its Class A Ordinary Shares in the Shenzhen-Hong Kong Stock Connect and Shanghai-Hong Kong Stock Connect Programs
NASDAQ:MSTR , NASDAQ:COIN , NYSE:CRCL Stocks Dip: Crypto Equities Pull Back After Bitcoin's $82K Rejection. Bitcoin traded around $78,300 on tuesday, extending its retreat after climbing above $82,000 last week.
Sony Group NYSE:SONY asked a U.S. court to toss a suit alleging it failed to pass tariff refunds to consumers after PS5 price hikes, while separately signing a non‑binding MoU with a Saudi Aramco Japan unit to explore AI-driven industrial projects.}
‼️ Additional
S&P 100 REBALANCE
-- Changes will be effective prior to the open of trading on Monday, September 21, 2026.
-- Additions: NYSE:DELL NASDAQ:PANW NYSE:ANET NASDAQ:SNDK
-- Deletions: NASDAQ:HONA NYSE:NKE NYSE:SPG NYSE:CL
S&P 500 REBALANCE
-- Changes will be effective prior to the open of trading on Monday, September 21, 2026.
-- Additions: NYSE:BE $P NASDAQ:ILMN
-- Deletions: NYSE:TAP NASDAQ:TTD NYSE:BLDR
S&P MIDCAP 400 REBALANCE
-- Changes will be effective prior to the open of trading on Monday, September 21, 2026.
-- Additions: NYSE:HUBS NASDAQ:AGNC NASDAQ:CORT NYSE:EAT
-- Deletions: NYSE:SAM NYSE:CPRI $P NASDAQ:ILMN
S&P SMALLCAP 600 REBALANCE
-- Changes will be effective prior to the open of trading on Monday, September 21, 2026.
-- Additions: NYSE:HRI NYSE:DK NASDAQ:AXTI NASDAQ:ARQT NASDAQ:ATRC NYSE:CPRI NYSE:SAM NYSE:TAP NASDAQ:TTD NYSE:BLDR
-- Deletions: NYSE:NABL NASDAQ:SHEN NASDAQ:MATW NASDAQ:VRRM NYSE:FBRT NYSE:NXRT NASDAQ:AMSF NASDAQ:CCOI NASDAQ:CORT NYSE:EAT
Dow, S&P 500, Nasdaq Futures Slide As Iran Conflict Sends Oil Back Toward $100
📋 List of tickers involved:
NYSE:UNFI $PVHS NASDAQ:ROIV NASDAQ:INTC NASDAQ:ASML NYSE:IONQ NASDAQ:PLTR NASDAQ:NBIS NASDAQ:ARM NYSE:CVX NYSE:XOM NYSE:SHEL EURONEXT:TTE NYSE:BP OSL:EQNR NYSE:ABM NASDAQ:DYN NYSE:NVS NASDAQ:AMGN NASDAQ:IONS NASDAQ:BIDU NASDAQ:MSTR NASDAQ:COIN NYSE:CRCL NYSE:SONY NYSE:DELL NASDAQ:PANW NYSE:ANET NASDAQ:SNDK NASDAQ:HONA NYSE:NKE NYSE:SPG NYSE:CL NYSE:BE $P NASDAQ:ILMN NYSE:TAP NASDAQ:TTD NYSE:BLDR NYSE:HUBS NASDAQ:AGNC NASDAQ:CORT NYSE:EAT NYSE:SAM NYSE:CPRI NYSE:HRI NYSE:DK NASDAQ:AXTI NASDAQ:ARQT NASDAQ:ATRC NYSE:NABL NASDAQ:SHEN NASDAQ:MATW NASDAQ:VRRM NYSE:FBRT NYSE:NXRT NASDAQ:AMSF NASDAQ:CCOI
Best regards – hi2morrow team.