$SPY 2H – Liquidity Hunt to 748 Was the Test, Not the Top
Everybody wants to call the top because the move has been strong, but the chart is telling a different story. The yellow levels have been acting like liquidity shelves all month. Every time price reaches one, we don’t immediately reverse—we consolidate, build acceptance, and then launch toward the next shelf.
* First shelf: ~708
* Price accepted above it and moved to ~731
* Second shelf: ~731
* Price accepted above it and moved to ~748
* Current shelf: ~748
* Price has now retested it from above and held
The key thing I’m seeing is that 748 went from resistance to support. Instead of rejecting and breaking down, buyers stepped in exactly where you’d expect if the trend is still healthy. The rising trendline is also still intact. Every meaningful pullback since the move started has found support along that structure. Until that breaks, the trend deserves the benefit of the doubt. What bears are calling a reversal currently looks more like a liquidity refill. Price swept the shelf, shook out weak hands, confirmed support, and is now attempting to continue the sequence that has been in place for weeks.
My thesis is simple:
Liquidity attracts price.
If 748 remains defended, the next obvious magnet becomes the next major liquidity shelf overhead around 760. That’s where resting orders, profit taking, and fresh shorts are likely clustered. Could it fail? Of course. A loss of 748 would weaken the setup considerably. But right now the chart isn’t showing distribution.
It’s showing:
✅ Higher highs
✅ Higher lows
✅ Successful support retest
✅ Intact trend structure
✅ Clear liquidity target above
Bears keep yelling “It can’t keep going up.” , market keeps responding with “better luck next time!”
This is all just my charting and my opinion, not financial advice.
ETF market
Melt-up before the big short?Going to update the prior idea that I had -- while I do think we're going to get the short that takes everyone out, I now do see how we can get a move to $800+ and the flows that are coming in options kind of support the view that we go higher.
I exited my all of my longs on May 14th-15th (mainly NVDA and Mara ) after being long since the late March lows and I'm now looking to reenter on a pullback instead of holding my puts and vol positions.
$752 was the level I was looking to exit longs at. We hit $749 on March 14th and that was close enough for me to exit. Now that we've broken the $752 level, I still think we pullback before moving higher which is why I'm mainly in puts and cash here.
I think the short move that I was looking for in the last post will just be a shallower pullback instead of the larger move (which will play out later). I think it's likely that if we do get the pullback here, that it could be a sharp one down to the lower supports at 704 or 687, then that will setup one final move up to the upper resistances. I'll be looking to exit my short positions there, and then flip long certain names for the final move higher.
Going to use this chart as a guide going forward unless the support breaks at the lower 687 level. That will be the trigger that we're getting a much larger move down.
In terms of timelines, I think we see a pullback over the next 1-3 weeks, then long roughly into July then I'll want to be in puts/vol going into August/ September timeframe. These are rough and I'll update as I see price action play out.
Let's see what happens next.
SPY - ACE Score 4. CQI 0. New ATH. NR7 five straight days.ACE Score 4. CQI 0. New ATH. NR7 five straight days.
The two layers of ACE have never
been further apart in two weeks
of analysis.
Score 4 means every OHLCV condition
is aligned. Regime, close position,
trend, instrument gate - all firing.
That's the maximum reading the
OHLCV system produces.
CQI 0 means the footprint conviction
at the announcement bar is at the
absolute floor. Not Q4. Not low. Zero.
Same instrument. Same moment.
Opposite extremes.
---
SPY made a new high today. $758.18.
SOM drew the Last Ann Budget Line
at exactly that level - the
projected structural target from
the last announced zone. Price
reached it precisely.
5 zones touched. Zero announced.
3 resolved obligations - structure
consumed at the highs.
The engine has been eating through
zones all week without announcing
a new one. 5 touched and none
have qualified for announcement.
---
NR7 for the fifth consecutive session.
Five straight days of the narrowest
range compression. Each time the
anti cleared it resolved - Wednesday
upside, Thursday down, Friday new
high. The pattern keeps resetting.
The gate qualifies. PART mode on
the daily. T=3 score. The anti
keeps blocking.
---
What the stack is holding:
GREEN price at all-time highs.
Q4 SHORT conviction in the orderflow.
Maximum OHLCV score.
Zero footprint quality.
Five days of compression.
Budget line reached.
The ecosystem has been saying the
same thing all week - the conditions
are assembled, the conviction layer
is absent, the compression keeps
resetting.
When NR7 clears Monday and the
footprint quality recovers from
zero - that's the bar to watch.
WAIT.
---
SYNTHESIS v3.1 - SPY 1H
SOM + ACE + IMP + SYNTHESIS
Not financial advice.
Past signals do not guarantee
future results.
TLT LongSell put
Long entry 85.6
no stop
Target 89
Risk management is much more important than a good entry point.
I am not a PRO trader. In 2025, about 25% of my trades had been stopped.
In my trading plan, the Max Risk of each short term trade should be less than 1% of an account.
TLT SellToOpen Sep P84, $1.64
Allow assignment to accumulate Conservative long term investment.
if P84 could be assigned, same as limit buy at 82.4 (historical bottom)
No stop, buy and hold.
Sell puts at levels I am willing to buy
and just take in the premium,
and wait for a pullback to buy that will eventually come.
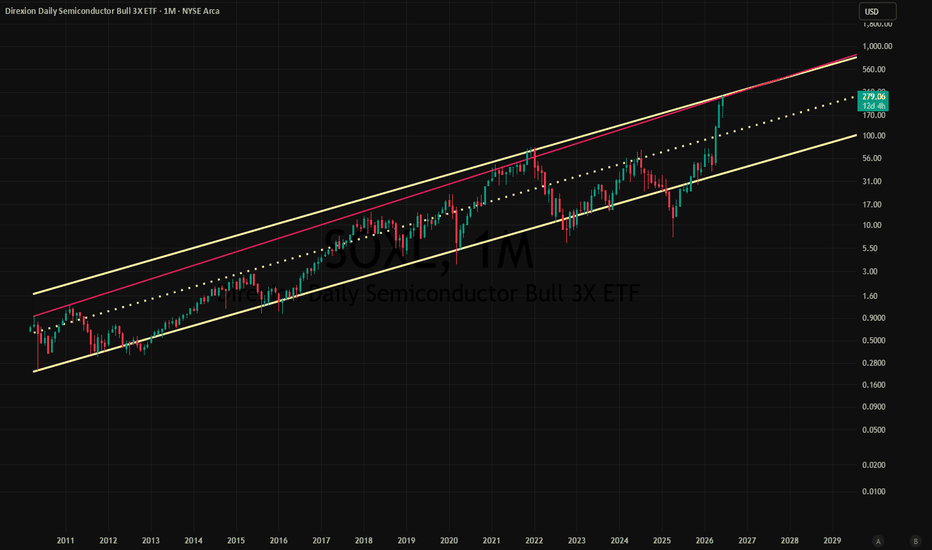
Gold | JNUG | Long at $175.00Like my coverage of the silver junior miners, I believe gold may be in for another massive, final wave before a major correction. While the Direxion Junior Gold Miners AMEX:JNUG is a "risky" asset given it is 2x return or loss, I am placing my bet here at $175.00 while the ticker rides the top channel of its historical simple moving average area. If the market crashes, though... this will follow. Could see $100 before a major move up, but time will tell.
TARGETS INTO 2029
$240.00 (+40.0%)
$325.00 (+85.7%)
If you enjoyed this Idea, please consider following for more: www.tradingview.com
Nasdaq ETF Holding Strong as Institutional Flow Returns (TODAY)Current Price: 735.60
Direction: LONG
Confidence level: 85%(Trader consensus remains unified across group metrics.)
Targets
Target 1: 739.50
Target 2: 746.00
Stop Levels
Stop 1: 731.00
Stop 2: 726.00
Wisdom of Professional Traders:
Here's my take for TODAY’s intraday session: the combined signals from professional traders and X sentiment lean bullish across the Nasdaq ecosystem.
Several professional traders I tracked are highlighting continued institutional accumulation in AI infrastructure and hyperscaler names. The biggest signal is the massive record buy flow (+$21B net buy blocks) reported across the tape, with strong institutional demand concentrated in names like NVDA, MSFT, AMD, and AMZN. Importantly, the Nasdaq ETF ( NASDAQ:QQQ ) and several mega-cap leaders were also heavily accumulated on the lit exchange tape. That type of broad accumulation usually fuels intraday continuation moves the following session.
What’s interesting is the divergence between dark pools and the index. Institutions appear to be buying individual AI and tech names while hedging broad indexes. In practice, that pattern often leads to selective upside in large-cap leaders rather than broad market weakness.
X sentiment reinforces this idea. Many traders are pointing out that NVDA’s mechanical selling after earnings appears to have ended, and institutions have resumed accumulation. AI infrastructure deals (Anthropic funding, GPU financing, hyperscaler cloud demand) are dominating the conversation and directly support companies like NVDA, AVGO, MSFT, AMZN, and GOOGL.
Macro headlines are also mildly supportive TODAY. The Iran ceasefire framework discussion and crude stabilizing below $100 removes a near-term inflation shock. Meanwhile, recent economic data wasn’t strong enough to trigger immediate rate fears, which helps growth stocks hold momentum intraday.
So where does this leave us for TODAY only?
The tape shows rotation back into AI leaders, strong institutional buying pressure, and bullish positioning in megacap tech. That combination favors a continuation bounce across the Nasdaq complex during the current trading session.
Confidence Level: Moderate‑High for TODAY’s intraday bias.
------------------------------------------------------------
Key Insights:
The real story for QQQ TODAY is institutional accumulation. Large block buying across the Nasdaq complex suggests that institutions are stepping back into AI and hyperscaler exposure. When we see the ETF itself showing heavy lit‑tape buying alongside individual tech names, it often leads to intraday continuation momentum.
What's interesting is that the dark pool activity indicates institutions prefer owning individual leaders while hedging indexes. That dynamic still supports intraday upside in QQQ because the mega‑cap components dominate its weighting.
For TODAY’s session, I'm watching the pivot area just above recent resistance. If buyers keep defending dips, QQQ likely pushes higher during the session.
Recent Performance:
QQQ has recently been pushing toward new highs as tech leads the market. Recent sessions saw strong inflows and tech outperformance, signaling strong short-term momentum coming into TODAY.
Expert Analysis:
Professional traders on YouTube have highlighted continued structural strength in AI infrastructure plays. Many emphasize high‑tight flag patterns forming across semiconductor and cloud stocks, which tends to support ETF continuation.
X sentiment is mixed but leaning positive, with traders pointing out that the broader Nasdaq structure still favors higher prices first.
News Impact:
AI infrastructure investment headlines and easing geopolitical pressure are supporting risk appetite TODAY, which directly benefits QQQ.
Trading Recommendation:
Intraday continuation higher remains the most probable scenario TODAY if buyers defend morning dips.
# SPY May 29: GEX Says 755 Is the Line to Watch
SPY spent Thursday grinding higher before settling into a tight consolidation near 755. After a strong recovery from the morning lows, buyers maintained control throughout the session, but momentum slowed noticeably as price approached a key Gamma Exposure (GEX) zone.
Going into May 29, the chart itself looks constructive. Higher lows remain intact, buyers continue defending pullbacks, and price is holding near the highs of the recent move. However, the bigger story may not be the candles themselves—it may be the options positioning sitting directly around current price.
One level stands out immediately: 755.
From a GEX perspective, 755 appears to be the primary battleground heading into Friday's expiration. Price spent the final hours rotating around this level while volatility remained relatively contained. That behavior is often seen when dealer hedging activity begins influencing short-term price action.
For traders unfamiliar with GEX, positive gamma environments generally encourage dealers to buy weakness and sell strength. This often reduces volatility and creates a tendency for price to gravitate toward major positioning zones.
That appears to be exactly what SPY is doing right now.
The current GEX structure remains positive, suggesting dealers are helping stabilize price rather than amplifying directional moves. In these conditions, breakouts typically require stronger participation before they can gain momentum.
Above current price, 756 is the first level to watch. A clean breakout and acceptance above 756 could force additional hedging activity and open the door toward 757 and potentially 758.
The 758 area currently represents the most significant upside objective visible on the board. If buyers can push through the 756 zone, that level becomes a realistic target for the session.
On the downside, 754 remains the first area bulls need to defend. Losing 754 would weaken the current structure and could trigger a move toward 752. Below that, the larger support zone sits near 750, which also aligns with a significant positioning area.
The interesting part of the current setup is that both the chart and the options positioning are telling a similar story. Price remains in an uptrend, but positive gamma conditions suggest the market may continue rotating around key levels until enough buying or selling pressure emerges to force expansion.
Key Levels:
Resistance:
756.00
757.00
758.00
Support:
754.00
752.00
750.00
748.20
### GEX Outlook
* Positive GEX remains in control.
* Dealers are likely suppressing volatility near current levels.
* 755 remains the primary pivot zone.
* Above 756 favors a move toward 757-758.
* Below 754 increases the probability of a test of 752 and 750.
* Expect reactions around major positioning levels rather than random price movement.
My bias remains cautiously bullish while SPY holds above 754. The broader trend continues to favor buyers, but Friday's battle around 755 could determine whether the market extends toward new highs or spends another session consolidating within the current range.
The key battle for May 29 is simple: bulls want acceptance above 756 and a push toward 758, while bears need a break below 754 to regain short-term control.
A great time to buy!Sell puts in uptrend, at support levels I am willing to buy
and just take in the premium,
and wait for a pullback to buy that will eventually come.
Long entry 741
no stop
Target 770 (+ 10% from 700 )
Risk management is much more important than a good entry point.
I am not a PRO trader. In 2025, about 25% of my trades had been stopped.
In my trading plan, the Max Risk of each short term trade should be less than 1% of an account.
SellToOpen Jul P700, $6.85
Allow assignment to accumulate Conservative long term investment.
if P700 could be assigned 7/17/206, same as limit buy at 697, probability is 20%.
No stop, buy and hold.
SPY - CQI 99.3. Double anti. Daily FORMING. T=3.CQI 99.3. Double anti. Daily FORMING. T=3.
The 1H just printed the highest
conviction reading in this entire
two-week analysis sequence.
99.3. Q1. Maximum bull orderflow
quality at the announcement bar.
Both anti-signals are active.
HiSwp + NR7 simultaneously.
HiSwp: a prior swing high was swept
and closed below. Price made a new
high and couldn't hold it.
NR7: today is the narrowest range
session of the last 7 days.
Maximum conviction. Maximum
compression. Both blockers active
at once.
The suite is doing something specific
here - it's registering that the
orderflow quality is the best it's
been, while simultaneously flagging
that the price action has swept a
high and compressed. Those two
things don't usually fire together.
The daily is FORMING.
T=3 on the OHLCV score system.
That's the high-confidence threshold.
PART mode qualifying. NR7 blocking.
Q1 LONG direction. ACE 81.4.
Three resolved SOM obligations -
structural zones that have been
fully consumed by price. The engine
is eating through structure at
new highs.
5 zones touched. Zero announced.
SOM is engaged but hasn't confirmed.
What this stack is saying:
The conditions for a HIGH signal
are the most fully assembled they've
been on SPY in two weeks. The only
things standing between FORMING
and FIRE are the two anti-signals
and ACE Score advancing from 1X
to 2+.
NR7 resolves on the next bar.
HiSwp resolves when price stops
making new highs.
Watch the open.
SYNTHESIS v3.1 - SPY 1H + Daily
SOM + ACE + IMP + SYNTHESIS
Not financial advice.
Past signals do not guarantee
future results.
Robotics & AutomationPreliminary Information
Themes Robotics & Automation (BOTT) is an ETF specifically focused on the integration of generative artificial intelligence and anthropomorphic robotics.
Unlike traditional industrial robotics funds, BOTT specifically concentrates on "embodied AI"—artificial intelligence that operates in the physical world through robotic bodies capable of interacting in human environments.
This ETF includes technology leaders not only from the U.S. but also from China and South Korea, nations that dominate the production of robotic components.
Labor shortages and the falling costs of sensors and actuators are making the adoption of service robots a global economic necessity.
Top 10 Holdings (May 2026)
Leader Harmonious Drive (6.54%): A Chinese leader in the production of precision reducers, which are fundamental for the movement of robotic joints.
Zhejiang Hechuan Tech (5.13%): Specialized in industrial control systems and high-efficiency servomotors.
EFORT Intelligent Robot (5.09%): A manufacturer focused on industrial and collaborative robots (cobots) with advanced software integration.
Richtech Robotics (5.09%): A U.S. company developing autonomous service robots for the hospitality and healthcare sectors.
Rainbow Robotics (4.82%): A South Korean center of excellence in humanoid robot development (and a strategic partner of Samsung).
Tesla Inc. (4.65%): Central to the development of the Optimus robot and the large-scale application of computer vision.
NVIDIA Corp. (4.42%): Supplier of the chips and platforms (such as Isaac) necessary to train robotic artificial intelligence.
Cyberdyne Inc. (4.38%): A Japanese pioneer in robotic exoskeletons and medical rehabilitation technologies.
Teradyne Inc. (4.15%): A global leader in collaborative automation through its subsidiary, Universal Robots.
Fanuc Corp. (3.98%): A Japanese industrial robotics giant, essential for the automation of global production lines.
+++++
Analysis
This is a very recent ETF with just over a year of historical data.
The chart clearly identifies a bullish trend supported by the blue line; any potential contact with this line represents a possible accumulation opportunity.
Sharply increasing volumes in recent months highlight the growing interest in this sector.
The next target is the light blue resistance level.
+++++
Personal Note
There is no way around it: autonomous robots are the "near" future.
In my opinion, taking a position now is the best way to fully capitalize on the next speculative bubble.
As always, likes and comments are appreciated!
Technology Leadership Remains Strong (XLK/SPX)XLK continues to outperform the S&P 500.
The trend remains intact:
• Higher highs
• Higher lows
• Strong relative strength
Sector leadership is often where the best momentum opportunities originate.
Monitoring leading technology names for potential continuation setups.
Educational analysis only.
$GDX Nears Critical Triangle Apex: Breakout or Breakdown?AMEX:GDX – Approaching a Major Decision Point
AMEX:GDX is compressing into a symmetrical triangle, with price caught between a well-defined descending resistance trendline and a rising support trendline that aligns closely with the 200-day EMA. The former breakout level around $84 has repeatedly acted as support, reinforcing its significance. As the apex nears, a decisive breakout or breakdown could trigger the next major move.
Bullish Scenario: A breakout above the descending trendline could signal a trend reversal and open the door for a move toward the $95–$105 zone.
Bearish Scenario: A loss of support and the 200-day EMA may increase downside risk and invalidate the current bullish structure.
For now, all eyes are on the convergence of support and resistance as GDX prepares for a potentially high-volatility breakout.
Not financial advice. Trade your plan and manage risk accordingly.
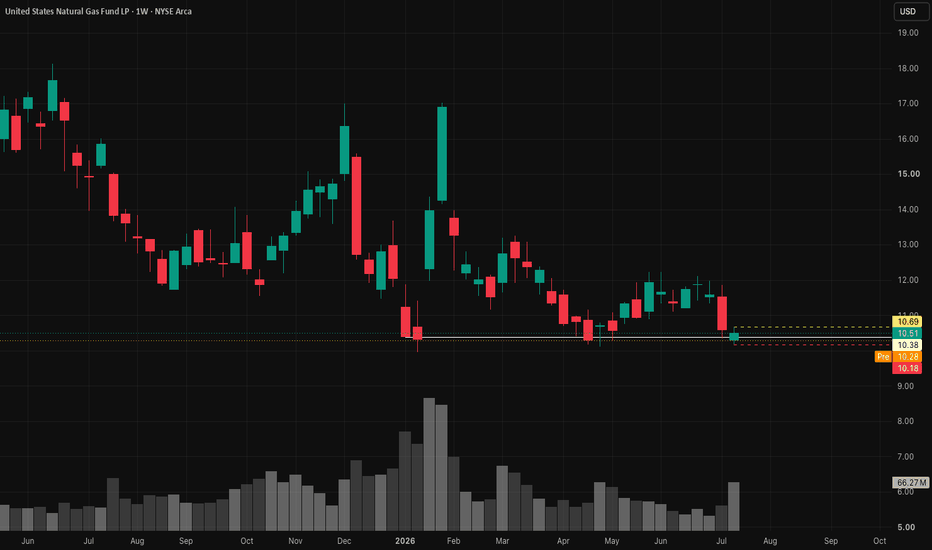
UNG | "Power Plant Day" or Payday? Why UNG is Coiling | LONGIf you thought your wallet felt light after the holidays, buckle up. Natural gas is about to pull a "Phoenix" act, and it’s not just because the groundhog saw its shadow. Between a geopolitical powder keg in the Middle East and the ghost of winter storms past, the "buy the dip" crowd is about to look like geniuses - and everyone else is going to be wearing three sweaters indoors.
1. The "Strait" Jacket: The Trump Deadline
As of this morning, April 7, 2026, the market is holding its breath. President Trump has set a hard 8:00 PM ET deadline for Iran to reopen the Strait of Hormuz or face "decimation" of its energy infrastructure. After the joint US-Israel strikes on February 28, the "will they, won't they" drama has officially pivoted to "they did," and now we’re in the "what next?" phase.
The Math: Roughly 20% of the world’s LNG flows through that narrow strip of water. It’s currently blocked, and Trump is threatening to turn Iran’s power plants into expensive parking lots if the gates don't open tonight.
The Snark: If you thought your gas bill was high, wait until the "Strait" becomes a "Dead End." Analysts are predicting global LNG prices could quadruple. That’s not a "pop"—that’s a moon mission without a flight plan, fueled by a President who treats geopolitical deadlines like a season finale of The Apprentice.
2. "Winter Storm Fern" Left the Cupboard Bare
While Trump is bringing the heat to the Middle East, Winter Storm Fern already brought the cold to our inventories. Remember late January? While you were complaining about the slush, Fern was busy devouring the US natural gas supply.
The Record: We saw the largest weekly storage withdrawal in history (360 Bcf).
The Fallout: Despite the Trump administration’s "Energy Dominance" push to drill everywhere including your backyard, inventories are still struggling to recover from that historic drain. We’re basically running the heater on "E," and the EIA just hiked forecasts because we're one global supply disruption away from a real problem.
3. The Technical "Spring-Load": 3 Mini Bullish Wedges
From a swing trader's perspective, the chart for UNG (Natural Gas) is starting to look like a coiled rattlesnake.
The Triple Threat: We are currently seeing three mini bullish descending wedges forming on the 4-hour chart. For the uninitiated: that’s technical speak for "the sellers are exhausted and the buyers are hiding in the bushes with a net."
The MACD Divergence: The 3D MACD is curving up, flashing a classic divergence. While the "mild weather" crowd hammered prices down to the $2.80 - $3.20 range, the momentum is shifting.
The Gap: With Sunday's open already showing volume spikes, that $3.20 entry looks like a gift-wrapped souvenir from a simpler time.
The Verdict
The market was priced for a "boring" shoulder season. Instead, it got a geopolitical ultimatum and a technical triple-wedge setup. If you haven't looked at UNG or BOIL for a scalp, you're essentially betting that the Middle East will suddenly find its "zen" and Trump will miss a deadline.
Positioning for "The Divergence Seeker": We are watching the divergence between "peace-time pricing" and "war-time reality." If the 8 PM deadline passes without a deal, the "Buy" signal won't just be a bar on your TradingView chart - it’ll be a vertical line.
Recent Trades - Pullback ExamplesIt has been a while since I last posted, so here are some recent trade examples showing both successful and failed individual trades. I know some only show the former, but that is not representative. The value lies in the cumulative effect over a larger sample, while individual outcomes are considered random.
The probabilistic process can be read about more here:
The examples below are pullback setups. In simple terms, a pullback is a short-term counter move in response to momentum, which provides a structured location to participate in case of resumption.
An important part of the process is to evaluate whether the momentum move was meaningful, rather than random patterns on a chart. That is why we use standardized models for evaluation, which can be read about more here:
The pullback tool used in these examples is available here:
Entries happen in approximate rather than precise locations, as there are no perfect entries, and attempts to optimize tends to be unproductive. Trades are rather taken within a defined pullback area.
I try not to interfere once in a trade. However, sometimes I still do, which can either help or hurt the result. From previous evaluations, the cumulative effect of interference has been close to neutral, however required more effort and attention. Thus, I prefer to let price hit bracket orders. In the trades below I've used a default stop of 2.25 ATR and a target of 1.1R.
PVH
Entered at the marked arrow. Here is an example of not letting the trade play out. It was closed four days later. In this case, interference worked against the trade and resulted in a premature exit.
TWST
This trade was exited early for breakeven/minor drawdown. The trade later moved into what would appear to be a full profit target, but it would also have hit the stop beforehand. In this case, interference worked in favor.
These are reminders that individual trades have uncertain outcomes. The consideration is instead the cumulative effect.
TSN
Entered at the marked area. The trade moved well above target, almost 2R within one session. Since position size was larger here and short-term momentum was strong, the trade was closed into strength before the close.
I do not monitor trades intraday. Decisions are mainly made near the open or before the close to reduce hesitation and reactions to short-term movement.
WMB
Entered at the black arrow. I included the weekly chart as the broader structure is sometimes easier to visualize on slower setups. This trade was left untouched and the bracket orders played out to full profit within a few days.
An additional point is that while targets are ATR-based by default, I still pay attention to previous pivot highs and lows, as price often becomes more reactive there. Because of that, I tend to avoid entries into breakouts (right figure). The focus is instead on pullbacks and then exits into the expansion/breakout (left figure).
PCG
Not an ideal setup in terms of quality, but still a profitable trade. Entered at the black arrow and exited at the 1.1R target. Since volatility was relatively low, the trade did not require a notable move to reach target, and there was no interference involved.
USO Showing Intraday Dip-Buying Potential as Geopolitical PremiuCurrent Price: 131.03
Direction: LONG
Confidence level: 85%(Trader consensus remains unified across group metrics.)
Targets
Target 1: 131.92
Target 2: 132.88
Stop Levels
Stop 1: 130.20
Stop 2: 129.40
Wisdom of Professional Traders:
Combining what professional YouTube traders are saying with real-time X sentiment, the broader takeaway for crude-related assets today is a cautious intraday bullish bias. While several YouTube traders remain structurally bearish on crude after the recent drop below $90, what's interesting is that real-time catalysts today are skewing supportive for oil prices.
First, geopolitical tension between the U.S. and Iran is clearly back in the headlines. Several X posts reference fresh U.S. military activity and ongoing negotiations. Even when negotiations are mentioned, the messaging from U.S. leadership suggests sanctions will remain tight. That combination tends to support supply-risk premiums intraday, which often pushes crude higher during the trading session.
Second, the latest inventory data shows a 2.8M barrel crude draw, reinforcing the idea that supply isn't building as quickly as expected. Professional traders often react quickly to these inventory shifts during the same trading day, especially after a recent price flush like we just saw in WTI.
So here's how I'm interpreting the combined signals for today’s session only:
- YouTube traders are cautious after the sharp drop toward the $88–$90 zone.
- X sentiment is shifting toward dip-buying and geopolitical risk premium.
- When those two signals collide, we often see short-covering bounces intraday rather than continued immediate downside.
Because both USO and CL=F track the same crude market, the group setup favors a modest intraday rebound rather than fresh breakdowns. I'm not expecting a huge move today — just a tight recovery bounce within the daily range.
Confidence increases slightly because:
- Supply headlines + inventory draw support oil
- Social sentiment shows traders starting to probe long entries
- After a sharp drop, markets often mean-revert intraday
The strategy today is LONG for a controlled bounce, not a multi-day swing trade.
---
Key Insights:
USO is currently trading around $131.03, and the intraday structure from order-flow commentary shows something important: sellers are defending the $132 area, but buyers keep absorbing supply near $130. That type of action often leads to a slow grind higher during the same trading session if selling momentum fades.
What's interesting is the liquidity structure above price. There's a visible ask cluster around $132, which lines up perfectly with where an intraday breakout attempt could happen. If buyers push through that liquidity pocket, short-term traders may trigger stop orders above it.
Another factor supporting a long setup for today only is that USO already showed ~1.8% premarket strength. When an ETF tied to crude shows early strength while news flow is geopolitical, that momentum can carry into the main session as traders position for potential headline risk.
So the real story here is not trend reversal, but intraday bounce potential off the lower range.
Recent Performance:
USO recently experienced volatility following crude’s sharp drop toward the high-$80s in WTI. Despite that pressure, price is currently stabilizing around the $130–$131 zone, which aligns with nearby liquidity support around $130.01 mentioned by traders. For today's session only, the ETF appears to be holding support rather than breaking down, which opens the door for a small rebound.
Expert Analysis:
Professional traders on YouTube are largely neutral to slightly bearish structurally, mainly because crude lost the psychological $90 level recently. However, even among bearish traders, several pointed out that shorting directly into support after a large drop is risky.
Meanwhile, X sentiment is much more balanced. Some traders are calling for continued downside, but others are actively posting long entries around $90 crude, suggesting the dip-buying crowd is stepping in. When social traders begin probing longs after a selloff, it often leads to intraday stabilization and bounce attempts.
For today's trading session only, the combined sentiment slightly favors upside.
News Impact:
Geopolitical headlines are the main driver today. Reports of U.S. military activity related to Iran and ongoing diplomatic tension create uncertainty around supply flows through the Strait of Hormuz. Even hints of disruption tend to push oil-linked instruments higher intraday as traders hedge risk. Combined with the recent crude inventory draw, these headlines support a temporary bullish bias today.
Trading Recommendation:
For today’s session only, USO looks positioned for a controlled rebound toward overhead liquidity near $132+. I'm watching the $130 area as the key intraday support. As long as price holds above it, a push toward higher liquidity pockets is likely.
QQQ Holds Leadership as Institutional Money Rotates Into Mega‑CaCurrent Price: 729.45
Direction: LONG
Confidence level: 85%(Trader consensus remains unified across group metrics.)
Targets
Target 1: 736.00
Target 2: 742.00
Stop Levels
Stop 1: 724.00
Stop 2: 718.00
Wisdom of Professional Traders:
Across the entire Nasdaq‑heavy ecosystem today, the combined signals from professional YouTube traders and real‑time X sentiment lean cautiously bullish for TODAY’s trading session. The real story here is that institutional attention remains locked on the AI infrastructure theme — cloud demand, AI chips, and hyperscaler spending. When several of the largest companies in the index (Microsoft, Amazon, Alphabet, Nvidia, Meta) all benefit from the same AI spending cycle, the Nasdaq tends to move as a unified block.
Several professional traders I track on YouTube emphasized that the broader trend in 2026 remains risk‑on for large‑cap tech. Even when we see brief intraday pullbacks, buyers tend to step in quickly around known support levels because funds still need exposure to AI leaders. On X, sentiment is more mixed intraday, but what's interesting is that option flow activity and dip‑buying chatter show traders expecting rebounds rather than sustained selling.
For TODAY only, the setup looks like a continuation‑style session where dips attract buyers. Macro headlines are not currently introducing new shock risk, oil weakness has helped inflation expectations, and AI‑related earnings/news from companies like Snowflake, Marvell, and Amazon reinforce the growth narrative supporting the Nasdaq complex.
Because these assets are tightly correlated, the most logical intraday strategy today is maintaining a LONG bias across the entire group, with tight risk management given possible volatility around macro data.
Key Insights:
QQQ remains the clearest proxy for Nasdaq risk appetite. For TODAY only, trader positioning suggests funds continue allocating to large‑cap technology despite occasional profit‑taking.
Market breadth has shown some weakness, but mega‑caps continue holding the index up. This matters because QQQ weighting is heavily concentrated in companies benefiting from AI infrastructure spending.
The real takeaway is that unless those leaders break down, the ETF tends to grind higher intraday.
Recent Performance:
QQQ recently closed around $729 after climbing nearly 2% the previous session. That move reinforced the current uptrend structure.
Expert Analysis:
Professional traders generally remain bullish on QQQ for TODAY because institutional buyers continue supporting dips. On X, sentiment is split, but the overall positioning leans toward dip‑buying.
News Impact:
AI‑related earnings and cloud spending headlines continue reinforcing the bullish Nasdaq narrative.
Trading Recommendation:
For TODAY only, traders should expect pullbacks to attract buyers rather than trigger sustained selling.
SPY - ACE printed 94.1. One condition from firing.ACE just printed 94.1.
That is the highest conviction reading
this ecosystem has produced on SPY
in two weeks of analysis.
The suite is still WAIT.
Here's why - and what changes that.
The 1H stack right now:
GREEN light. Q1 LONG. SwLo Swept.
CQI 94.1. Entry Signal: FORMING.
SwLo Swept fired this morning - a
prior swing low was swept and closed
back above. That's the liquidity
removal event IMP is designed to
detect. It's the first participation
trigger to engage on SPY 1H in
this entire sequence.
CQI at 94.1 means the orderflow
quality at the last announcement
ranked in the top percentile of
historical conviction. Q1 bull.
The suite is at FORMING because
ACE Score is 1X - one component
short of the 2-point threshold that
advances to PARTIAL.
One condition away.
The daily is compressing again.
NR7 for the second time this week.
Same pattern as Wednesday - PART
mode qualifying, anti blocking.
But this morning the daily ACE
Score is T=3. That's approaching
high-confidence territory on the
OHLCV score system. The research
threshold for high-confidence is T≥3.
PART mode + T=3 + NR7 = the gate
is loaded, the anti is the lock,
and Wednesday showed us exactly
what happens when NR7 clears.
The tension the suite is holding:
1H: strongest bull conviction signal
in two weeks. SwLo Swept. CQI 94.1.
FORMING.
Daily: NR7 compression at all-time
highs. PART mode. T=3. Anti active.
Both frames are pointing at the
same event from different angles -
a participation signal that hasn't
fully assembled yet.
What fires the signal:
On the 1H: ACE Score advances from
1X to 2+. That requires another
condition in the L1/L2 framework
to align at the next announcement.
On the daily: NR7 clears with PART
mode still active and no new anti.
Wednesday that resolved to the
upside. Today it resolves to
wherever the Thursday session goes.
The suite is FORMING on the 1H.
That's the closest it's been to
a signal on SPY since this
analysis began.
Watch the open hour.
SYNTHESIS v3.1 — SPY 1H + Daily
SOM + ACE + IMP + SYNTHESIS
Not financial advice.
Past signals do not guarantee future
results.
Is the Bond Market Starting to Call the BluffDespite persistent concerns around inflation, deficits, and Treasury issuance, TLT has quietly reclaimed its 50-day moving average and begun establishing a series of higher highs and higher lows.
If inflation expectations continue to moderate, the bond market may be signaling that rates have less upside than many investors believe.
The next area I’m watching is resistance near 86. A break above that level would strengthen the case that long-duration Treasuries are beginning to price a different macro environment.
Key assets to watch alongside TLT
Crude Oil (inflation expectations)
Treasury Yields (TNX)
U.S. Dollar (DXY)
Together they may provide a clearer picture of where rates head next.
One of the ways I view markets is through the relationship between asset classes rather than in isolation.
Crude oil is a good example. When oil prices rise, investors often begin to reassess inflation expectations. If inflation is expected to remain elevated, Treasury yields can move higher, which tends to create pressure on long-duration bonds such as TLT.
Conversely, if oil prices begin to cool, inflation expectations may ease as well. That can support lower yields and improve the outlook for long-duration Treasuries.
This is one reason I have been paying close attention to TLT’s recent strength. After reclaiming its 50-day moving average, the bond market may be signaling that inflation expectations are becoming more contained than many investors anticipated.
While no single asset tells the entire story, I believe monitoring crude oil, Treasury yields, and TLT together can provide valuable insight into where the broader macro environment may be headed.
Educational information not to be used as financial or investment advice
Emerging Markets Are Breaking Out After 15 Years of Dead Money AMEX:EEM may have just triggered one of the biggest macro breakouts in years.
After spending more than a decade trapped inside a massive range, Emerging Markets are now pushing above long-term resistance levels that rejected price in:
2007
2018
2021
And this time looks different 👀
What stands out:
📈 Strong breakout momentum
🔥 RSI expanding into bullish territory
🚀 MACD turning sharply higher
📊 Multi-year compression resolving upward
If this breakout confirms, Emerging Markets could be entering a completely new leadership phase after massively underperforming U.S. equities for years.
🎯 Key level above: $80
That’s the major macro resistance zone from the 2007 peak.