Price Action Education Series: Ascending WedgeAn ascending wedge is a bearish price action structure that often fools traders at first glance because price is still moving higher while the pattern is forming. That is exactly why it matters. The market looks healthy on the surface, but under the hood, the move is losing power. 📉
A true ascending wedge forms with two rising trendlines that are not parallel. Both lines slope upward, but they gradually converge, which means the space between them gets tighter and tighter. Price is still climbing, but each push higher becomes more confined, more crowded, and more vulnerable.
That narrowing is the warning sign.
✅ What defines a real ascending wedge?
• Two trendlines are both rising
• The lines are converging, not running parallel
• Price keeps printing higher highs and higher lows
• The rising support line is the one that eventually becomes vulnerable
• The pattern often resolves with a break beneath the lower trendline
• The break can happen before the two lines ever meet
That last point is important. Traders sometimes wait for price to reach the exact apex, but the market often moves before that full intersection ever happens.
📍The psychology behind it:
This pattern usually develops while traders are feeling increasingly bullish. Price is rising, so confidence rises with it. On the surface, everything looks fine. But the character of the move is changing. Every new push higher carries less force than the one before it. Buyers can still move price up, but not with the same energy. The trend is still alive, but it is getting tired.
The tell is in the narrowing range.
As price gets squeezed tighter between the two rising lines, the market is telling you that upward momentum is weakening. Once the lower/supporting trendline finally gives way, the buyers who were happily riding the trend higher suddenly lose the structure that justified staying in. That is when exits, stop-outs, and fresh selling pressure can all hit at once. 🔥
Another important nuance: an ascending wedge can show up as either:
• a reversal pattern after an extended bullish move
or
• a continuation pattern that interrupts a broader bearish trend before the next leg lower begins
So the pattern itself is bearish, but the larger context still matters.
✅ Strong confirmation signs:
• Clear rising but converging trendlines
• Higher highs and higher lows that become increasingly compressed
• Momentum fading as price climbs
• Breakdown below the lower trendline
• Ideally, increased selling pressure on the break
• Weak rebound or failed retest after the breakdown
⚠️ Warning signs:
• Trendlines are parallel instead of converging
• Price action is too sloppy to define clearly
• There are not enough touchpoints on both lines
• The breakdown lacks follow-through
• Price quickly reclaims the lower trendline
Not every rising structure is an ascending wedge. Sometimes traders label a rising channel, an ascending triangle, or random upward drift as a wedge when it is not. Precision matters.
🎯 Common target method:
A common way traders estimate a target is by measuring the widest part of the wedge and projecting that distance downward from the breakdown point. It is not a promise — just a framework for planning the trade.
🛠 Practical trading mindset:
Do not get seduced by the fact that price is still going up. Ask better questions:
• Are both lines rising?
• Are they converging?
• Is price getting squeezed tighter?
• Is each push higher losing energy?
• Did the lower trendline actually break?
• Did the retest fail?
The edge is not in drawing two random upward lines. The edge is in recognizing when a bullish-looking move is quietly weakening from the inside.
That is why the ascending wedge is so valuable. It teaches you that price can still be rising even while momentum is fading. Learn to spot that loss of lift early, and you stop mistaking exhaustion for strength. 📚⚠️
ETF market
Weekly Bias — 11 MayAll 3 indices are in a reflexive momentum squeeze higher, but the character of the move matters
NASDAQ:QQQ is leading aggressively, which usually aligns with falling or stable long-duration yields, softening real yields & systematic short-covering in growth beta
AMEX:SPY is participating, but lagging NASDAQ:QQQ on relative strength, showing this is still a tech/AI leadership tape rather than broad economic expansion
AMEX:IWM is the weakest structurally despite participating
Divergence tells you the market is not fully pricing a broad cyclical acceleration
This looks more like liquidity-driven upside expansion than a healthy broad-market accumulation phase
NASDAQ:QQQ has transitioned from accumulation → trend continuation → now entering late-stage momentum expansion
Price reclaimed 50d MA, anchored VWAPs, prior breakdown structure & then accelerated vertically through the 100% Fib retrace
The move from ~$620 → $711 occurred with declining relative volume, increasingly stretched RSI & flattening MACD histogram momentum
Often precedes a dealer-driven melt-up followed by a sharp liquidity sweep
Bullish liquidity already swept prior swing highs near $682–$690
Short gamma resistance likely forced dealer hedging higher
Price is now pushing into 123.6% Fib extension (~$713) while daily RSI is above 80
"Late longs chasing expansion"
If NASDAQ:QQQ pushes $715–$720 & immediately rejects back below $706, that becomes a high-quality buy-side liquidity sweep/bull trap
Even though price made new highs, MACD histogram is no longer accelerating proportionally
Volume is thinning during the steepest part of the rally
RSI is deeply overbought without breadth confirmation from AMEX:IWM
This is not outright bearish, but it is momentum exhaustion behavior
Resistance
$712–$715 → immediate extension resistance
$720 → likely dealer pin/gamma node
$731 → 138.2% extension
Support
$700 psychological
$690–$682 = prior breakout + likely VWAP support
$660 = major gamma support/fair value
Near-term fair value looks closer to $685–$695 than current price
Price is trading at a premium to short-term balance
AMEX:SPY is strong, but Lagging NASDAQ:QQQ
AMEX:SPY remains bullish structurally higher highs, higher lows & strong reclaim above moving averages, but compared to NASDAQ:QQQ , momentum is less explosive, breadth is weaker & extension is more controlled
This is healthier than NASDAQ:QQQ , but also confirms tech concentration remains dominant
Resistance
$738–$740 immediate
$747 extension
$761 major extension target
Support
$725 breakout level
$713 gamma support
$700 major trend support
RSI around mid-70s is still bullish, but vulnerable to momentum compression
MACD still positive, but histogram expansion is slowing similarly to NASDAQ:QQQ
Usually precedes sideways digestion, or sharp 1-to-3 day pullbacks
AMEX:IWM is the most important tell here
While NASDAQ:QQQ is in vertical expansion, AMEX:IWM is only now testing prior highs
Divergence suggests institutions are still crowding mega-cap growth, not embracing broad economic beta
This weakens the durability of the overall rally
Resistance
$287–$288 immediate
$293 extension
$300 major psychological
Support
$276 breakout support
$262 major trend pivot
$250 macro support
Volume + breadth is a critical observation, QQQ/SPY show price expanding & volume declining
If yields spike higher suddenly, this type of thin-volume rally can unwind violently
25Δ Skew
NASDAQ:QQQ 25Δ call IV ~19.3% & 25Δ put IV ~20.3%
AMEX:SPY call IV ~11.1% & put IV ~16.1%
AMEX:IWM call IV ~18.9% & put IV ~21.9%
Across all 3 downside puts remain richer than calls
Market makers are still charging for downside protection, despite the rally
This isn't euphoric upside call-chasing
SPY skew especially shows institutions still hedging downside aggressively
An important caution signal beneath bullish price action
Large OI clusters
NASDAQ:QQQ
$650
$660
$675
$720
$700–$720 likely positive gamma area
A break above $720 could trigger another squeeze
Failure back below $700 could accelerate dealer de-hedging lower
AMEX:SPY
$700 puts
$710 puts
$740 calls
$745 calls
$740–$745 likely strong pinning area
$710 critical downside volatility trigger
AMEX:IWM
$275–$285 calls
Heavy put positioning $258–$266
IWM likely pinned between $275–$290 unless macro changes materially
Current environment looks like realized vol collapsing & implied vol still pricing event risk
Generally supports continued melt-up, until volatility expansion returns, but IV isn't complacent enough to suggest a durable low-vol grind forever
This still feels transitional
1σ expected move (near-term) → approximate weekly expectations
NASDAQ:QQQ ±17–19
AMEX:SPY ±15–17
AMEX:IWM ±8–10
Bearish
Momentum exhaustion
Thinning volume
Divergence
Stretched extensions
Invalidation on sustained acceptance above $720 with expanding volume & breadth
If that occurs next magnet becomes $731
Bullish
Positive gamma remains supportive
Momentum trend still intact
Dealers likely suppressing volatility
Trend continuation possible
NASDAQ:QQQ $720–$731
AMEX:SPY $745–$761
AMEX:IWM $293–$300
The rally is becoming increasingly vertical, increasingly narrow & increasingly low-volume, so this raises probability of a sharp mean-reversion event once buy-side liquidity is exhausted
— the most important signal next week whether NASDAQ:QQQ can hold acceptance above $700 after extension, or if this becomes a classic exhaustion breakout
XLV Long, MaybeThis seems to be in a bullish trend that is possibly setting up for another run. If it can break back above the 50 day MA it could easily reach the 20 day MA. The RSI is entering the oversold area and the SQZPRO is slowing in selling. It also seems that it is sitting on a major support and resistance area. If it breaks through the current 143 area it can easily go back to 134 but, if not, it will rise back through the currently market markers on the Guardian Breakout System.
9 + 21 emaUse 5-min timeframe for both
9 EMA crossing above 21 EMA while price is above VWAP = high-conviction call entry
9 EMA crossing below 21 EMA = momentum flipping → avoid calls
Price pulling back to 9 EMA and bouncing = continuation entry in trend direction
All three aligned (9 EMA > 21 EMA + price above VWAP) = strongest signal
Bitwise Bitcoin ETF | BITB | Long at $37.08Back in AMEX:BITB at $37.08. Crypto is wild beast of speculation, but Bitcoin COINBASE:BTCUSD is the king. I'll leave further analysis to the crypto bros...
More downside may be ahead ("crash" Bitcoin is around $40,000 right now), but even your grandma has heard of Bitcoin / Bitcorn at this point. It's not going anywhere.
Targets into 2029
$44.00 (+18.7%)
$58.00 (+56.4%)
Stock Market Forecast | BTC TSLA NVDA AAPL AMZN META MSFT0:00 — Introduction & Content Overview
A brief roadmap of today's deep dive into the S&P 500, QQQ, Bitcoin, and the "Magnificent 7" stocks.
0:21 — Sector Data: The Power of Rotation
Explanation of why the market avoids a 3–5% "fear drop" as long as money rotates. Even with financials and healthcare in the red, the market stays buoyed because XLK (Tech) remains the primary leader.
2:26 — AAII Sentiment: The "Wrong Side of the Boat"
Analysis of the current sentiment where 39% of participants are still bears or neutral despite the massive move. This suggests the rally has further "fuel" as bears are forced to cover or shift to neutral.
4:07 — Fear & Greed Index
The index is approaching 75 (Extreme Greed). While not a definitive top, it indicates we are entering a zone where confluence of signals (dark pools and charts) becomes critical.
4:43 — Dark Pool Activity (INTC, AMD, MU)
Details on heavy dark pool prints for Intel (around 108 and 113) and other semiconductors. Currently, price action remains above these levels, signaling short-term accumulation.
5:59 — Economic Calendar: CPI and PPI
A look at next week's inflation data. With oil prices rising, the forecast of 3.8% will be a major test for the market's current valuation.
Major Indices & Bitcoin
6:29 — SPY: Fibonacci Support Levels CME_MINI:ES1!
The S&P 500 is in "no resistance" territory. A healthy pullback to the 0.382 Fib level (around 712) would be a constructive bull flag, not a sign of a crash.
9:25 — QQQ: RSI Overbought Conditions CME_MINI:NQ1! NASDAQ:NDX
The Nasdaq is showing extreme strength but carries a daily RSI of 83–85. While overbought can stay overbought, an 8% retracement to the 651 level would still keep the long-term monthly bull flag intact.
11:14 — Bitcoin ( CRYPTOCAP:BTC ): Breaking the Resistance
Bitcoin has finally cleared its multi-month rejection zone by forming higher lows. Now back-testing 82,000 as support, with a clear path toward the 84,000–85,000 zone.
The Magnificent 7
12:24 — Tesla (TSLA): Support Flip & Uptrend
Tesla has successfully flipped prior resistance into support. After breaking its downtrend with high volume, it is now targeting the 430 resistance level.
13:54 — Meta (META): Relative Weakness
Meta remains stuck in its earnings gap. Unlike the rest of the market, it hasn't filled the gap, suggesting it may trade sideways until rotation leaves the semiconductors and enters software.
15:12 — Amazon (AMZN): Historical Consolidation Patterns
Amazon is holding its earnings low. Typically, this stock moves in "stair-steps," meaning a period of sideways chop between 250 and 256 is expected before the next breakout.
16:05 — Microsoft (MSFT): Waiting for the Software Bid
Microsoft has been "flat" lately. As the IGV (Software Sector) starts to catch a bid, watch for a breakout above 432 to help hold up the Nasdaq.
16:54 — Google (GOOGL): The Strongest Chart
Google remains the leader of the pack with a confirmed monthly bull flag. Major support is now at 385 (prior resistance), with virtually no overhead resistance left.
17:49 — Apple (AAPL): Tightening Range Breakout
After eight months of tightening, Apple used earnings as a catalyst to break bullish. It is now eyeing the 300 psychological mark as its next major target.
18:52 — Nvidia (NVDA): Earnings Anticipation
Nvidia is holding prior resistance as support but is largely trading in a channel while waiting for its latest earnings report. The direction of the next leg (toward 250 or back to 180) will likely be decided by that catalyst.
USO - Higher for LongerThis is my roadmap which shows key support. The green support levels are strong while the blue is weaker support level. You will see purple as I believe USO will remain above $120 for the next 3-4 weeks. I have 95% confidence that USO will remain above $105 for next 1-2 months. $95 as the best case scenario where a major peace treaty is signed between the US and Iran (doubtful).
Opening (IRA): IWM May 15th 220 Monied Covered Call... for a 214.82 debit.
Comments: Adding at intervals, assuming I can get in at break evens/strikes better than I currently have on. Selling the -75 delta call against shares to emulate the delta metrics of a 25 delta short put, but with the built-in defense of the short call.
Metrics:
Max Profit: 5.18
Buying Power Effect: 214.82
ROC at Max: 2.41%
Will generally look to run this to expiry and look to take profit at or near max and/or roll out the short call on approaching worthless.
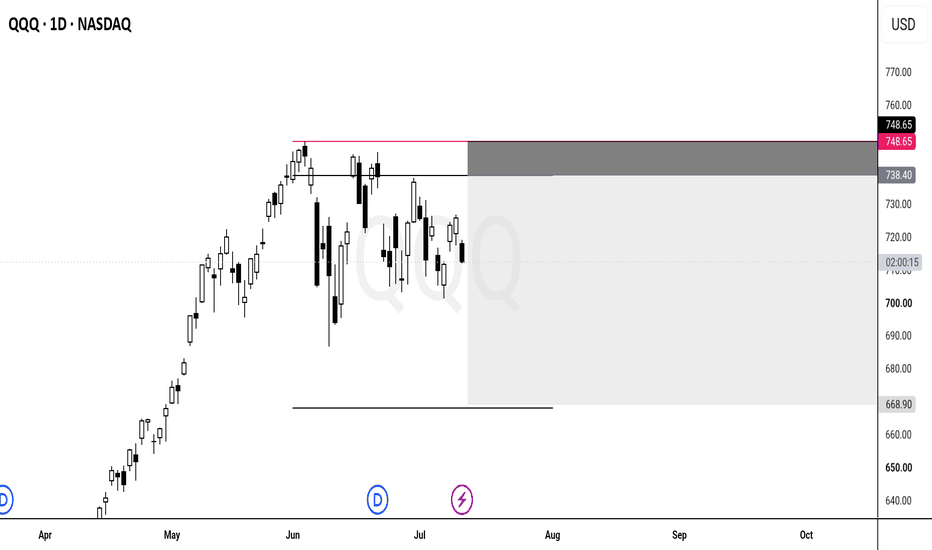
QQQ Nasdaq 100 ETF Updated Price TargetIf you haven`t bought the dip on QQQ:
Here’s the based bull case scenario:
Strong technical momentum near records: QQQ continues to hold above key moving averages and has repeatedly set new highs in 2026. Bullish gamma from options flow, institutional buying, and a clean break above recent resistance could drive a steady grind toward the $740 zone
Macro tailwinds supporting growth stocks: Cooling inflation, resilient GDP growth, and the Fed’s expected accommodative policy (or steady rates in a Goldilocks environment) favor high-beta tech and growth assets.
Lower yields and easier financial conditions historically fuel multiple expansion in the Nasdaq-100.
AI-driven earnings supercycle: Nasdaq-100 companies are forecast to deliver double-digit EPS growth in 2026, powered by massive AI capex, productivity gains, and strong margins in semiconductors, software, and cloud.
Corporate buybacks and sustained tech spending provide a powerful structural tailwind.
What serious analysts & outlets are saying:TipRanks:
Average 12-month price target $768 (10%+ upside from current levels), with highs up to $964.
ETF Action / Motley Fool: Wall Street analysts project a 24.8% return over the next 12 months based on underlying holdings.
Stockscan.io: December 2026 target around $737, with some months showing $754+.
Long Forecast & other models: Year-end 2026 levels in the $900+ range in bullish scenarios, with $740 well within the base case.
Bottom line: Technical strength at record levels, supportive macro policy, explosive AI-driven earnings growth, and widespread Wall Street targets well above current prices make $740 a high-probability year-end level for QQQ in 2026.
GLD Daily — Buyers Still Have Work To DoAMEX:GLD is bouncing, but I’m not treating this as bullish control yet.
This chart has one main message:
Buyers are not in full control until they remove the bearish sequence.
Right now, price is pressing back into the sellers’ reload zone. That matters because this is the exact area where weak bullish bounces usually get tested. A bounce into resistance is not strength by itself. It only becomes strength when price breaks the structure that is keeping the bearish idea alive.
For me, the key level is simple:
The bearish sequence invalidation point.
Until AMEX:GLD breaks that point, the lower bearish target remains part of the map.
That does not mean price must collapse.
It means the chart has not earned a clean bullish reading yet.
What I’m watching:
If sellers defend this reload zone, the bearish target below becomes the next logical draw.
If buyers break through the invalidation point, then the bearish sequence loses authority and the chart needs to be reassessed from a bullish continuation perspective.
The lower buyer reload area is also important. If price reaches it, I would not treat it as random weakness. I would treat it as a major reaction zone where longer-term buyers may step back in.
So the chart is not about guessing gold.
It is about pressure.
Sellers are defending from the reload zone.
Buyers need to prove they can break the invalidation point.
Until that happens, I’m not giving the bounce more credit than it deserves.
Not financial advice.
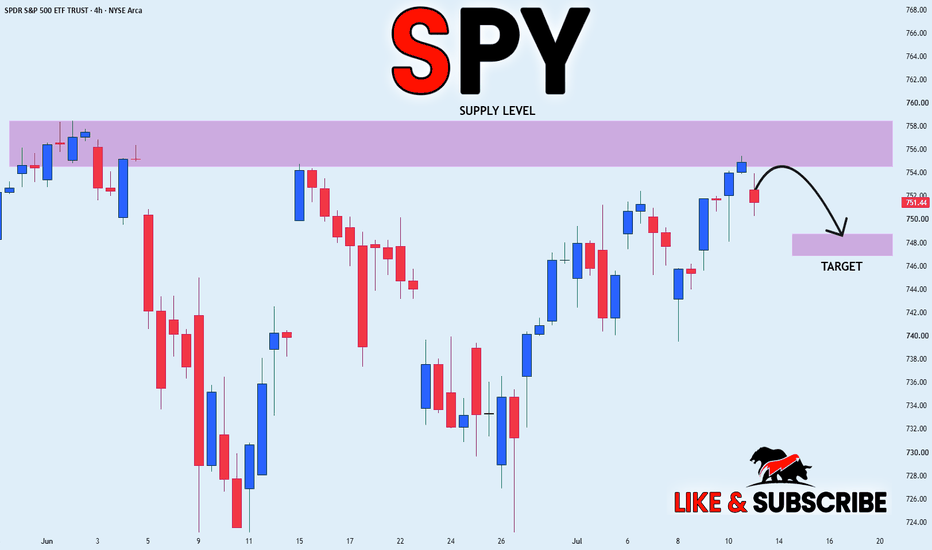
SPY S&P500 ETF Updated Price TargetIf you haven`t bought the W-Shaped Recovery on SPY:
Here’s the bull case scenario:
Strong technical momentum near records: SPY has repeatedly set new highs in 2026 and is holding above key moving averages. A continuation of the uptrend with bullish gamma from options flow and institutional buying could easily push it through $750–$760 resistance toward the $780 zone.
Macro tailwinds supporting risk assets: Cooling inflation (FOMC projecting 2.5% by year-end), resilient GDP growth (~2.3%), and expected Fed rate cuts or steady accommodative policy are creating a Goldilocks environment for equities.
Lower yields and easier financial conditions historically drive multiple expansion in the S&P 500.
Robust corporate earnings and AI supercycle: S&P 500 EPS is forecast to grow 12% in 2026 (and 10% in 2027), fueled by AI adoption boosting productivity and margins across tech, healthcare, and industrials.
Corporate buybacks remain strong (> $1T annually), providing a structural bid.
What serious analysts & outlets are saying:
Goldman Sachs: Base case S&P 500 at levels implying ~12% total return for 2026, driven by earnings and AI.
Morgan Stanley: Year-end 2026 S&P target of 7,800 (SPY ≈ $780).
Oppenheimer / Deutsche Bank: Bull cases see S&P 8,000–8,100 (SPY $800+).
Wallet Investor & TipRanks consensus: SPY targets of $768–$848 by end-2026, with average 12-month forecast around $841–$849.
Technical strength at record levels, supportive macro policy, double-digit earnings growth from AI, and widespread Wall Street targets well above current prices make $780 a high-probability year-end level for SPY in 2026.
SLV Weekly — Bullish Reload Zone or Bearish Continuation Trap?AMEX:SLV is sitting in an important weekly decision area.
The bigger picture is not clean bullish continuation yet. Price is currently reacting near a bearish sequence area, and as long as that bearish sequence remains valid, the downside target cannot be ignored.
My read:
1. The bearish sequence is still alive.
Price has not fully broken through and invalidated the bearish structure. Until that happens, the lower ABC target remains a valid possibility.
2. The current area is not a clean breakout yet.
SLV is trading around a key reaction zone where sellers can still defend structure. A push into this zone alone is not enough. I want to see price actually break through and invalidate the bearish sequence before removing the downside scenario.
3. Buyer Reload Zone is below.
The WCL area remains the major zone where buyers may reload if price pulls back deeper. That zone matters because it could become the next structural decision point for silver.
4. The invalidation is simple.
If price breaks through the bearish sequence and holds above it, then the downside target loses strength and the structure can shift back toward bullish continuation.
For now, I am treating SLV as a weekly structure map:
Bearish case:
Sequence remains valid → downside target remains possible.
Bullish case:
Price breaks and invalidates the bearish sequence → bearish path weakens and buyers regain control.
No prediction here. Just structure.
Let price prove which path is real.
Not financial advice.
Trading Education Series Post No. 006 - Descending TriangleA descending triangle is one of the clearest bearish price action structures because it shows a market where buyers keep defending the same support level, but sellers keep pressing price lower on every rebound. The bottom of the pattern stays relatively flat, while the highs continue to drop. That tells you the market is compressing downward into support. 📉
This is not just “price going down.” It is a very specific structure.
A true descending triangle usually has:• A clear bearish trend or bearish context before the pattern begins• A relatively flat support line across the bottom• A descending resistance line across the highs• Multiple tests of support• Lower highs on each rebound• Price tightening as it approaches the apex• Then a breakdown through support
That tightening is what makes the pattern important. It shows pressure building.
Think about the psychology behind it:Buyers keep trying to hold the same floor. Every time price reaches that area, they respond. But the problem is that the bounces keep getting weaker. Sellers do not let price recover as far as it did before. That means supply is becoming more aggressive while demand is becoming less effective. Over time, the market starts leaning harder and harder on support until that level finally gives way. Once it breaks, the move lower can accelerate quickly as trapped longs exit, short sellers pile in, and momentum traders join the breakdown. 🔥
✅ What confirms a strong descending triangle?• Support is clearly flat, not sloppy or drifting• Highs are clearly declining• Price compresses into the support level• The breakdown candle closes decisively below support• Volume expands on the break• A retest from underneath fails and old support turns into resistance
That failed retest is often one of the most important clues. Why? Because it shows that the level buyers were once defending is no longer acting as support. Once price comes back to it and gets rejected, the market confirms the role reversal.
⚠️ Warning signs:• Price breaks support but quickly jumps back inside the pattern• There is little or no follow-through after the break• Volume stays weak on breakdown• The “support” line is not really flat• The highs are not clearly stepping lower• The pattern is too messy to define cleanly
Not every triangle is worth trading. If the structure is unclear, skip it. Precision matters.
🎯 Common target method:A simple measured move is to take the height of the triangle and project that same distance below the support break. It is not a guarantee, but it gives traders a logical framework for building a trade plan.
Example:If the triangle is $3 tall from descending resistance down to support, some traders will project roughly $3 below the breakdown level as a potential target.
🛠 Practical trading mindset:Do not force the pattern.Ask:• Is support actually flat?• Are the highs truly getting lower?• Is price compressing into the floor?• Did the break happen with conviction?• Did the retest fail?
The edge is not in drawing random lines on a chart. The edge is in understanding what the structure is telling you about control.
A descending triangle is bearish because it shows buyers defending one area while sellers quietly gain control on every bounce. By the time support breaks, the imbalance between supply and demand has usually been building for a while.
Learn to recognize that pressure before the breakdown, and you stop seeing random candles… and start seeing the market’s internal weakness before the move unfolds. 📚🔥
5/7/26 - $qqq - Some thoughts...5/7/26 :: VROCKSTAR :: NASDAQ:QQQ
Some thoughts...
- AI+chips+power are now carrying the whole tape
- Monster reversion off lows
- Rates still high
- Geopol FAFO still relevant
- Entering mid-term seasonally weak period
- This feels like distribution
- Chasing upside here will need to be well-managed
- Even a -10% pullback puts us back at previous highs
- Given call-put ratio, and 5/15 upon us, not hard to see some funky action/ reversion lower.
- a 5ish% pullback and then a retest/ fail here is quite bearish and likely sends us lower
- oil is sticky higher...
- find your hedges
- hard to "short the index"... but it's probably a good time to look around figure out what's run 50%+ in a *checks calendar* a month... and ask yourself if it's sustainable
V
May 2, 2026 DBC. Continued stock growth.- Exchange: Bitget TradFi
- Instrument: DBCon
- Timeframe: Weekly
- Trade type: Buy stop order
- Price: 31.11
- Take Profit: Open
- Stop Loss: 30.00 (-3.60 %)
Idea: Long on a breakout above last week's high — bullish momentum continuation.
Entry: Buy stop above last week’s high.
Stop-loss: Below the low of the same candle. A pullback below this level invalidates the trade.
Take Profit: Trailing stop following the lows of new weekly candles.
This is not an individual investment recommendation.
A list of over 250 Bitget TradFi (stock tokens)
April 28, 2026 PDBC. Continued stock growth.- Exchange: Bitget
- Instrument: PDBCon (Ondo Finance)
- Timeframe: Weekly
- Trade type: Buy stop order
- Price: 17.90
- Take Profit: Open
- Stop Loss: 17.00 (-4.90 %)
Idea: Long on a breakout above last week's high — bullish momentum continuation.
Entry: Buy stop above last week’s high.
Stop-loss: Below the low of the same candle. A pullback below this level invalidates the trade.
Take Profit: Trailing stop following the lows of new weekly candles.
This is not an individual investment recommendation.
April 25, 2026 XLE. Continued stock growth.- Exchange: Kraken
- Instrument: XLEx/USD (xStocks)
- Timeframe: Weekly
- Trade type: Buy limit order
- Price: 57.19
- Take Profit: Open
- Stop Loss: 54.80 (-4.20 %)
Idea: Enter on a breakout of the high of last week’s candle - a signal of continued upward momentum.
Entry: Buy Stop above last week’s high.
Stop-loss: Below the low of the same candle. A pullback below this level invalidates the trade.
Take Profit: Trailing stop following the lows of new weekly candles.
This is not an individual investment recommendation.
Risk-InvestingThe dimension in asset management that makes the difference.
In investing, it is not only important to understand how much a portfolio can potentially earn. It is also essential to understand how much risk it “consumes” to pursue that return.
This implies a different way of understanding risk: not only as a consequence of investment decisions, nor merely as an objective to control, but as the fuel that allows investors to pursue certain levels of return.
From this perspective, asset management includes a critical dimension: optimizing the consumption of risk required to achieve those returns.
To understand this, it is necessary to analyze risk in layers: where it comes from, how it is distributed within the portfolio, how it relates to the expected and required returns of the assets and the portfolio as a whole, and how it can be optimized through different asset selection, asset-weighting, or diversification strategies.
This is one of the key educational areas of our analysis, simulation, and virtual investing platforms, offering 25 core risk and risk-adjusted performance metrics and ratios, including statistical analysis across different confidence levels, benchmarking analysis, and multiple scenario-simulation methodologies.
Because portfolio management is not only about pursuing returns.
✅ It is about learning how to measure, interpret, and optimize the risk required to achieve them.
What is portfolio management — and what is not?Portfolio management is not about teaching how to select “good assets” or “undervalued assets”, nor about trying to identify the best market timing to enter or exit a position using asset-tracking platforms. That is not portfolio management; it is something else. Nor is trading.
An asset may look attractive on a standalone basis, but its true contribution within a portfolio depends on how it contributes to the return, risk, and diversification of the overall portfolio.
These principles, reflected in academic frameworks such as Modern Portfolio Theory, are often overlooked or treated in a purely theoretical way because they can be difficult to teach and assimilate, especially in areas such as risk or diversification. Unfortunately, too often we see excessive filler around less relevant concepts, and students also spend too much time performing calculations in spreadsheets.
What makes TwoTails® Portfolio Management unique?
TwoTails® PM provides a practical environment for portfolio management education that allows students to work with professional tools, real market data, and an experience specifically designed for education, enabling them to understand and explore in depth the core elements of a portfolio management syllabus:
1. Evaluate in depth each asset or asset class through its three dimensions within a portfolio, from different analytical perspectives
• Its contribution to return.
• Its contribution to risk.
• Its contribution to diversification.
In this way, students can analyze how each component affects the overall portfolio profile by combining these variables and approaching the analysis through analytical frameworks and financial modelling techniques.
2. Understand the overall risk-return profile of the portfolio
TwoTails® Portfolio Management also enables students to analyze the relationship between return and risk, not only at the individual asset level, but especially from an overall portfolio perspective.
The platform helps students understand how portfolio asset selection, weighting, and diversification decisions can modify the portfolio’s risk-return efficiency.
Ah, and one more thing: it all happens within a gamified environment — one that students love, and professors use to engage students in active learning.