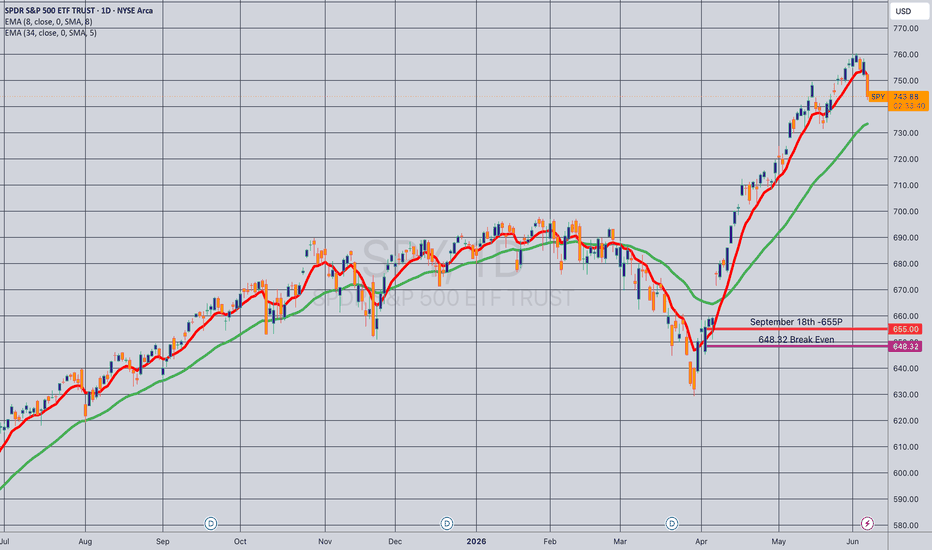
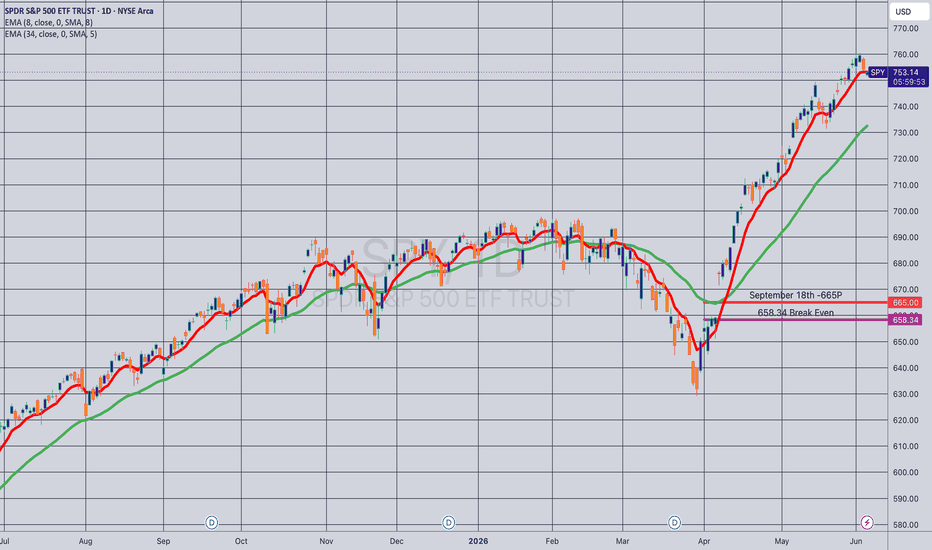
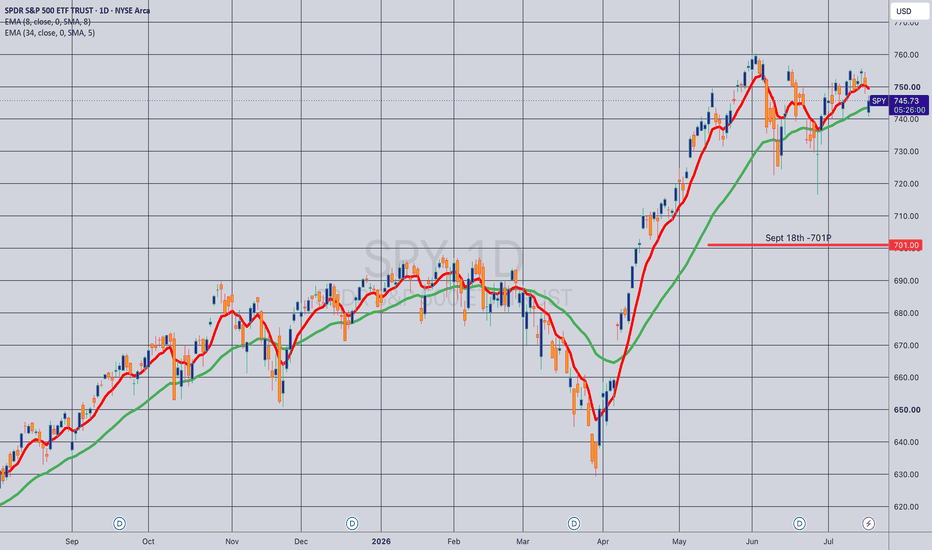
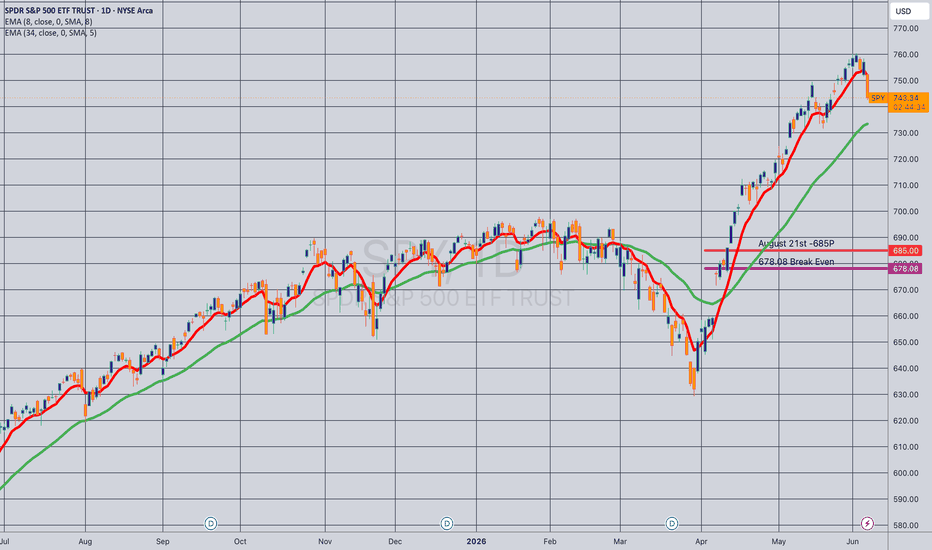
Opening (IRA): TLT August 17th -81P... for a 1.08 credit.
Comments: Laddering out on the put side on weakness, rolling out the call side on strength is my general modus operandi here.
I currently have the 83's on in June, the 82's in July, the 81's in August, coupled with the August 89 covered calls.
ETF market
Opening (IRA): TLT July 17th -82P... for an .86/contract credit.
Comments: I've been targeting the 83 strike, but since the 82's paying a smidge greater than 1% of the strike price in credit, hitting that strike here. I probably don't need additional shares of TLT, but if the market will give them to me at 82/share, who am I to complain?
Research 18.06.2026🌏 Markets:
AMEX:SPY +3.89 +0.52%(pre/m)
NASDAQ:QQQ +10.85 +1.50%(pre/m)
🆕 Economic News:
THE US AND IRAN ELECTRONICALLY SIGNED A MEMORANDUM OF UNDERSTANDING TO END THE WAR. (It entered into force on Wednesday.)
FOMC — Fed interest rate = 3.75%
-- Expected: 3.75% / Previous: 3.75%.
-- THE FED’S MEDIAN RATE PROJECTION FOR THE END OF 2026 WAS RAISED TO 3.8% FROM 3.4%.
-- 9 OF 18 FOMC PARTICIPANTS EXPECT A RATE HIKE IN 2026.
Tomorrow is a federal holiday in US markets. The S&P and Nasdaq index rebalances have been moved to today, along with quadruple witching. More details on US market holidays here.
08:30 USA – Initial/Continuing Jobless Claims
08:30 USA – Fed Manufacturing Index
📈 Gap Ups
Reaction to earnings/guidance:
Other news:
NASDAQ:CAST entered into a reseller agreement for Starlink Business services, adding broadband access to its portfolio.
Trump said that NASDAQ:AAPL will cooperate with NASDAQ:INTC on chip development and manufacturing in the US.
Semiconductors sector is rising: NASDAQ:IMOS NYSE:UMC NASDAQ:MRVL NASDAQ:WDC NASDAQ:ACMR NYSE:ASX NYSE:VSH NASDAQ:AMKR NASDAQ:SIMO NASDAQ:MU NASDAQ:ARM NASDAQ:ASML
US signs $725 million loan pact with Energy Fuels to boost domestic rare earth production: AMEX:UUUU NYSE:LEU NYSE:OKLO NYSE:SMR NASDAQ:ENLT NASDAQ:IREN
NASDAQ:MRNA mRNA flu vaccine faces FDA advisory panel scrutiny
NASDAQ:RUM Jumps After Video Platform Takes Big Step in Its AI Pivot
📉 Gap Downs
Reaction to earnings/guidance:
NYSE:ACN NYSE:KR
Other news:
NYSE:IBM falls in sympathy to NYSE:ACN
NASDAQ:LEGN offering of 7,700,000 Shares / price of $29.35 per ADS total are expected to be approximately $226 million
Berenberg downgrades NASDAQ:CTSH as AI risks cloud IT services outlook to Hold from Buy and cut its price target to $59 from $81 / NSE:INFY falls in sympathy to CSTH
ASX:BHP plans to record a write-down of approximately $2.3 billion on its Jansen potash development in Canada after revising upward the expected cost of expanding the project.
NYSE:PFE Announces Chief Financial Officer (CFO) Transition
‼️ Additional
The S&P and Nasdaq index rebalances have been moved to today, along with quadruple witching.
-- Nasdaq-100 additions: NASDAQ:CRWV NASDAQ:NBIS NASDAQ:ALAB NASDAQ:RKLB NASDAQ:TER
-- Nasdaq-100 deletions: NASDAQ:CHTR NASDAQ:CTSH NASDAQ:INSM NASDAQ:VRSK NASDAQ:ZS
-- S&P 500 additions: NASDAQ:MRVL NASDAQ:FLEX
-- S&P MidCap 400: ROKU, CDE, SMTC, SANM, and VIAV will be added; BRBR and BLKB will be removed.
-- S&P SmallCap 600: POOL, CPB, COTY, and CNXC will be added; EMBC and UHT will be removed.
ALL FED MEMBERS NOW EXPECT STRONGER AND MORE PERSISTENT INFLATION.
-- The Fed’s median rate projection for the end of 2026 was raised to 3.8% from 3.4%.
-- 9 out of 18 FOMC participants expect a rate hike in 2026. — FOMC materials
-- JPMorgan: A very hawkish signal from the Fed.
-- Warsh: The leadership change at the Fed is a timely opportunity to review existing practices.
-- WARSH: A NEW WORKING GROUP WILL BE CREATED ACROSS FIVE AREAS OF MONETARY POLICY.
Working group areas: Fed communications, the Fed balance sheet, use of existing data sources, productivity and jobs, inflation.
-- Warsh: I expect to see some results from the groups by the fall, and completed task force work by the end of the year.
-- The Fed will no longer publish “forecasts” / forward guidance, which for a long time had been viewed as an indicator of what actions the Fed might take next.
Trump will soon introduce new tariffs while refunding funds from old ones, as the Treasury has started losing tariff revenue — BBG.
Iran-US talks will take place on Friday in Switzerland. A number of technical issues will be discussed, including Iran’s nuclear program — Al Arabiya.
-- Iranian President Pezeshkian published the text of the memorandum of understanding signed with the US.
-- Iran and the US commit to holding talks on a final agreement within 60 days — memorandum.
-- The deadline for a final agreement between Iran and the US may be extended by mutual consent — memorandum.
-- Trump had previously said the talks could last longer than 60 days.
G7 countries decided to reduce dependence on supplies of critical minerals, including rare earths, from China — statement.
🏢 IPO
NASDAQ:KARD – Kardigan
Company develops treatments for serious heart and cardiovascular diseases where there are currently no approved therapies. Lead drug, danicamtiv, is being tested for a genetic form of dilated cardiomyopathy, a disease that weakens the heart muscle. The company also has programs for aortic valve disease and severe hypertension after hospitalization. No product revenue yet.
Price: $16.00
Shares: 25.0M
Raised: $400.0M
LTM:
Revenue: $0
Net Income: -$230.0M
Comparable public companies: NASDAQ:CYTK , NYSE:BMY , NASDAQ:IONS , NASDAQ:ALNY , AQUISEU:VERV
📋 List of tickers involved:
NASDAQ:CAST NASDAQ:AAPL NASDAQ:INTC NASDAQ:IMOS NYSE:UMC NASDAQ:MRVL NASDAQ:WDC NASDAQ:ACMR NYSE:ASX NYSE:VSH NASDAQ:AMKR NASDAQ:SIMO NASDAQ:MU NASDAQ:ARM NASDAQ:ASML AMEX:UUUU NYSE:LEU NYSE:OKLO NYSE:SMR NASDAQ:ENLT NASDAQ:IREN NASDAQ:MRNA NASDAQ:RUM NYSE:ACN NYSE:KR NYSE:IBM NASDAQ:LEGN NASDAQ:CTSH NSE:INFY ASX:BHP NYSE:PFE NASDAQ:CRWV NASDAQ:NBIS NASDAQ:ALAB NASDAQ:RKLB NASDAQ:TER NASDAQ:CHTR NASDAQ:INSM NASDAQ:VRSK NASDAQ:ZS NASDAQ:FLEX NASDAQ:ROKU NYSE:CDE NASDAQ:SMTC NASDAQ:SANM NASDAQ:VIAV NYSE:BRBR NASDAQ:BLKB NASDAQ:POOL NASDAQ:CPB NYSE:COTY NASDAQ:CNXC NASDAQ:EMBC NYSE:UHT NASDAQ:KARD NASDAQ:CYTK NYSE:BMY NASDAQ:IONS NASDAQ:ALNY AQUISEU:VERV
Best regards – hi2morrow team.
SPY - Fresh Bear Print From Yesterday Hasn't Decayed at All.SPY's Fresh Bear Print From Yesterday Hasn't Decayed at All.
Structural Assessment
SOM is reading Impulse Cont. Bull transitional, 29 primary FVGs
alive, 0 touched. ACE is RED, Q3 neutral, ACE Score 3. IMP is
scoring 0/5, NONE mode, WAIT. RCZ has come in to 39th percentile,
ATR to 50th, Vol Elev down to 22nd, compressed from yesterday's
80th/43rd/92nd. The notable thing is the announcement itself,
yesterday's fresh bear print at CQJ 68.62 is showing the exact
same conviction read this morning, now 8 bars old, with zero
decay. That's different from NVDA's version of the same situation
overnight, where the fresh print cooled hard. Anti-signal has
cleared, no DISBELIEF flag.
Tactical Cheat Sheet
Resistance: 745.80-748.0 -- today's session high and the gap zone above
Hard resistance: 750.30-752.15 -- this week's breakdown origin
Current price: 744.30
Support: 741.02-742.10 -- nearest shelf below
Key support: 738.42-739.54 -- yesterday's tested floor
Thesis line: 721.17-721.23 -- the broader structural floor
Two paths from here:
Hold path: Vol Elev climbs off the 22nd percentile floor, RCZ and
ATR follow, the unchanged bear conviction gets backed by real
participation. Price loses 741.02, opens 738.42-739.54.
Fade path: Vol Elev stays compressed, the bear print just keeps
aging without confirmation, price drifts back into 745-750.
What the Stack Is Watching
This is the cleanest standing announcement of the three names this
morning, full conviction held without decay across 8 bars. NVDA's
version of the same kind of print from yesterday already cooled by
half. Whether SPY's holds up the same way through today's session
is worth tracking directly against NVDA's.
---
Built with SYNTHESIS v3.3 | SOM / ACE / IMP / SYNTHESIS
Study, not financial advice.
WHEAT is looking bullishCould warn us food prices will go higherIf the prices of wheat go higher so will food prices. This chart is another piece of evidence that inflation could pick up as well as the 10y bond is warning us with a bull flag on that chart! More market warning signs that the market is simply ignoring! When reality hits it will catch many by surprise.
I cut my WEAT position!AMEX:WEAT PEPPERSTONE:WHEAT
In summary I took a loss on this trade! I'm going over why I did what I did and we reflect on what I could of done better for next time! I hope you all can learn from my mistakes, tiny of a loss it may be but the learning processes is what matters and how to avoid them next time.
SPY - Hourly Chart Looks Quiet. The Daily Chart Disagrees.SPY's Hourly Chart Looks Quiet. The Daily Chart Disagrees.
Structural Assessment
1H: SOM is reading Impulse Cont. Bull transitional. 29 primary
FVGs alive, 0 touched -- a fresh, fully untested pool. ACE is
YELLOW, Q2 neutral, CQJ 60.3. IMP is scoring 0/5, NONE mode, WAIT.
RCZ sits at 14th percentile, ATR at 19th, Vol Elev at 2nd -- about
as quiet as the dashboard gets. Last Ann is an 8-bar-old bear
print at CQJ 48.13, still working against the bull transitional
read.
Daily: A different picture. SOM still reads Impulse Cont. Bull
transitional, but 5 of 38 primary FVGs are now touched, and the
touch-active zone is the 744.87-748.37 box price gapped down
through yesterday. ACE flips to GREEN with Q4 SHORT direction --
the same light-versus-quartile disagreement from earlier this
week, just inverted. IMP is scoring 3/5 in MIXED mode. RCZ is at
97th percentile, Vol Elev at 87th. Entry Signal is PARTIAL.
MIRROR state is reading PANIC. Open Hour flag is active. The Daily
stack is carrying real weight while the Hourly has gone almost
silent.
Tactical Cheat Sheet
Resistance: 754.69-756.68 -- this week's touch-active ceiling
Hard resistance: 760.40 -- the Daily high
Current price: 751.26
Support: 744.87-748.37 -- yesterday's gap zone, now acting as
floor on a retest
Key support: 739.54-741.72 -- next structural shelf below
Thesis line: 719.4-721.17 -- corroborated by the Daily's 720.47
Two paths from here:
Continuation (matching the Hourly's bull transitional read):
Vol Elev climbs off the 2nd percentile floor, RCZ and ATR follow,
IMP scores 1+ in PART mode, price clears 754.69 cleanly.
Opens 756.68, then 760.40.
Retreat (matching the Daily's Q4 SHORT, PANIC, PARTIAL signal):
Price fails to hold 748.37 with Vol Elev entering on a down move,
Daily IMP pushes past 3/5, RCZ extends further into the 97th.
Reopens 739.54-741.72.
What the Stack Is Watching
The disagreement worth tracking is which timeframe's light is
right. The Hourly's ACE is yellow with a neutral quartile and
almost no participation behind it. The Daily's ACE is green but
the quartile direction is SHORT, with PANIC active and a PARTIAL
signal already loaded. When the Hourly catches up to the Daily's
volume read is today's question.
---
Built with SYNTHESIS v3.3 | SOM / ACE / IMP / SYNTHESIS
Study, not financial advice.
Research 17.06.2026🌏 Markets:
AMEX:SPY +0.04 +0.01%(pre/m)
NASDAQ:QQQ +2.80 +0.38%(pre/m)
🆕 Economic News:
08:30 USA – Retail Sales
10:00 USA – Business Inventories
10:00 USA – Pending Home Sales
10:30 USA – EIA Crude Oil/Gasoline Stocks Change
14:00 USA – Fed Interest Rate Decision/FOMC
14:30 USA – Fed Press Conference
📈 Gap Ups
Reaction to earnings/guidance:
NYSE:PGR
Other news:
NASDAQ:AEHR Receives Follow-On Order From Major Silicon Photonics Customer for Fully Automated Wafer-Level Burn-In System for Hyperscale Data Center Optical Interconnect
NASDAQ:ASTS Announces Successful Orbital Launch of BlueBirds 8, 9, and 10
NYSE:NVO to File Oral Wegovy in China
NASDAQ:INTC 18A-P chip process enters early production
Cathie Wood bought $529.7 million of NASDAQ:SPCX stock on its first day of trading and sold NASDAQ:TSLA shares at the same time.
NASDAQ:CLWT Announces The Appointment Of Strategic Partner To Launch Next-Generation Mobile Hybrid Facility For Enhanced Ballast Water Treatment
📉 Gap Downs
Reaction to earnings/guidance:
NYSE:KMX NYSE:JBL
Other news:
EURONEXT:ORA offering of €850 MILLION Hybrid Notes
Michael Saylor Says ‘AI Summer’ Is Draining Bitcoin Demand, Expects Capital To Rotate Back By Year-End As Frenzy Around OpenAI, SpaceX Fades NASDAQ:MSTR NASDAQ:COIN NYSE:CRCL
French intelligence is terminating its contract with US-based $PTLR in favor of France’s ChapsVision, amid the country’s push for technological independence, French PM Sébastien Lecornu said.
‼️ Additional
The US Congress reached an agreement on the largest housing construction bill in recent years. The bill includes a provision banning the Fed from issuing a digital dollar until 2030.
The US Senate blocked a resolution to limit Trump’s war powers regarding Iran.
Citi raised its year-end S&P 500 target to 8,100 from 7,700.
📋 List of tickers involved:
PGR NASDAQ:AEHR NASDAQ:ASTS NYSE:NVO NASDAQ:INTC NASDAQ:SPCX NASDAQ:TSLA NASDAQ:CLWT NYSE:KMX NYSE:JBL EURONEXT:ORA NASDAQ:MSTR NASDAQ:COIN NYSE:CRCL NASDAQ:PLTR
Best regards – hi2morrow team.
83.50This is market analysis and education using the Socrates/Armstrong–Erwin framework — not financial advice, and I’m not your financial advisor. AGQ is a 2x leveraged ETF that decays over time and carries issuer risk; it can move violently in both directions and is built for short holding periods, not buy-and-hold. Confirm every level on a closing basis, size for the stop rather than the target, and never risk more than you can afford to lose.
VCSH — 200-Week EMA Test. 3R Setup With 4.52% Yield.NASDAQ:VCSH is sitting at $79.00, testing the 200-week EMA for the third time since the fund reclaimed it in 2024. The prior two tests marked by the yellow circles on the chart both produced significant bounces. The DeMarker on the weekly is at the exhaustion level marked by the white arrow.
The setup reads cleanly.
The Fibonacci levels from the chart
The retracement is drawn from the swing low at $76.29 to the swing high at $79.54. Current price at $79.00 sits just below the 0 level at $79.54 and above the 0.236 at $78.77.
The entry zone is the current 200-week EMA confluence at $78.17 to $79.00. The 0.236 at $78.77 and 0.382 at $78.30 provide additional support layers below current price.
The target is the 0.618 Fibonacci extension at $81.54. From the current entry at $79.00 that is a $2.54 move to the upside.
The stop is a weekly close below $76.29, the full 1.0 retracement level. Risk from entry is $2.71.
Risk-reward is approximately 1:1 on price alone. When the 4.52% annual yield paid monthly is included across the holding period, the total return on the trade at target is meaningfully above 3R.
The 50-week EMA confirmation
The 50-week EMA remains above the 200-week EMA on both charts. That is the single most important technical condition for the long-term accumulation strategy. It confirms the overall trend structure is intact despite the near-term pullback. The chart note states: once we got back above the 200-week EMA in 2024 it held. That structural condition is unchanged.
No leverage on this setup.
This is a long-term capital allocation trade in an income-generating instrument. Leverage defeats the entire purpose.
Not financial advice. All levels are for analytical purposes only.
SOXL: Correction Within the Long-Term AI SupercycleAfter a powerful rally, the ETF faced profit-taking near the major resistance around 272. However, the overall structure remains strongly bullish. The current pullback appears to be a normal correction within a broader uptrend and may create a new opportunity for accumulation.
The trading plan focuses on potential buying opportunities around 204-181 if demand returns. Key support is located in the 167-154 area, where previous accumulation and major moving averages converge. Upside targets remain at 235, 277 and 345.
From a technical perspective, price continues to trade well above long-term moving averages while the broader rising channel remains intact. Following the sharp advance, the market is entering a cooling phase, which is often a necessary step before the next bullish leg. As long as support levels hold, buyers maintain control of the trend.
Fundamentally, the investment thesis remains tied to the continued expansion of artificial intelligence, data-center construction and high-performance computing demand. Major technology companies continue increasing AI-related capital expenditures, supporting the entire semiconductor ecosystem. With its leveraged exposure, SOXL remains one of the most aggressive vehicles for participating in the semiconductor and AI growth story.
As long as the key support zone holds, the long-term bullish targets at 277 and 345 remain in focus.
SPY Macro Top Imminent? Ascending Channel Resistance & BreakdownTaking a look at the daily timeframe for the SPDR S&P 500 ETF Trust (SPY), we are tracking a very well-defined, multi-year ascending channel. As illustrated in my chart, price action is currently squeezing into a critical confluence zone near the upper boundary of this macro structure. The technicals suggest we may be approaching a massive structural reversal.
Technical Confluence & The Bearish Thesis
Based on the projections outlined in the chart, here is the breakdown of the current setup:
Overextended Channel Dynamics: SPY has been riding a massive blue ascending channel. We are currently testing the absolute upper resistance limit of this structure, an area where supply historically overwhelms demand.
Fibonacci Extension Targets: The recent impulse wave aligns perfectly with major Fibonacci extensions. The 1.618 level ($740.91) has already been cleared, placing the ultimate blow-off top target near the 2.618 extension at $810.60.
The Macro Projection: The custom red path on the chart outlines the primary thesis: a final, exhausted push toward the $800–$810 liquidity zone to trap late buyers, followed by a violent macro rejection.
The Breakdown Scenario
If the rejection plays out as drawn, the key event will be the failure of the lower ascending channel support (currently rising through the mid-$600s). A daily or weekly close below this lower boundary would confirm a macro trend shift, opening the door for a capitulation event targeting historical horizontal supports down into the $400–$500 range.
Key Levels to Watch
Resistance / Liquidity Grab: $800.00 – $810.60 (2.618 Fib Extension)
Immediate Support: $740.91 (1.618 Fib)
Macro Pivot: The lower blue ascending channel trendline.
Directional Bias: Short / Macro Bearish
Disclaimer: This chart and analysis are strictly for educational purposes and do not constitute financial advice. Always use proper risk management and validate with your own strategy before executing any trades.
SPY 4H: Failed Bull Flag Watch — 751.75 Retest Is KeySPY recently attempted to break out through the descending trendline near the 760 area. At first, that move looked like it could develop into a bullish continuation setup, possibly a bull flag after the breakout impulse.
But the 4H chart is now showing weakness.
Price pushed up, failed to hold momentum, and is now pulling back into the prior breakout / structure zone. To me, this looks like the bull flag attempt is starting to fail unless buyers can quickly step back in.
The main level I’m watching now is 751.75.
I lean toward price retesting this area first. That retest should give a much cleaner read. If buyers reclaim and hold 751.75 with a strong candle close, the long idea is still alive. But if price retests 751.75 and rejects, that would confirm weakness for me and increase the chance of continuation lower.
The next downside area I’m watching is around 748.
That 748 zone matters because it lines up with the lower structure / support area on the 4H chart. If 751.75 fails as resistance, I would expect sellers to try to push price toward that 748 reaction zone next.
My dashboard also supports caution here:
Decision : Watch Long, but not confirmed long yet
Playbook : Reversal Build
Setup Quality : B, decent but not clean
Primary Trend : Bull bias
MTF Alignment : Mixed, with bulls not fully in control
VWAP : Price is below VWAP, which weakens immediate bullish conviction
Volume : Low-volume drop, so I’m watching if sellers actually gain strength or if this is just a pullback
VPA : Awaiting confirmation
Precision : No Man’s Land, so I don’t want to chase entries here
My Trade Plan
For longs , I want to see price reclaim and hold 751.75 with confirmation. Ideally, buyers need to show strength near that level instead of just a weak bounce. If that happens, upside areas I’m watching are:
755.43
756.68
Back toward the 760 prior high area
For shorts , I want to see price retest 751.75 and reject. A weak retest, bearish close, or failure to reclaim that zone would make me watch for downside continuation toward:
748 reaction zone
Then lower invalidation / structure near 745.43
Right now, I’m not treating this as a blind long or blind short. It’s a reaction trade.
The 4H chart is basically telling me:
751.75 decides whether buyers are defending the breakout attempt or whether the failed bull flag opens the door toward 748.
Not financial advice — just my chart read and trade plan.
You Don't Have A Trading Psychology Problem"No way, another loss this week? It's the 7th loss. At this rate, I'm going to lose all my capital."
That was me. Friday evening. Scalping EURUSD on the 5-second chart during the New York session. I'd skipped a friend's gathering to trade at home.
"It must be my trading psychology. That's why I'm losing." I opened the PDF of *Trading In The Zone* by Mark Douglas, looking for which part of my psychology I needed to fix.
The YouTube guru told me this strategy would definitely work during New York. All I got were losers.
I was stuck.
Meditation Will Not Make You Profitable
If I train myself to be monk-like and not care about results, I'll be disciplined.
If I'm disciplined, I'll follow my trading rules.
If I follow my rules, I'll be profitable.
I don't know about you, but I thought this was the key to improving my trading psychology.
Little did I know, even with the best psychology, I wouldn't be profitable if the one thing that matters most wasn't solid: the trading strategy.
The strategy looked profitable when the guru showed me on YouTube. But I never collected my own data. I didn't know the win rate. I didn't know the average drawdown. I didn't know the expected value.
If meditation worked, every monk would be a profitable trader.
Good Risk Management Won't Save A Wrong Strategy
OK, but I'm risking 1% per trade. Surely that protects me.
I always kept the 1% rule as my golden principle. I knew the law of large numbers would play out. I knew to focus on execution and let the profits come.
But am I really smart for applying 1% to *any* strategy?
This sweep-and-retest strategy was from another YouTube guru. He showed me 5 wins last week. 5 out of 5. 100% win rate.
Who wouldn't want that?
I put it into action.
- Monday: 2 losses. Normal variance.
- Tuesday: 1 loss. Bad luck.
- Wednesday: no trades.
- Thursday: 1 loss. The winner has to be coming.
- Friday: 3 losses. I took more trades to end the week green.
7 losses. One week.
The market context was completely different from what the guru showed. Good risk management can't help you if the strategy doesn't fit the context.
So how do you know if your strategy fits?
You Don't Have The Data
Win rate 18.9%. Average win 6.34R. Average drawdown 2.76%.
Those are my live numbers.
Do you know yours?
If not, you don't have a psychology problem. You have a process problem. It doesn't matter how many psychology fixes you stack. The root of every loss is in the data you don't have.
I have 1,000 backtested trades. That's where my confidence comes from. Not from a guru. Not from a book. From my own data.
When I'm in drawdown and down for the week now, I don't open YouTube to search for the next system. I close my chart, sit on my sofa, and enjoy my night.
Your Friday night could look like this. The question is: do you have the data to back yourself up.
Get to 100 backtested trades before you conclude anything about your strategy.
Research 16.06.2026🌏 Markets:
AMEX:SPY +0.17 +0.02%(pre/m)
NASDAQ:QQQ +1.59 +0.21%(pre/m)
🆕 Economic News:
08:15 USA – ADP Employment Change Weekly
08:30 USA – Building Permits Prel
08:30 USA – Housing Starts
08:30 USA – Export/Import Prices
16:30 USA – API Crude Oil Stock Change
📈 Gap Ups
Reaction to earnings/guidance:
Other news:
NASDAQ:QCOM in talks to acquire AI chip start-up Tenstorrent for a price of between $8 billion and $10 billion
NASDAQ:SPCX Agrees to Buy AI Coding Agent Cursor for $60 Billion
Memory stocks continues rally: NASDAQ:WDC NASDAQ:MU NASDAQ:SNDK NASDAQ:STX
NASDAQ:HOOD will cut another 10% of its workforce.
📉 Gap Downs
Reaction to earnings/guidance:
Other news:
NASDAQ:EWTX Announces Positive Top-Line Data from 12-Week Phase 2 CIRRUS-HCM Trial with EDG-7500 in Obstructive and Nonobstructive Hypertrophic Cardiomyopathy (HCM)
NASDAQ:TSLA Stock Slides Overnight: Ross Gerber Calls Tesla 'Worthless' Without SpaceX Merger As Retail Bets Rise
NASDAQ:MRVL CEO filed with the SEC to sell 207,000 shares of the company.
‼️ Additional
EU lawmakers approved the trade agreement with the US ahead of Trump’s deadline, July 4.
June 17: Trump’s pick, Kevin Warsh, is set to make his first-ever rate decision as Fed Chair.
-- According to various media reports, Warsh prefers using the “trimmed PCE” inflation indicator, meaning a measure that excludes sharp inflation swings. Warsh also often talks about productivity growth driven by AI adoption, the reduction of the Fed’s balance sheet, and other factors that, in theory, point to lower inflation.
-- All of this may indicate that Warsh is ready to carry out Trump’s push for rate cuts, some experts believe.
Shares of Chinese real estate companies have fallen back to levels seen before the 2024 economic stimulus measures. This points to persistent pessimism toward the sector — BBG.
-- The real estate sector accounts for more than 25% of China’s GDP. Weakness in this sector is raising concerns about China’s broader economy. Chinese stocks are falling NYSE:BABA NASDAQ:BIDU NASDAQ:BILI NYSE:XPEV CFI:ZK NYSE:NIO NASDAQ:PDD
🔁 Business Combination / SPAC Deal
NASDAQ:SLBT – SL Science Holding Limited
Company develops off-the-shelf cellular therapies for solid tumors, including pancreatic and brain cancers. SL Bio completed its business combination with Horizon Space Acquisition II Corp. and will trade on Nasdaq under $SLBT. Core thesis is scalable Gamma delta T cell therapy, designed to avoid the high cost and long manufacturing timelines of traditional personalized cell therapies.
Implied Equity Value: ~$5.57B
PIPE Financing: $7.8M
Trading Date: June 15, 2026
Key points:
Focus on off-the-shelf Gamma delta T cell therapies
Target indications include pancreatic and brain cancers
Company is still preclinical / early clinical-stage
Main risk is execution: clinical data, manufacturing scale and regulatory path
Comparable public companies: NASDAQ:FATE , NASDAQ:NKTX , NASDAQ:IOVA , NASDAQ:LEGN , NASDAQ:CRSP
📋 List of tickers involved:
NASDAQ:QCOM NASDAQ:SPCX NASDAQ:WDC NASDAQ:MU NASDAQ:SNDK NASDAQ:STX NASDAQ:HOOD NASDAQ:EWTX NASDAQ:TSLA NASDAQ:MRVL NYSE:BABA NASDAQ:BIDU NASDAQ:BILI NYSE:XPEV CFI:ZK NYSE:NIO NASDAQ:PDD NASDAQ:SLBT NASDAQ:FATE NASDAQ:NKTX NASDAQ:IOVA NASDAQ:LEGN NASDAQ:CRSP
Best regards – hi2morrow team.
SPY - Pushed Into Resistance Yesterday and...SPY Pushed Into Resistance Yesterday and Has Gone Completely Quiet Since.
RCZ and ATR are both sitting near the floor this morning.
Structural Assessment
SOM is reading Impulse Cont. Bull transitional on SPY 1H.
26 primary FVGs alive, 2 touched. The pool from this leg
higher remains largely unengaged -- price hasn't gone back
to test most of what it built on the way up.
ACE is GREEN with Q4 SHORT. CQI 30. Last Ann was Bull
CQI 71.22, 204 bars ago. Direction has flipped to SHORT
despite the green light and the bull announcement history
-- a meaningful disagreement between the light and the
quartile read.
IMP is scoring 0/5. NONE mode. WAIT.
RCZ at 5th percentile, ATR at 2nd. Vol Elev at 4th.
Everything is compressed after yesterday's push into the
752-756 cluster. The move happened, and now the market
has gone still.
Yesterday's resolution played out -- price reached 756.68,
just shy of the session High, then settled. The LONG
path from two mornings ago completed. The question now
is whether this compression resolves into a continuation
above the cluster or a retreat back into the base.
Tactical Cheat Sheet
Resistance: 756.68 -- yesterday's high
Hard resistance: 758.02-759.32 -- next structure above
Current price: 754.87
Support: 750.3-752.15 -- base of the move
Key support: 741.22-742 -- prior consolidation
Thesis line: 721.23
Continuation path:
Vol Elev climbs off 4th percentile with RCZ following,
IMP scores 1+ in PART mode, clears 756.68 cleanly
Target: 758-759
Retreat path (matching the Q4 SHORT direction):
Price fails to hold 752 with Vol Elev entering on a
down move, IMP loads EXT as ATR expands off 2nd
Target: 742 retest
What the Stack Is Watching
ACE's GREEN light against a Q4 SHORT quartile is the
detail worth tracking today. That kind of disagreement
between the surface signal and the underlying read often
resolves when volume returns. Right now there is none.
---
Built with SYNTHESIS v3.3 | SOM / ACE / IMP / SYNTHESIS
Study, not financial advice.
BlackRock’s Bitcoin ETF: When Should Investors Buy Again?As you know, the second half of 2026 is expected to mark the end of Bitcoin’s cyclical bear market. I recently published several analyses aimed at refining both the timing and the price range of the expected cyclical bottom for Bitcoin and ETH/USD.
You can revisit those analyses by clicking on the charts below.
Here is my analysis of ETH/USD:
And here is my analysis of the timing and price range for Bitcoin’s cyclical bottom:
In this new crypto analysis, I will focus on the world's largest Bitcoin ETF by assets under management: BlackRock’s Bitcoin ETF, ticker IBIT. The technical analysis of IBIT provides valuable insight into what the end of the cyclical bear market could look like.
Since IBIT’s initial listing in 2024, a fractal Elliott Wave structure has developed. Before examining the chart, it is useful to review the classic Elliott Wave pattern.
The infographic below illustrates the complete Elliott Wave structure, consisting of five bullish waves numbered 1 through 5, followed by three corrective waves labeled A, B, and C. BlackRock’s Bitcoin ETF is currently in the final corrective wave C, suggesting that the bear market could end during the second half of 2026.
As you can observe, BlackRock’s Bitcoin ETF has followed a textbook Elliott Wave structure with remarkable precision. Assuming that this pattern continues to guide market behavior, the final bear-market low could occur between $30 and $33 on IBIT.
Following that, a new long-term bullish cycle consisting of five upward waves could develop between 2027 and 2029.
The chart below shows the weekly Japanese candlesticks of BlackRock’s Bitcoin ETF (ticker: IBIT).
DISCLAIMER:
This content is intended for individuals who are familiar with financial markets and instruments and is for information purposes only. The presented idea (including market commentary, market data and observations) is not a work product of any research department of Swissquote or its affiliates. This material is intended to highlight market action and does not constitute investment, legal or tax advice. If you are a retail investor or lack experience in trading complex financial products, it is advisable to seek professional advice from licensed advisor before making any financial decisions.
This content is not intended to manipulate the market or encourage any specific financial behavior.
Swissquote makes no representation or warranty as to the quality, completeness, accuracy, comprehensiveness or non-infringement of such content. The views expressed are those of the consultant and are provided for educational purposes only. Any information provided relating to a product or market should not be construed as recommending an investment strategy or transaction. Past performance is not a guarantee of future results.
Swissquote and its employees and representatives shall in no event be held liable for any damages or losses arising directly or indirectly from decisions made on the basis of this content.
The use of any third-party brands or trademarks is for information only and does not imply endorsement by Swissquote, or that the trademark owner has authorised Swissquote to promote its products or services.
Swissquote is the marketing brand for the activities of Swissquote Bank Ltd (Switzerland) regulated by FINMA, Swissquote Capital Markets Limited regulated by CySEC (Cyprus), Swissquote Bank Europe SA (Luxembourg) regulated by the CSSF, Swissquote Ltd (UK) regulated by the FCA, Swissquote Financial Services (Malta) Ltd regulated by the Malta Financial Services Authority, Swissquote MEA Ltd. (UAE) regulated by the Dubai Financial Services Authority, Swissquote Pte Ltd (Singapore) regulated by the Monetary Authority of Singapore, Swissquote Asia Limited (Hong Kong) licensed by the Hong Kong Securities and Futures Commission (SFC) and Swissquote South Africa (Pty) Ltd supervised by the FSCA.
Products and services of Swissquote are only intended for those permitted to receive them under local law.
All investments carry a degree of risk. The risk of loss in trading or holding financial instruments can be substantial. The value of financial instruments, including but not limited to stocks, bonds, cryptocurrencies, and other assets, can fluctuate both upwards and downwards. There is a significant risk of financial loss when buying, selling, holding, staking, or investing in these instruments. SQBE makes no recommendations regarding any specific investment, transaction, or the use of any particular investment strategy.
CFDs are complex instruments and come with a high risk of losing money rapidly due to leverage. The vast majority of retail client accounts suffer capital losses when trading in CFDs. You should consider whether you understand how CFDs work and whether you can afford to take the high risk of losing your money.
Digital Assets are unregulated in most countries and consumer protection rules may not apply. As highly volatile speculative investments, Digital Assets are not suitable for investors without a high-risk tolerance. Make sure you understand each Digital Asset before you trade.
Cryptocurrencies are not considered legal tender in some jurisdictions and are subject to regulatory uncertainties.
The use of Internet-based systems can involve high risks, including, but not limited to, fraud, cyber-attacks, network and communication failures, as well as identity theft and phishing attacks related to crypto-assets.