Long
Long
 Long
Long
Weekly Bias — 20 JulyThe picture is more balanced when we take a step back from NASDAQ:QQQ alone, when we look at intermarket leadership, volatility, dispersion & breadth
Bullish (65%)
Short-term trend is corrective
This a correction rather than a new bear leg (~65–70%)
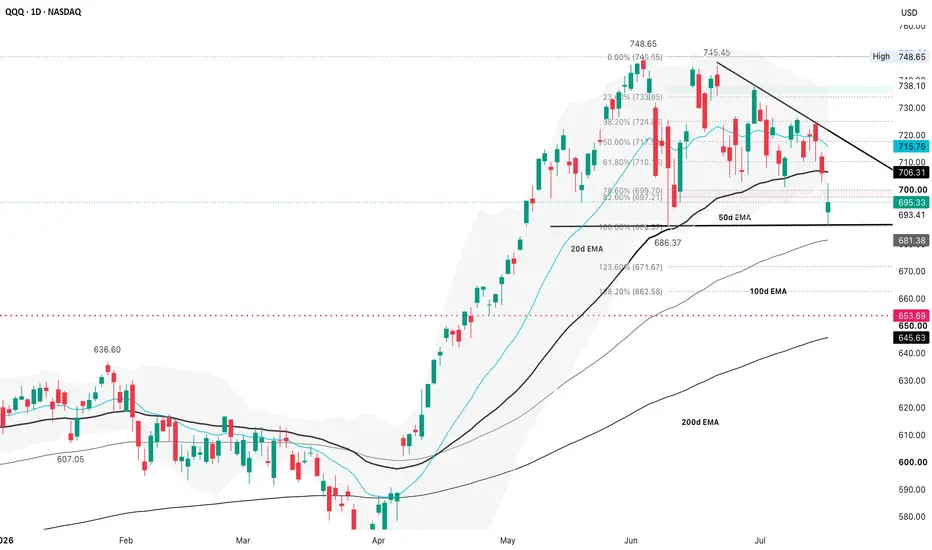
Deeper correction below NASDAQ:QQQ $686 (~30–35%)
Normally, if yields are falling while NASDAQ:QQQ is correcting, I'd expect the correction to become more technical/positioning-driven than macro-driven
VIX at 18.8 deserves respect, but not fear
Below the March spike
Still below the 20–22 level where corrections often accelerate
Front-month futures remain orderly
Volatility is elevated, but we're not seeing panic
COR1M has risen sharply over the last week
Means options traders increasingly expect stocks to move together rather than idiosyncratically
Usually associated with macro hedging, ETF hedging & index selling
It's a yellow flag, not necessarily a red one
DSPX is still trending higher
Higher dispersion means stock selection is still mattering
If dispersion were collapsing while correlation exploded, I'd worry much more about broad index liquidation
Instead, dispersion suggests there's still differentiation underneath the surface
VXN/VIX ratio remains elevated
The options market is demanding relatively more protection for NDX than for the SPX
NASDAQ:QQQ weakest, AMEX:SPY stronger & AMEX:IWM relatively resilient
It's another sign this is concentrated in growth rather than broad market panic
The NDX/NDXE ratio is rolling over
Mega-cap component of NDX has been underperforming the equal-weight version
This is healthy in one sense because it suggests leadership is broadening rather than narrowing
It's also one reason why AMEX:SPY & AMEX:IWM have been holding up better than NASDAQ:QQQ
The NDFI panel has weakened materially
One of the more bearish breadth signals since it tells me fewer stocks are participating in the rally
It's not a collapse, but it's another indication that internal momentum has cooled
NASDAQ:SMH is still outperforming NASDAQ:QQQ over the larger trend, although that leadership has moderated
As long as semis remain relatively strong, it's difficult to make a strong structural bear case for NDX
Software ( CBOE:IGV ) has been underperforming for months
NDX/SPX has been falling
Again, money rotating away from mega-cap growth
AMEX:SPY remains remarkably healthy
Even after Friday, well above major support around $738–$740
Doesn't look like an index beginning a major bear trend
AMEX:IWM continues to strengthen the "correction, not collapse" argument
It's holding $294–$295, above its major support near $290 rather than new relative lows
If institutions were aggressively de-risking, I'd expect AMEX:IWM to be underperforming
NASDAQ:QQQ remains the weakest
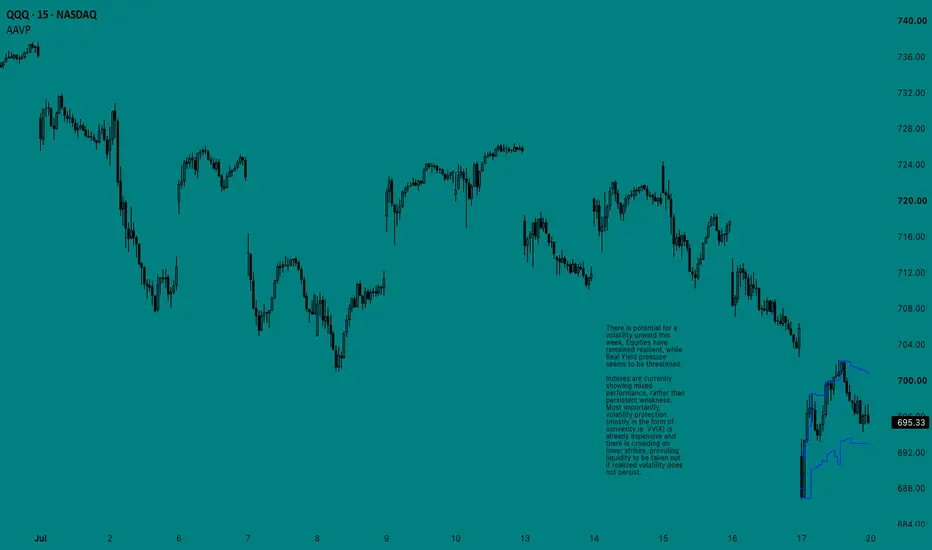
I still think Friday produced a legitimate sell-side liquidity sweep
However, the lack of a strong close back above $700 means it hasn't been validated as a successful bear trap
Intermarket analysis suggest IV is elevated & RV is likely to stay above average, but unless NASDAQ:QQQ loses $686, I still expect RV over the next several sessions to fall short of the extreme front-end premium that was priced before expiration
Bullish
NASDAQ:QQQ holds $693–$695
AMEX:SPY stays above $740
AMEX:IWM holds $293–$294
VIX fails to break 20
NASDAQ:QQQ reclaims $700, then $706
Would make Friday look increasingly like a successful liquidity sweep within a larger continuation pattern
Bearish
NASDAQ:QQQ closes below $693
AMEX:SPY loses $738
AMEX:IWM loses $290
VIX pushes above 20–21
COR1M continues to spike while breadth deteriorates further
Combination would materially increase the probability of a move toward $686 & if that level fails, the next technical support would likely be the 100d EMA near $665
NASDAQ:QQQ by itself looks cautious, but the intermarket evidence is notably less bearish
Falling yields are supportive
AMEX:SPY & AMEX:IWM continue to show relative resilience
Semis are still outperforming the broader market the larger trend
Volatility is elevated, but not exhibiting panic characteristics
The main concern is breadth, which has weakened & NDX leadership, which has narrowed
I believe the market is closer to the end of a correction rather than the beginning of a sustained bear trend given the broader evidence doesn't support a high-conviction bearish outlook, but the bulls need to prove it this week & reclaim $700–$706 on NASDAQ:QQQ Long 
Long 
SPY: What "No Accumulation" Actually Tells YouMost traders treat indicator silence as absence of information. On a structure tool, silence IS the information.
Structura Accumulate is showing NO ACCUMULATION on SPY's daily chart - the last signal fired 76 bars ago. Here's how to read that.
What the chart shows
Over the past three years, Accumulate marked three zones - each at a major structural low (late 2023, spring 2025, March 2026). Each zone appeared where price was rebuilding around the adaptive low-anchored reference after a meaningful decline. Between those zones: silence. Through entire rallies: silence.
Why the silence matters now
SPY is trading near highs. No new structural base is being built at these levels - and that's exactly what you'd expect. Accumulation is a bottoming behavior; it doesn't happen at the top of an advance. A tool that marked "accumulation" up here would be describing something that structurally doesn't exist.
So the current read is not bearish and not bullish. It's positional: the market is far from where bases are built. What happens next - continued expansion or the start of a new reset - will be visible in structure before it's obvious in price. When a meaningful decline eventually produces a new zone, that will be the signal worth attention. Until then, patience is the position.
The takeaway
A structure tool that stays quiet through a rally isn't broken - it's selective. Three signals in three years, each at a major low, is the point. If your tools give you signals every week, they're describing noise, not structure.
Structura Accumulate is free and public - the framework and full manual are linked in our profile. Education 
Long

QQQ / NDX Weekly Outlook – Week 29 of 2026 (13-17 JUL)QQQ / NDX WEEKLY MARKET OUTLOOK
Last Week's Recap
We only took one QQQ trade last week.
Tuesday's Tactical Playbook provided a clean long setup, allowing us to capture a profitable move in both QQQ and NQ futures. No additional QQQ trades were taken for the remainder of the week.
1 trade | 1 win
(For reference, I have included last week's outlook on the right.)
UA CAPITAL RECAP 12.07 | WEEK 06–10 JUL
Week 27 of 2026 marked our first breakeven week after an incredible run of 13 consecutive deep green weeks. That winning streak, which had lasted since early April, officially came to an end. I want to mention this with complete transparency. While the deep green streak is over, we still have not recorded a single red week year to date. Hopefully a new winning streak begins soon and continues to compound over the coming months.
Markets experienced a healthy pullback during the first half of the week before finding support at lower levels. Part of that weakness was driven by renewed geopolitical uncertainty after President Trump announced that peace negotiations with Iran had been suspended and military operations would continue. Those headlines created enough uncertainty to trigger profit taking across the indices.
On Tuesday, the levels published in the Daily SPY/SPX | QQQ/NDX Tactical Playbook once again worked with remarkable precision. SPY bounced almost exactly from our predefined area before rallying toward 750, while QQQ and NQ futures provided the cleaner execution. We established long exposure in both QQQ and Nasdaq futures, capturing another profitable trade by following the published plan.
On Wednesday, SPY tested the 740.5 level almost perfectly before closing back above it, allowing long positions to be established from the support zone. Partial profits were taken at 745 and again at 747 during Wednesday and Thursday, following the execution plan exactly as outlined.
Thursday brought a different opportunity. In the Daily SPY/SPX Tactical Playbook published that morning, I outlined a tactical short setup for SPY around the 750–752 supply zone while also identifying a potential bullish continuation scenario for QQQ.
The SPY short failed and was stopped out according to plan. However, the QQQ bullish scenario unfolded almost exactly as anticipated. Since we were already positioned on the SPY short, we decided not to participate in the QQQ long. Looking back, the analysis itself was accurate, but our execution favored the weaker setup. Had we followed the QQQ long instead, another profitable trade would have been available. Sometimes analysis is correct while execution becomes the deciding factor.
The Thursday report also highlighted the possibility of a breakout above 752. That breakout materialized on Friday exactly as anticipated.
Friday's rally was supported by renewed optimism surrounding geopolitical developments as headlines suggested that peace negotiations could resume. Despite the breakout, the UA CAPITAL Trading Desk decided not to participate because the move developed late on Friday afternoon, when option pinning and positioning distortions become much more likely. We preferred to finish the week flat rather than force a late entry.
Overall, the week reflected disciplined execution. Tuesday's Tactical Playbook generated profitable futures and QQQ trades, while the unsuccessful SPY short later in the week offset part of those gains. By respecting predefined stop losses and maintaining disciplined risk management, we finished the week essentially flat.
Although our 13 week deep green streak came to an end, our year to date record remains free of any losing weeks. That consistency is not simply the result of good market analysis. It is the product of disciplined risk management and strict position sizing.
Equities Play
This week we also began building several medium term spot positions together with the UA CAPITAL Trading Desk.
To maintain flexibility, total exposure was intentionally limited to approximately one quarter of our available buying power.
Over the coming weeks, we plan to continue accumulating positions at predefined technical levels with the intention of holding them into the November–December 2026 timeframe.
The individual names are shared exclusively inside the private Trading Desk, so I will not disclose them publicly. However, the portfolio remains concentrated primarily in technology and semiconductor companies.
This Week's Scenarios / Prediction
Risk Index
This oscillator reads macro conditions and converts them into a technical risk framework. It was developed internally at UA CAPITAL and remains the primary indicator I use for both short term and long term positioning decisions.
The Risk Index algorithm is currently signaling a short term neutral to slightly bullish environment. Additional upside remains possible over the near term, although the market continues to trade within a broader choppy structure.
The long term algorithm continues to signal a risk on environment, while the medium term outlook still leans slightly bearish.
When these conditions occur simultaneously, volatility typically increases as both buyers and sellers compete for control. Eventually, this type of environment often resolves through either a meaningful correction or a decisive breakout that establishes the next directional trend.
Our approach this week remains straightforward. We will continue looking for confirmed long opportunities from predefined Key Levels. At this stage, I believe short positions carry a less attractive risk to reward profile. Should that view change, I will communicate it through the daily Tactical Playbooks.
Scenarios / Strategies
Long Scenario 1
KEY Level 1 (715) This is the first major demand zone. If price reaches this level and confirms support, call options can be used to establish long exposure.
Trigger: Price must reach the level and produce a bullish 1 hour candle close back above the zone.
Targets: 720 → 725 → 729.5
Invalidation: Daily close below 710.
Long Scenario 2
Put Wall (700) This is the largest negative GEX level. If price reaches this level and confirms support, call options can be used to establish long exposure.
Trigger: Price must reach the level and produce a bullish daily close back above the zone.
Targets: 710 → 715 → 720
Invalidation: Daily close below 700.
Long Scenario 3
KEY Level 2 (692) This is the second major demand zone. If price reaches this level and confirms support, call options can be used to establish long exposure.
Trigger: Price must reach the level and produce a bullish daily close back above the zone.
Targets: 700 → 705 → 710 → 715
Invalidation: Daily close below 681.
Position Management Rules
1. Entry model: Aggressive: 1 hour candle close above/below the designated level. Conservative: Daily candle close above/below the designated level.
2. Take profits in stages because market reversals can happen quickly.
3. After the first profit target is reached, move all remaining stop losses to breakeven and convert the position into a risk free trade.
4. A reaction from the level must be confirmed. We do not predict price. We react to price.
5. Daily candle close below the designated bounce zone equals stop loss.
Notice: Starting a fresh, fully transparent track record for SPY, QQQ, and core equities here on TradingView. Going forward, all daily market updates, institutional research, weekly outlooks, and mid week market updates will be documented and tracked consistently.
This analysis is for educational purposes only and reflects my personal opinion. It is not financial advice. SPY / SPX Weekly Outlook – Week 28 of 2026 (13-17 JUL)SPY / SPX WEEKLY MARKET OUTLOOK
Last Week's Recap
We took two SPY trades last week.
The first trade came from Tuesday's Tactical Playbook after price broke out of the Chop Zone and delivered a clean long setup.
Later in the week, we attempted a tactical short from the 750–752 supply zone. The setup failed to follow through and was stopped out as planned.
2 trades | 1 win | 1 loss
(For reference, I have included last week's outlook on the right.)
UA CAPITAL RECAP 12.07 | WEEK 06–10 JUL
Week 27 of 2026 marked our first breakeven week after an incredible run of 13 consecutive deep green weeks. That winning streak, which had lasted since early April, officially came to an end. I want to mention this with complete transparency. While the deep green streak is over, we still have not recorded a single red week year to date. Hopefully a new winning streak begins soon and continues to compound over the coming months.
Markets experienced a healthy pullback during the first half of the week before finding support at lower levels. Part of that weakness was driven by renewed geopolitical uncertainty after President Trump announced that peace negotiations with Iran had been suspended and military operations would continue. Those headlines created enough uncertainty to trigger profit taking across the indices.
On Tuesday, the levels published in the Daily SPY/SPX | QQQ/NDX Tactical Playbook once again worked with remarkable precision. SPY bounced almost exactly from our predefined area before rallying toward 750. During that move, we established long exposure through ES futures and captured a solid profit.
On Wednesday, SPY tested the 740.5 level almost perfectly before closing back above it. That confirmation allowed us to re enter on the long side around 741.5. We scaled out at both 745 and 747 during Wednesday and Thursday, following the plan exactly as published.
Thursday brought a different opportunity. In the Daily SPY/SPX Tactical Playbook published that morning, I outlined a new tactical strategy for Thursday and Friday. Based on that framework, we initiated short exposure in SPY around the 750–752 supply zone while simultaneously shorting several individual equities.
This trade did not develop as expected and was stopped out according to plan. Although the SPY short failed, the bullish continuation scenario published for QQQ unfolded almost perfectly. In hindsight, the analysis itself was accurate, but our execution favored the weaker setup. Had we followed the QQQ long instead of the SPY short, the trade would have produced another profitable outcome. Sometimes the analysis is correct while execution becomes the deciding factor.
The Thursday report also highlighted the possibility of a breakout above 752. That breakout materialized on Friday exactly as anticipated.
Friday's rally was supported by renewed optimism surrounding geopolitical developments as headlines suggested that peace negotiations could resume. Despite the breakout, the UA CAPITAL Trading Desk decided not to participate because the move developed late on Friday afternoon, when option pinning and positioning distortions become much more likely. We preferred to finish the week flat rather than force a late entry.
Overall, the week reflected disciplined execution. Tuesday's Tactical Playbook generated profitable futures trades, while Wednesday and Thursday's long positions produced additional gains. Those profits were offset by Thursday's unsuccessful short positions across both the indices and several equities. By staying disciplined with our risk management, the week finished essentially flat.
Although our 13 week deep green streak came to an end, our year to date record remains free of any losing weeks. That consistency is not simply the result of good market analysis. It is the product of disciplined risk management and strict position sizing.
Equities Play
This week we also began building several medium term spot positions together with the UA CAPITAL Trading Desk.
To maintain flexibility, total exposure was intentionally limited to approximately one quarter of our available buying power.
Over the coming weeks, we plan to continue accumulating positions at predefined technical levels with the intention of holding them into the November–December 2026 timeframe.
The individual names are shared exclusively inside the private Trading Desk, so I will not disclose them publicly. However, the portfolio remains concentrated primarily in technology and semiconductor companies.
This Week's Scenarios / Prediction
Risk Index
This oscillator reads macro conditions and converts them into a technical risk framework. It was developed internally at UA CAPITAL and remains the primary indicator I use for both short term and long term positioning decisions.
The Risk Index algorithm is currently signaling a short term neutral to slightly bullish environment. Additional upside remains possible over the near term, although the market continues to trade within a broader choppy structure.
The long term algorithm continues to signal a risk on environment, while the medium term outlook still leans slightly bearish.
When these conditions occur simultaneously, volatility typically increases as both buyers and sellers compete for control. Eventually, this type of environment often resolves through either a meaningful correction or a decisive breakout that establishes the next directional trend.
Our approach this week remains straightforward. We will continue looking for confirmed long opportunities from predefined Key Levels. At this stage, I believe short positions carry a less attractive risk to reward profile. Should that view change, I will communicate it through the daily Tactical Playbooks.
Scenarios / Strategies
Long Scenario 1
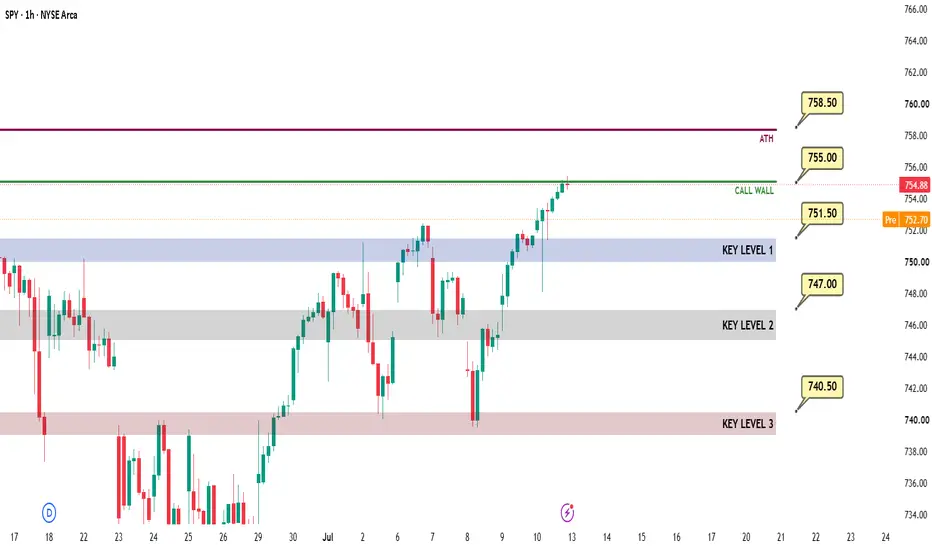
KEY Level 1 (751.5)
This is the first major demand zone. If price reaches this level and confirms support, call options can be used to establish long exposure.
Trigger: Price must reach the level and produce a bullish 1 hour candle close back above the zone.
Targets:754.5 → 758 → 760
Invalidation: Daily close below 748.
Long Scenario 2
KEY Level 2 (747)
This is the second major demand zone. If price reaches this level and confirms support, call options can be used to establish long exposure.
Trigger: Price must reach the level and produce a bullish daily close back above the zone.
Targets: 750 → 751.5 → 754.5
Invalidation: Daily close below 745.
Long Scenario 3
KEY Level 3 (740.5) This is the third major demand zone. If price reaches this level and confirms support, call options can be used to establish long exposure.
Trigger: Price must reach the level and produce a bullish daily close back above the zone.
Targets: 742.5 → 745 → 747
Invalidation: Daily close below 739
Position Management Rules
1. Entry model: Aggressive: 1 hour candle close above/below the designated level. Conservative: Daily candle close above/below the designated level.
2. Take profits in stages because market reversals can happen quickly.
3. After the first profit target is reached, move all remaining stop losses to breakeven and convert the position into a risk free trade.
4. A reaction from the level must be confirmed. We do not predict price. We react to price.
5. Daily candle close below the designated bounce zone equals stop loss.
Notice: Starting a fresh, fully transparent track record for SPY, QQQ, and core equities here on TradingView. Going forward, all daily market updates, institutional research, weekly outlooks, and mid week market updates will be documented and tracked consistently.
This analysis is for educational purposes only and reflects my personal opinion. It is not financial advice.
Daily SPY/SPX Tactical Playbook - 17 JULDaily SPY/SPX Tactical Playbook
Market Technical Look
Markets are once again under pressure, led by weakness across high beta technology names following the sharp selloff in the KOSPI, which dropped more than 6%.
At the same time, Japan's 10-Year Government Bond yield has reached record highs while U.S. 10-Year Treasury yields continue to trend higher, creating a challenging macro backdrop for risk assets.
The combination of tightening global liquidity and a strengthening U.S. Dollar Index (DXY) continues to pressure equities and supports the current corrective phase.
From a structural perspective, the long and medium term trend remains risk on. However, the short term macro environment has clearly shifted toward risk off.
As a result, sharp downside moves and elevated volatility should be considered part of the expected market environment.
Risk Index
This oscillator reads macro conditions and converts them into a technical risk framework. It was developed internally at UA CAPITAL and remains the primary indicator I use for both short term and long term positioning decisions.
The Risk Index continues to signal a risk on environment over the long and medium term.
However, the short term model remains firmly risk off.
This combination often produces highly volatile price action, including sharp selloffs followed by aggressive V shaped recoveries.
SPY Daily Strategy / Outlook
Scenarios / Strategies
Long Scenario 1
KEY Level 1 (748) This is the primary swing support area. If price reclaims the level with a confirmed one-hour bullish candle close, long positions can be considered.
Trigger: Price must test the level and produce a 1-hour bullish candle close back above 748.
Targets: Take partial profits for every $1 move higher.
Invalidation: 1-hour candle close below 746.
Long Scenario 2
KEY Level 2 (740) This is the next major demand zone. If price reaches this level and confirms support, call options can be used to establish long exposure.
Trigger: Price must reach the level and produce a bullish daily close back above the zone.
Targets: Take partial profits for every $1 move higher.
Invalidation: 4-hour candle close below 738.
Short Scenario
KEY Level 1 (746) If price retests this level from below and confirms rejection with a strong one-hour bearish candle close, short exposure can be considered.
Trigger: Price must reject 746 and produce a strong 1-hour bearish candle close below the level.
Targets: Take partial profits for every $1 move lower.
Invalidation: 1-hour candle close above 754.
Position Management Rules
1. Entry model: One-hour candle close above/below the designated level.
2. Take profits in stages because market reversals can happen quickly.
3. After the first profit target is reached, move all remaining stop losses to breakeven and convert the trade into a risk free position.
4. A reaction from the level must be confirmed. We do not predict price. We react to price.
5. Each scenario has its own invalidation level. Read them carefully before entering a position.
6. All charts use RTH (Regular Trading Hours). Using ETH may produce inaccurate candle confirmations.
Notice: Starting a fresh, fully transparent track record for SPY, QQQ, and core equities here on TradingView. Going forward, all daily market updates, institutional research, weekly outlooks, and mid week market updates will be documented and tracked consistently.
This analysis is for educational purposes only and reflects my personal opinion. It is not financial advice. Daily SPY/SPX | QQQ/NDX Tactical Playbook - 15 JULDaily SPY/SPX | QQQ/NDX Tactical Playbook
Market Sentiment
Following yesterday’s softer than expected CPI and PPI reports, the probability of a rate hike at the July FOMC meeting has fallen to roughly 10%, providing a meaningful tailwind for equities.
In addition to the encouraging inflation data, the KOSPI Index rallied nearly 6%, suggesting that immediate concerns surrounding a potential global liquidity crisis have eased for now.
That said, several structural macro risks remain unresolved. Treasury yields, particularly the US 10-Year and Japanese 10-Year government bond yields, continue to trade near historically elevated levels. These remain important risk factors that could quickly shift market sentiment if conditions deteriorate.
While the short term backdrop has improved, downside risks should not be ignored.
Risk Index
This oscillator reads macro conditions and converts them into a technical risk framework. It was developed internally at UA CAPITAL and remains the primary indicator I use for both short term and long term positioning decisions.
The Risk Index shifted back to slightly bullish following the CPI and PPI releases.
The long term outlook remains firmly Risk On, while the short term outlook has improved enough to support a potential move toward new all time highs.
However, the signal remains relatively weak. Although bullish momentum has strengthened, downside volatility remains a realistic possibility should market conditions deteriorate or new macro catalysts emerge.
Scenarios / Strategies
Long Scenario 1
KEY Level 1 (752.5)
This is the first major demand zone. If price reaches this level and confirms support, it may provide an opportunity to establish long exposure using call options.
Trigger: Price must test 752.5 and produce a bullish 1 hour candle close back above the level.
Targets:754.5 → 758 → 760
Invalidation:4 hour candle close below 751.5.
Long Scenario 2
KEY Level 2 (748.25)
This is the second major demand zone. If price reaches this level and confirms support, it may provide another opportunity to establish long exposure using call options.
Trigger: Price must test 748.25 and produce a bullish daily candle close back above the level.
Targets: 750 → 751.5 → 754.5
Invalidation: Daily close below 747.
Breakout Scenario
Swing Area (755)
If price breaks decisively above 755 and produces a strong 1 hour bullish candle close, a breakout continuation trade can be considered after a successful retest of the breakout level.
Trigger: A strong 1 hour bullish candle close above 755, followed by a successful retest.
Targets: 756 → 758 → 760
Invalidation: 1 hour candle close below 754.
Position Management Rules
1-Entry Model: Use an aggressive entry only after a confirmed 1 hour candle close above or below the designated trigger level.
2-Scale Out Gradually: Take profits in stages, as market reversals can happen quickly, especially in volatile conditions.
3-Protect Capital: Once the first target is reached, move the remaining position’s stop loss to break even, converting the trade into a risk free position.
4-React, Don’t Predict: Every setup requires confirmation. We do not anticipate price movements we react to confirmed price action.
5-Read Every Scenario Carefully: Each scenario has its own unique trigger and invalidation level. Make sure you follow the rules specific to the setup you’re trading.
Notice: Starting a fresh, fully transparent track record for SPY, QQQ, and core equities here on TradingView. Going forward, all daily market updates, institutional research, weekly outlooks, and mid week market updates will be documented and tracked consistently.
This analysis is for educational purposes only and reflects my personal opinion. It is not financial advice. Long
 Long
Long
Long 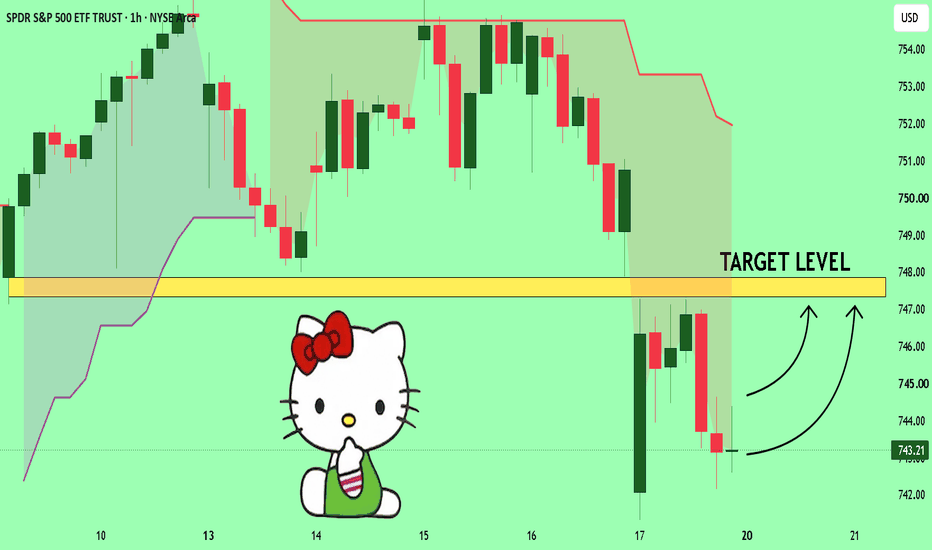
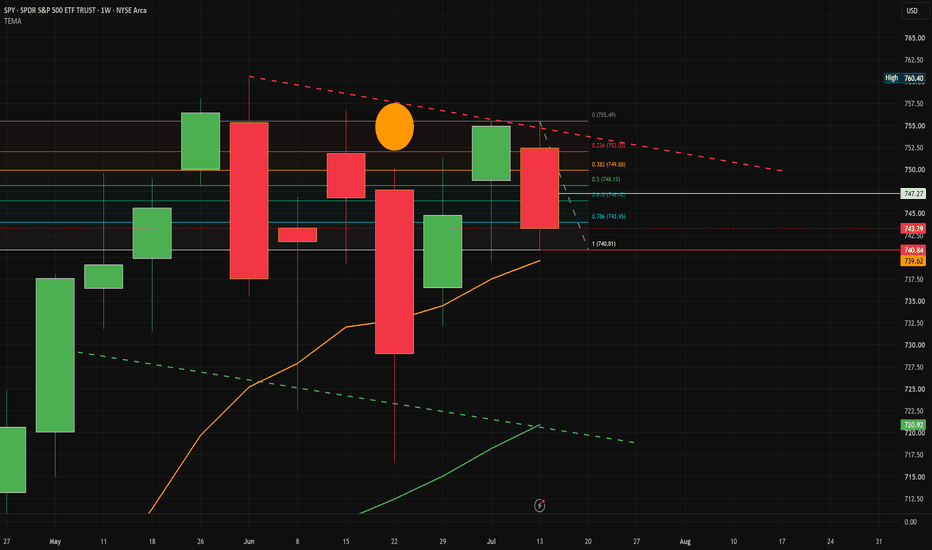
SPY Options Trades Week of July 20SPY is trading right under a major decision zone after gapping down chopping around the 743.20 intraday level. The chart is still coiling between the 740.00 key daily level and the gap breakdown area, with the 760.40 ATH area sitting much higher as the next major upside target if the gap is reclaimed.
I've mapped out three scenarios for the coming sessions:
🟢 Bullish Scenario
If SPY can cleanly reclaim the gap and hold above it, that opens the door for a push back toward 754.00 A confirmed move above would put ATH continuation on the table, but that likely needs strong follow-through and isn’t the base case yet.
🔴 Bearish Scenario
If the 743.20 area loses and price starts failing beneath 740.00, the move lower can accelerate fast toward 736.00 and then 731.00. Note, the bearish move could initially look like a gap fill and continuation, but if buyers don’t step in quickly, the tape can dump back down quickly
🟡 Sideways Scenario (My Lean)
SPY stays trapped between 740.00 and the gap area while market participants wait for direction, with 744 acting as the midpoint magnet. This is the scenario is till very much game for good trades as the chop box could be 8-9 delta or bigger giving us ample opportunity
My Outlook
If I had to rank the probabilities today:
🟡 Sideways (my current lean)
🔴 Bearish
🟢 Bullish breakout
A reclaim of the gap with significant push from chip stocks would force me to respect more upside, while a clean break below 740.00 would shift the bias toward downside continuation. Until then, the chop range is still the most likely path.
As always, the Heavy Diligence Options Signals Indicator will be my primary tool for entries and exits. While these scenarios provide the broader roadmap, the indicator is designed primarily for day trading on shorter timeframes, helping identify higher-probability Call and Put opportunities. Combining those signals with key technical levels helps improve risk management instead of simply guessing the next move.
A side note on the indicator if you prefer the old V1.2 turn off the confirmation layer. If you want to learn more follow on X there is a lot covered on there
Disclaimer: This is only my interpretation of the current chart and is not financial advice. Always do your own research, wait for confirmation, and manage your risk before entering any trade. Long