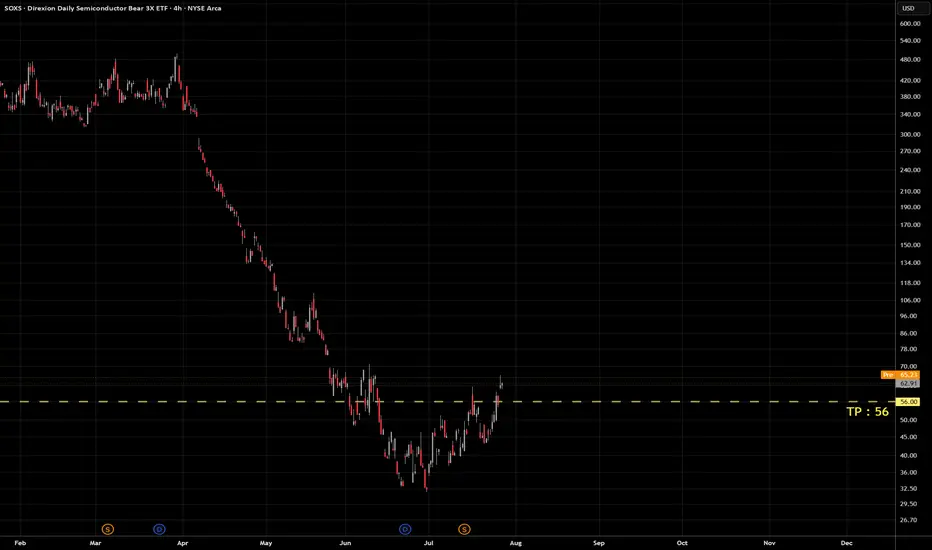
Scapegoats, Leverage & Block Trades: What’s Driving the BounceWe mentioned that we were set up perfectly for a technical bounce, here it is!!!
Today’s rip looks much more like the air coming out of a crowded short trade than fresh fundamental accumulation.
Once the short covering mechanism exhausts itself over the next session or two, we’ll see if real buy & hold institutional bids step in to build a structural floor.
Real institutional long only money rarely buys aggressively on 1st day of an unwind.
ATM, discretionary long cap is CHILLING, letting shorts burn each other out, waiting for earnings print cycle & guidance .
For?
Well, they want to know if hardware CapEx estimates get slashed across the board!
Just an addition:
The Scapegoat! Leopold!
$24B AUM headlines can be misleading: actual cash equity vs prime broker leverage. When Situational Awareness LP’s longs dropped & software shorts rallied, leverage exploded. Liquidating the public book in one block trade solved yesterday’s margin call.
$225M to multibillion growth was legit early outperformance! However, scaling to $24B peak AUM was heavily fueled by prime broker leverage & derivatives.
Likely either; Goldman, Morgan, Credit Suisse, or a combination, who helped them sell the book, propped him. (This is just me thinking out loud)
Reminds me of Bill Hwang and Cathie Wood...  Short
Short
TQQQ: Price Is Approaching the ReferenceStructura Accumulate has been silent on TQQQ for 90 bars. In that stretch price roughly doubled from the low $40s to near $88, then gave back about 34% from that high. The reference line the tool draws now sits at 51.52, roughly 11% below the last close of 57.75 - and the chart has that unmistakable look: price heading toward a line that marked two lows before.
This Idea is about why that look is a trap, and what the honest read of this chart is today.
What the chart shows
Two zones since April 2025, eleven months apart. The first in April 2025, in the low $20s, where price was rebuilding around the adaptive low-anchored reference after a hard reset. The second in late March 2026, in the low $40s - that zone is the "last signal 90 bars ago" on the table. Between them, and after the second one, silence. Through the entire advance to $88: nothing.
That silence is not the tool failing to keep up. Accumulation is rebuilding behavior. It appears where a base is being built, not where a trend is extending, and a tool that found "accumulation" somewhere in the middle of that advance would have been describing noise.
Now the current bar, stated without flattering anything: it opened at 61.51, traded as high as 62.74, and closed at 57.75 - sixteen cents off its low. A wide-range day that closed on the floor. Relative volume reads MEDIUM: no capitulation spike, no quiet drift. The table says NO ACCUMULATION. So the tool sees a decline, and it does not yet see rebuilding.
"Approaching the line" is not a state
This is the point of the post, so it gets stated flatly.
The visible line is an adaptive low-anchored reference. It is not support. It is not a target. It is not an alert level. It is the anchor against which behavior is evaluated - and a zone prints when behavior around that anchor qualifies as rebuilding, not when price makes contact with it.
Two consequences that most readers have backwards:
Price can trade straight through the line and print nothing. Distance to the line is arithmetic. A zone is a behavioral read.
Price can print a zone without a clean touch, or from underneath. On TSLA a few days ago, the first test of a fresh zone opened with the close below the reference. Contact is not the mechanism.
So "price is 11% from the line" is a true sentence about distance and an empty sentence about structure. There is no half-signal here, no warming up, no approach. Either a zone prints or it does not.
The two-for-two problem
Both prior zones on this chart were followed by strong advances. That is the most seductive and least useful sample size in markets, and it deserves to be handled out loud rather than left to imply itself.
The honest accounting: two observations do not make a base rate. Both formed after deep resets inside the same broad regime, so they are not even independent tests of the same idea. And in both cases the zone identified a structural condition - price rebuilding around a long-anchored reference after a decline - while the magnitude of what followed belonged to the market, not to the tool. Zones can fail. A third zone, if one prints, inherits nothing from the first two except the mechanism that produced them.
If two past outcomes make you more confident about the next one rather than more careful, a structure lens has quietly turned into a story. We would rather name that than let the chart do the implying.
A leverage note, and it matters here
TQQQ is a 3x daily-reset instrument on the Nasdaq 100. Its structure is a leveraged, path-dependent rendering of another chart's structure, and that changes how every number above should be read.
The 11% gap between price and the reference corresponds to roughly a third of that move in the underlying index, before any compounding effects. The 34% drawdown from the June high is a far more ordinary decline upstairs. And because the instrument rebalances daily, a choppier path to the same index level leaves price somewhere else entirely - so this reference sits where this instrument's own history put it, not where the index's structure would put it.
Two implications. A zone on this chart is a statement about this chart's positioning behavior - not a view on the Nasdaq 100, and not a recommendation on either. And whatever a test of a zone eventually looks like here, it will be roughly three times louder than the same test upstairs, in both directions.
The observation protocol - in order
With no zone on the chart, the acceptance/rejection protocol does not apply yet. It cannot be run on a signal that does not exist. What applies is the step before it:
First question: does a zone print at all? Continued silence through further decline is information, not a delay. It would mean the tool does not see rebuilding behavior, however attractive the level looks on a screen.
If a zone prints, then and only then: acceptance - price stabilizes around the zone, reclaims the reference, structure holds. Or rejection - price fails through and moves away, and the rebuilding attempt is over. Weeks, not bars. On a 3x instrument, weeks that will feel considerably longer.
What not to do: treat 51.52 as an alert level and act on contact. That converts a behavioral tool into a horizontal line, which is exactly the thing it exists to replace. Review this chart when the tool speaks, not when price gets near a number.
The takeaway
Two zones since April 2025, then 90 bars of nothing while this chart completed a full round trip. Right now the tool is quiet through a 34% decline. That is not a malfunction - it is a structure tool declining to call a base before there is one.
The disciplined version of this chart fits in one sentence: no accumulation, reference at 51.52, decline in progress. Everything past that sentence is opinion, ours included. Wait for the tool to speak, then let the market answer.
Structura Accumulate is free and public - full framework in our profile.  Long
Long
Research 30.07.2026🌏 Markets:
AMEX:SPY +5.14 +0.70%(pre/m)
NASDAQ:QQQ +9.50 +1.44%(pre/m)
🆕 Economic News:
08:30 USA – Core PCE Price Index
08:30 USA – GDP Growth Rate / GDP Price Index
08:30 USA – Personal Income / Spending
08:30 USA – Initial Jobless Claims
📈 Gap Ups
Reaction to earnings/guidance:
NASDAQ:MSFT NASDAQ:ARM NASDAQ:CORT NASDAQ:FORM NYSE:EPR NYSE:TAL NYSE:PWR NASDAQ:SIMO NYSE:BAX NYSE:HII NASDAQ:FTNT NYSE:AVY NYSE:WCC NASDAQ:AMRX NYSE:GKOS NYSE:BDC NASDAQ:LRCX NASDAQ:ARXS NASDAQ:SFM $GFLX NASDAQ:SBUX NYSE:CMG BME:BBVA NYSE:ING NASDAQ:EQIX NYSE:TT NYSE:ASX NASDAQ:REGN NYSE:LYG NYSE:SHEL NYSE:PSA MIL:RACE NYSE:KGC NYSE:BMY NYSE:UMC NYSE:AEM NASDAQ:CHRW NYSE:EPD NASDAQ:HOOD
Other news:
NASDAQ:DFNS continue to surge. The rally is driven by a recent 1-for-125 reverse stock split that drastically reduced the tradable float, creating a highly volatile market environment. This technical squeeze is further supported by recent corporate developments, including new defense contracts and the acquisition of a 60% stake in an Israeli drone technology firm.
NASDAQ:IBRX : UAE Grants Anktiva Broadest Approval
NASDAQ:NBIS publishes 2025 Sustainability Report, outlining blueprint for scaling responsibly
NASDAQ:SPCX wants to buy spectrum at auction and begin competing with mobile operators — Semafor.
NYSE:LMT won a $59 billion deal to produce Patriot missiles.
NASDAQ:NUWE Expands Pediatric Footprint with First Aquadex SmartFlow Installations in Wisconsin
📉 Gap Downs
Reaction to earnings/guidance:
NASDAQ:META NASDAQ:QCOM NASDAQ:TENB NYSE:RTO NASDAQ:CROX NASDAQ:FTAI NYSE:CVNA NASDAQ:LKQ NASDAQ:SIRI NYSE:PFSI NYSE:NCLH NASDAQ:WWD NYSE:LHX NYSE:STLA NYSE:SI NYSE:MO NASDAQ:TW NYSE:BUD NYSE:VLO NYSE:FTI NASDAQ:ORLY NYSE:BTI NYSE:ICE NYSE:MA $H
Other news:
FDA Advisory Panel Votes Against Capricor NASDAQ:CAPR Therapy / NASDAQ:CAPR faces 4 downgrades in a row
‼️ Additional
FOMC: FED FUNDS RATE = 3.75% (EXPECTED 3.75% / PRIOR 3.75%).
-- Fed: Inflation is elevated due to external shocks.
Warsh:
-- The economy is showing impressive resilience.
-- The Fed remains fully committed to ensuring price stability.
-- The FOMC is refraining from making forecasts.
-- Inflation cannot be “cured” in nine weeks.
-- The Fed will not waver and will act without hesitation.
-- Nominal and real Treasury yields are significantly above desired levels.
-- If inflation remains elevated, interest rates may become part of the solution.
-- Rates are higher today than they were 42 days ago.
-- The team will review a new set of inflation data ahead of the next meeting.
🏢 IPO
NYSE:JMKE – Jersey Mike’s Subs Inc.
Company operates and franchises Jersey Mike’s sandwich shops, with about 3,300 U.S. locations mostly run by independent franchisees. Revenue mainly comes from royalties and advertising fees, making it a franchise-heavy restaurant model rather than a company-owned store model. Core thesis is brand scale in the U.S., strong franchise economics and early international expansion into Canada, the U.K. and Ireland.
Price: $23.00
Shares: 43.5M
Raised: $1.0B
Market Cap: ~$7.31B
LTM:
Revenue: $724.0M
Net Income: $55.0M
Comparable public companies: NYSE:CMG , NYSE:CAVA , NYSE:YUM , NASDAQ:WING , NYSE:QSR , NYSE:DRI
NYSE:REF – Reformation Inc.
Company sells sustainable womenswear, apparel and accessories through DTC online channels and 70 stores across the U.S., Canada and Europe. Reformation is positioned as a premium lifestyle fashion brand with strong customer loyalty, high returning-customer revenue and fast product iteration. Core thesis is DTC fashion growth, sustainability positioning, international expansion and strong full-price selling.
Price: $15.00
Shares: 14.1M
Raised: $210.9M
Market Cap: ~$886.1M
LTM:
Revenue: $533.3M
Net Income: -$5.1M
Key point:
Net revenue grew at a 34% CAGR from 2015 to 2025, and Q1 2026 revenue grew 30% YoY.
Comparable public companies: NASDAQ:LULU , NYSE:ANF , NASDAQ:URBN , GETTEX:GPS , NASDAQ:BIRD , NYSE:TPR
📋 List of tickers involved:
NASDAQ:MSFT NASDAQ:ARM NASDAQ:CORT NASDAQ:FORM NYSE:EPR NYSE:TAL NYSE:PWR NASDAQ:SIMO NYSE:BAX NYSE:HII NASDAQ:FTNT NYSE:AVY NYSE:WCC NASDAQ:AMRX NYSE:GKOS NYSE:BDC NASDAQ:LRCX NASDAQ:ARXS NASDAQ:SFM $GFLX NASDAQ:SBUX NYSE:CMG BME:BBVA NYSE:ING NASDAQ:EQIX NYSE:TT NYSE:ASX NASDAQ:REGN NYSE:LYG NYSE:SHEL NYSE:PSA MIL:RACE NYSE:KGC NYSE:BMY NYSE:UMC NYSE:AEM NASDAQ:CHRW NYSE:EPD NASDAQ:HOOD NASDAQ:IBRX NASDAQ:NBIS NASDAQ:SPCX NYSE:LMT NASDAQ:NUWE NASDAQ:META NASDAQ:QCOM NASDAQ:TENB NYSE:RTO NASDAQ:CROX NASDAQ:FTAI NYSE:CVNA NASDAQ:LKQ NASDAQ:SIRI NYSE:PFSI NYSE:NCLH NASDAQ:WWD NYSE:LHX NYSE:STLA NYSE:SI NYSE:MO NASDAQ:TW NYSE:BUD NYSE:VLO NYSE:FTI NASDAQ:ORLY NYSE:BTI NYSE:ICE NYSE:MA $H NASDAQ:CAPR NYSE:JMKE NYSE:CAVA NYSE:YUM NASDAQ:WING NYSE:QSR NYSE:DRI NYSE:REF NASDAQ:LULU NYSE:ANF NASDAQ:URBN GETTEX:GPS NASDAQ:BIRD NYSE:TPR
Best regards – hi2morrow team.
Long 
SPY: Bears May Be Walking Into a TrapSPY is pulling back, but bears may be celebrating too early. Beneath the weakness, the broader structure still looks constructive. This may be a reset before another push higher, and the market could be leaving an unfinished move back toward value.
The Adaptive Market Profile is the structural anchor. It detects the dominant trend regime and maps where the strongest volume acceptance developed inside that structure. The rising blue lines are therefore not arbitrary targets. They mark the high-volume path where buyers and sellers previously agreed on value. SPY is trading below that path, but it remains inside the broader rising channel. That keeps a mean-reversion move toward those levels credible.
The Ehlers Adaptive RSI adds momentum context. Unlike a fixed-period RSI, it adapts its lookback to the market’s changing cycle. On the daily chart, momentum has cooled from an elevated zone toward neutral. The market is no longer overheated, leaving room for a fresh bullish impulse if buyers return.
RISK FILTER: FEAR OR REGIME CHANGE?
The VIX is a risk filter, not a buy signal by itself. The enlarged view below separates ordinary fear from a genuine volatility regime change. VIX has rebounded toward 20, but it remains far below the panic expansion seen in April 2025. What matters now is acceleration. Rejection from the recent swing area would support bullish mean reversion in SPY, while a sustained breakout would warn that this pullback is becoming structural.
TIMING TRIGGER: DO NOT FRONT-RUN MOMENTUM
The four-hour chart isolates execution. The Ehlers Adaptive RSI is now below its neutral 50 line, so the bullish thesis is not yet an entry signal. Because the oscillator adapts to the active market cycle, a reclaim of 50 is more meaningful here than a rigid fixed-period oversold reading. The cleaner trigger would be RSI moving back above 50 while SPY stops printing lower short-term lows. Until then, the profile gives us a destination, not permission to chase.
WHAT WOULD CONFIRM THE BULLISH CASE?
The sequence matters. VIX fails to accelerate, SPY stops making lower short-term lows, and the four-hour Adaptive RSI reclaims 50. If those pieces align while price remains inside the adaptive rising channel, the blue high-volume path becomes the logical mean-reversion objective.
The invalidation is equally clear. A decisive daily break below the rising channel, especially alongside sustained VIX expansion, would turn a healthy reset into a deeper structural problem.
The pullback is obvious. The unfinished return toward value may be what the market is underestimating.
Healthy reset, or the beginning of a real breakdown?  Long
Long
 Short
Short
S&P 500: The Bearish Scenario Is Becoming More LikelyThe technical picture on the S&P 500 is becoming increasingly bearish.
The index has now moved below both the 18-period and 50-period moving averages, suggesting that downside momentum is strengthening. Unless buyers quickly reclaim these levels, I expect the correction to continue.
The recent Fed meeting appears to have been the key catalyst. Despite what could have been interpreted as relatively supportive news, the market failed to produce the strong bullish follow-through that many participants were expecting. In my view, that is a warning sign.
This is also consistent with what I'm currently seeing across the metals market, where I continue to favor short setups, particularly in palladium. Weakness across several asset classes reinforces the idea that risk sentiment may continue to deteriorate.
That said, I'm managing risk carefully.
If the market fails to accelerate lower over the next couple of sessions, I will likely reduce or fully close my short positions before the weekend. I generally prefer not to carry shorts through weekends because of gap risk and unexpected news flow.
For now, however, my base case remains unchanged.
The bears appear to be gaining control, and I continue to favor the downside until the market proves otherwise.
Short 
 Long
Long
Long 
Long 
Long 

 Long
Long
QQQ 1H Analysis Diamond Top BreakdownQQQ 1H Diamond Top Breakdown Signals a Shift in Market Structure
QQQ has completed a textbook Diamond Top reversal on the 1-hour timeframe, confirming a bearish shift in short-term market structure after an extended rally. The pattern developed through expanding and contracting price swings before breaking decisively below its lower boundary a classic sign that buying momentum has weakened and sellers have taken control.
The breakdown has been accompanied by strong downside momentum, with consecutive bearish candles and limited buying interest. More importantly, the market is now printing lower highs and lower lows, confirming that the trend has transitioned from bullish to bearish in the near term.
The former support zone within the diamond, around 705–712, has now become a key resistance area. Unless price can reclaim this region, rallies are likely to face selling pressure.
On the downside, 640 stands out as the most important support level. This area aligns with a previous breakout zone and represents the first major level where buyers may attempt to defend the broader uptrend. A successful hold could trigger a relief bounce, while a decisive break below it would increase the probability of a deeper correction towards 625–610.
Scenarios
🟥 Bearish Continuation (65%)
The most likely outcome is a continued decline towards the 640 support zone, where buyers may begin to step in.
🟨 Relief Rally (25%)
Following the recent sharp sell-off, a short-term rebound into the 670–690 region is possible. However, as long as price remains below 705–712, such a move would still be viewed as a counter-trend rally rather than a confirmed trend reversal.
🟩 Bullish Invalidation (10%)
A sustained move back above 705–712 would invalidate the bearish structure and suggest that the breakdown was a false move, shifting momentum back in favour of the bulls.
Final Thoughts
The technical picture currently favours the bears. The Diamond Top has completed, downside momentum remains strong, and market structure continues to deteriorate. While the recent decline may become stretched enough to produce a short-term bounce, the broader outlook remains bearish until QQQ reclaims the former support zone.
The 640 level is now the key battleground. The market's reaction there will likely determine whether this is simply a healthy correction within a larger bull market or the beginning of a more significant pullback.
This analysis is based solely on technical price action and chart structure. It reflects my personal market view and is not financial advice.
Short 
Long 
 Long
Long
 Long
Long
You Don't Break Your Rules Randomly"Three winners in a row. I've finally cracked it."
That was me. A Tuesday morning. Three green days behind me, chart open, hunting for trade number four.
The setup was a B-grade at best. Half my checklist. I took it anyway, at bigger size than my plan allowed.
I wasn't angry. I wasn't tilted. I felt unstoppable.
The trade lost. And I remember being genuinely confused. I only knew how to explain rule breaks that came from anger. This one came from confidence. I went looking for the tilt and couldn't find any. Nothing had felt wrong.
Everyone warns you about breaking rules after a loss. Nobody warns you about the win.
So this is the line I want you to sit with. You don't break rules randomly. You break them after specific sequences of wins and losses. That pattern is what's killing your account.
The break feels spontaneous in the moment. It isn't. It has a setup, the same way your trades do. There are three sequences that produce it. I've lived all three.
Winning Streaks Make You Dangerous
Win three trades in a row and watch what your brain does with it.
The profit doesn't feel like your money yet. It feels like the market's money. Casino players know this feeling well. They bet looser with winnings because losing them doesn't register as losing. House money. Your brain marks those winnings as a free bet. And free bets don't get protected.
So the size creeps. Nothing dramatic. A little more risk on the next one, because you've "earned the buffer."
Then the standards slip. B-setups start qualifying. The week looks like this.
- Monday: clean A-setup. Win.
- Tuesday: clean A-setup. Win.
- Wednesday: B-setup. Close enough. Another win.
- Thursday: no real setup. Took it on feel, at size.
By Thursday the rules feel beneath you. Rules are for traders who are struggling. You're not struggling. You're on a streak.
Traders call this feeling confidence. It isn't. Confidence is built on data. This is momentum borrowed from a good week, and it expires the moment the next normal losing run shows up.
The Thursday trade is the rule break. But it didn't start on Thursday. It started Monday, the moment winning began to feel normal.
And the loss gets logged as bad luck. That's the trap. You write "good idea, poor timing" in your journal and keep the streak story alive. The break never gets named. So it repeats on the next streak. Same spot. Same script.
The Make-It-Back Trade Runs On A Schedule
This is the sequence everyone knows. After losses. Most traders still only see half of it.
You take a loss. Fine. Losses are in the plan. You take a second loss. Now there's a number in your head. What you were up before, or what you're down for the week.
From that point the next trade stops being a trade. It becomes a recovery mission. It has to win, so the size goes up. It has to happen today, so the entry comes early, before the setup finishes forming. Your checklist says wait. Your P&L says now.
And the market does not know your number. It doesn't know you're down for the week. The level you need price to reach means nothing to anyone but you. That's what makes the make-it-back trade so expensive. It's built around your account instead of the chart.
I tracked this in my own journal. My worst rule breaks didn't follow one loss. They followed two in a row. Not every time. Often enough that I stopped calling it coincidence and built a hard rule around it.
What matters for you is the shape. The make-it-back trade doesn't appear out of nowhere. It shows up at a specific spot in your losing sequence. Yours might be after two losses, like mine. It might be after three, or after one oversized one. Find the spot and you can put a rule in front of it before you arrive.
You Take Revenge On A Market That Did Nothing To You
The third sequence has no loss in it at all. That's why almost nobody catches it.
You did the analysis. You marked the level. Price came close, you hesitated, and it ran without you. The full move. The exact one you called.
No money lost. Your account is untouched. But it doesn't feel that way. It feels like you got robbed in broad daylight. You'll replay it for hours. The entry you almost clicked. The R you almost banked.
So you chase. You enter late, mid-move, at the worst price on the chart. Nothing behind the trade except the feeling that you deserve to be in it. Or you force a different trade an hour later, because you owe yourself a position now.
Think about what that is. Revenge trading after a loss is at least aimed at your own mistake. This one is aimed at the market itself, for leaving without you. There is no person on the other side. Nobody wronged you. The move was never yours until you clicked.
A missed trade costs nothing. The trade you take to fix the missed trade is the one that costs.
This sequence also hides better than the other two. A missed trade never enters most journals, because no trade happened. So the trigger sits invisible, in the gap between two entries. You see a bad chase in your log and call it impatience. The real cause lived one row earlier, in a trade you never took. If your journal has no place for missed setups, this pattern stays buried.
Your Journal Already Knows Your Sequence
Three sequences. Winning streaks. Drawdowns. Missed trades.
I don't know about you, but when I first laid these out, one of them stung more than the others. That one is probably yours. Most of us have a dominant sequence, the one that sits in front of most of our breaks.
The problem is you can't see your sequence in the moment. In the moment, every rule break feels justified. The streak made the trade feel safe. The drawdown made it feel necessary. The missed move made it feel owed. Three different feelings. One identical result.
The sequence only becomes visible afterward, on paper, when you line your trades up in order. Every rule break in your journal has a context column waiting to be filled. What happened in the trades before this one? Not in the market. In you.
That's the actual skill here. Not more discipline. Not a stronger mindset. Pattern recognition, pointed at your own behavior for once. You already do this on charts every single day. Spot the pattern, define the trigger, act on it. Rinse and repeat. Now run the same process on yourself.
Find Your Sequence This Week
Here's the exercise. One evening, one journal.
Open your journal. Find your last 5 rule breaks. The early entries, the moved stops, the oversized positions, the trades that were never on your plan. If you can't find 5, that says something too. The worst breaks are the ones that never got logged.
For each one, write down what happened in the 3 trades before it. Win, loss, or a move you watched leave without you. Just the sequence, in order. 15 entries total.
Then look across all 5 rows. I'd be surprised if the same shape doesn't show up at least twice. That repeating shape is your sequence. Name it. Mine turned out to be the drawdown one. Two losses, then the break. Yours might be the streak, or the missed move.
Once you know your sequence, you'll feel it forming in real time. Three wins in and the size itch shows up. Two losses in and the recovery math starts. Except now you know exactly what that feeling is. It's not a signal. It's the sequence. The first time you catch it live and stand down, the whole thing pays for itself.
Stay consistent. Stay safe. Success is just around the corner.

SPY Reclaimed 740.44 - Back Into The Range.SPY Reclaimed 740.44 - Back Into The Range.
Tuesday's question was whether SPY would reclaim 740.44 or lose 735. It reclaimed. Price bounced back through 740.44 and is trading 742, back inside the 740 to 748 range with hourly conviction now very high and a fresh bull announcement behind it. The reclaim keeps the daily bull thesis alive and puts 748 back in the picture for what would be a seventh attempt. Same range, same ceiling, but the floor held. Neutral until 748 closes.
Resistance: 746.14 - first shelf
Key resistance: 748.00 - the ceiling, unbroken in six tries
Current price: 742.17
Support: 740.44 - reclaimed, back to support
Key support: 736.87 - first support below
Structural floor: 735.21 - the range low
Two paths from here:
It holds 740.44 and takes a seventh run at 748. The floor held and conviction is top-quartile - if SPY bases above 740.44, 748 comes back into range. A confirmed close above 748 is still the event that would finally trigger the long on the leanable name. Six failures, but the setup keeps rebuilding.
It loses 740.44 again. A reclaim that cannot hold is a weak signal. Back below 740.44, with 735.21 beneath, would put the range break back on the table. The floor has to actually hold this time.
SPY did what it needed to and reclaimed 740.44, keeping the range and the bull thesis alive. But it is the same range and the same 748 wall - nothing is resolved until that level closes over or 735 breaks.
Built with SYNTHESIS v3.3 | SOM / ACE / IMP / SYNTHESIS
Study, not financial advice.