ETF market
USO Faces Intraday Pressure as Iran Peace Premium UnwindsCurrent Price: 144.27
Direction: SHORT
Confidence level: 85%(Trader consensus remains unified across group metrics.)
Targets
Target 1: 143.30
Target 2: 142.10
Stop Levels
Stop 1: 145.20
Stop 2: 146.40
Wisdom of Professional Traders:
Across both crude futures and the USO ETF, the combined signal from professional traders and X sentiment points to intraday downside pressure TODAY. The real story right now is the geopolitical premium in oil rapidly unwinding. Several traders I tracked on X highlighted the same catalyst: accelerating U.S.–Iran diplomacy and discussions about reopening the Strait of Hormuz. When traders start pricing in de‑escalation, oil typically loses the risk premium it had built during tensions.
What’s interesting is that this macro shift is already visible in market rotation data. Energy was the only sector red while tech, momentum, and broader risk assets surged. That’s a classic “peace trade” pattern where capital rotates out of commodities tied to geopolitical risk and into equities. Multiple traders also pointed out a bearish engulfing pattern near resistance in WTI, reinforcing the idea that buyers lost momentum exactly where they needed a breakout.
Yes, inventory data showed a large draw, which normally supports oil prices. But intraday trading TODAY is clearly being driven more by geopolitical repricing than supply data. When a major risk premium unwinds, the technical reaction tends to dominate short‑term moves.
So combining trader commentary, sector rotation, and the failed breakout pattern, the bias for TODAY’s session favors continued downside pressure in both WTI and USO unless a surprise geopolitical headline reverses sentiment.
Key Insights:
USO is reacting primarily to macro headlines TODAY rather than traditional supply metrics. The ETF tracks crude oil prices, and the dominant narrative in the market right now is diplomatic progress between the U.S. and Iran. Several traders pointed out that if negotiations move toward reopening the Strait of Hormuz, the geopolitical risk premium embedded in oil prices starts to disappear quickly.
Technically, USO is coming off a sharp sector rotation event where energy became the worst‑performing segment of the market while risk assets surged. That type of rotation often signals institutional repositioning. When funds reduce exposure to energy during a risk‑on shift, ETFs like USO often see follow‑through selling intraday.
Another factor traders mentioned is the failed momentum push. Even though the broader trend had been supported by supply concerns and inventory draws, the price action showed exhaustion near resistance. The combination of macro relief and stalled momentum makes the downside setup more attractive for TODAY’s session.
Recent Performance:
In the last session, USO dropped sharply as energy became the only major sector in the red while tech and growth stocks rallied. Even with a reported crude inventory draw of nearly 7.9 million barrels, the market largely ignored the bullish supply signal. Instead, traders focused on the geopolitical narrative, which drove a quick repricing lower.
Expert Analysis:
Professional traders I tracked are split structurally but cautious short term. Some still argue that the broader chart structure remains bullish due to supply constraints and OPEC discipline. However, many short‑term traders on X highlighted the bearish engulfing structure and sector rotation as reasons to avoid new longs TODAY.
Options sentiment leaning bearish also supports this view. When derivatives traders hedge downside while price stalls near resistance, it usually reflects expectations of a near‑term pullback rather than immediate continuation higher.
News Impact:
The biggest catalyst TODAY is diplomatic progress between the U.S. and Iran. Reports that talks are in their “final stages” triggered a classic macro reaction: stocks rallied while oil dropped. Markets are effectively removing the war risk premium that had supported crude earlier. That shift is likely to keep pressure on USO intraday unless negotiations collapse unexpectedly.
Trading Recommendation:
For TODAY only, the setup favors a tactical SHORT bias. The macro narrative and technical rejection near resistance suggest traders may continue fading strength intraday rather than chasing upside.
USO Faces Intraday Pressure as Iran Peace Premium UnwindsCurrent Price: 144.27
Direction: SHORT
Confidence level: 85%(Trader consensus remains unified across group metrics.)
Targets
Target 1: 143.30
Target 2: 142.10
Stop Levels
Stop 1: 145.20
Stop 2: 146.40
Wisdom of Professional Traders:
Across both crude futures and the USO ETF, the combined signal from professional traders and X sentiment points to intraday downside pressure TODAY. The real story right now is the geopolitical premium in oil rapidly unwinding. Several traders I tracked on X highlighted the same catalyst: accelerating U.S.–Iran diplomacy and discussions about reopening the Strait of Hormuz. When traders start pricing in de‑escalation, oil typically loses the risk premium it had built during tensions.
What’s interesting is that this macro shift is already visible in market rotation data. Energy was the only sector red while tech, momentum, and broader risk assets surged. That’s a classic “peace trade” pattern where capital rotates out of commodities tied to geopolitical risk and into equities. Multiple traders also pointed out a bearish engulfing pattern near resistance in WTI, reinforcing the idea that buyers lost momentum exactly where they needed a breakout.
Yes, inventory data showed a large draw, which normally supports oil prices. But intraday trading TODAY is clearly being driven more by geopolitical repricing than supply data. When a major risk premium unwinds, the technical reaction tends to dominate short‑term moves.
So combining trader commentary, sector rotation, and the failed breakout pattern, the bias for TODAY’s session favors continued downside pressure in both WTI and USO unless a surprise geopolitical headline reverses sentiment.
Key Insights:
USO is reacting primarily to macro headlines TODAY rather than traditional supply metrics. The ETF tracks crude oil prices, and the dominant narrative in the market right now is diplomatic progress between the U.S. and Iran. Several traders pointed out that if negotiations move toward reopening the Strait of Hormuz, the geopolitical risk premium embedded in oil prices starts to disappear quickly.
Technically, USO is coming off a sharp sector rotation event where energy became the worst‑performing segment of the market while risk assets surged. That type of rotation often signals institutional repositioning. When funds reduce exposure to energy during a risk‑on shift, ETFs like USO often see follow‑through selling intraday.
Another factor traders mentioned is the failed momentum push. Even though the broader trend had been supported by supply concerns and inventory draws, the price action showed exhaustion near resistance. The combination of macro relief and stalled momentum makes the downside setup more attractive for TODAY’s session.
Recent Performance:
In the last session, USO dropped sharply as energy became the only major sector in the red while tech and growth stocks rallied. Even with a reported crude inventory draw of nearly 7.9 million barrels, the market largely ignored the bullish supply signal. Instead, traders focused on the geopolitical narrative, which drove a quick repricing lower.
Expert Analysis:
Professional traders I tracked are split structurally but cautious short term. Some still argue that the broader chart structure remains bullish due to supply constraints and OPEC discipline. However, many short‑term traders on X highlighted the bearish engulfing structure and sector rotation as reasons to avoid new longs TODAY.
Options sentiment leaning bearish also supports this view. When derivatives traders hedge downside while price stalls near resistance, it usually reflects expectations of a near‑term pullback rather than immediate continuation higher.
News Impact:
The biggest catalyst TODAY is diplomatic progress between the U.S. and Iran. Reports that talks are in their “final stages” triggered a classic macro reaction: stocks rallied while oil dropped. Markets are effectively removing the war risk premium that had supported crude earlier. That shift is likely to keep pressure on USO intraday unless negotiations collapse unexpectedly.
Trading Recommendation:
For TODAY only, the setup favors a tactical SHORT bias. The macro narrative and technical rejection near resistance suggest traders may continue fading strength intraday rather than chasing upside.
VanEck Semiconductor ETF (SMH)The price action in NASDAQ:SMH is showing significant resistance at the $575-$580 zone. This rejection aligns with the semiconductor ETF testing the upper boundary of the 1-day Hull Moving Average (HMA) ribbon, a key technical indicator that defines the prevailing trend structure.
This rejection at a major technical confluence is particularly noteworthy because NASDAQ:SMH is also forming a rounding top pattern on the daily chart. This pattern is a classic bearish reversal formation that typically occurs after a sustained uptrend, signaling that buying momentum is waning and distribution may be taking place.
Key levels to monitor:
Resistance: The $575-$580 zone and the top of the 1D HMA ribbon remain the primary hurdle for any bullish continuation.
Support: A decisive break below the neckline of the rounding top pattern would provide stronger confirmation of a bearish reversal. This would likely target lower support levels, with the first significant level to watch being the $540-$550 area.
Further selling pressure below the current levels would validate the bearish signals and could trigger a more pronounced technical pullback.
SPY: The Case for $740 by Year-End - V-Shape Recovery !If you haven`t bought the dip on SPY:
Now SPY is currently trading at $701, and while sentiment remains fragile in the wake of the recent sell-off, the technical and macro setup is quietly building the case for a run toward $740 by year-end — a move of just 5.6% from current levels. That's not a bold call. That's almost boring, by historical standards. Here's why.
1. The Math Is Undemanding
Let's start with the simplest argument. $740 EOY from $701 today requires a 5.6% gain over roughly 8 months. You're not betting on euphoria. You're betting on regression to the mean in a market that overshot to the downside.
2. The V-Shape Is Technically Confirmed
3. A Fed Pivot Is Now a Question of When, Not If
The Hormuz crisis has created a paradox for the Fed: a supply-side inflationary shock coinciding with slowing demand. This is the worst environment for a hawkish stance. History suggests the Fed blinks when credit conditions tighten and growth risks spike simultaneously.
A rate cut — or even credible cut signaling — is rocket fuel for equity multiples. In a 22-23x P/E environment with rates moving lower, the earnings math for $740 writes itself.
4. Earnings Are More Resilient Than the Tape Suggests
The market sold off on fear, not on fundamental deterioration. Look beneath the surface:
Energy and Defense are printing record margins in the current geopolitical environment
Big Tech is still deploying AI capex aggressively — Microsoft, Google, Meta, Amazon have not blinked
Key Risks to the Thesis:
- Hormuz escalation beyond current pricing — a full closure for 60+ days would trigger a demand destruction spiral that overrides all the above
- Fed surprise hawkishness — if CPI re-accelerates, the pivot narrative dies and multiples compress
- Credit event — something breaks quietly in the plumbing (regional banks, CLOs, leveraged loans) and risk-off returns with vengeance
- Earnings miss — if Q2 reports show margin compression across sectors, the EPS math falls apart
$740 by year-end is not a moonshot. It's a 5.6% move in 8 months, supported by recovering technicals, a likely Fed pivot, resilient earnings, structural capital inflows, and the most favorable seasonal window of the year. The V-shape is real.
QQQ Nasdaq 100 ETF - The stock market Bottom is In !If you haven`t bought the dip on QQQ:
Now QQQ is trading at $640. The target is $690 by year-end — a 7.8% move from current levels. In a normal year, that's an unremarkable call. In the context of what just happened — a sharp, fear-driven drawdown followed by a textbook V-shaped recovery — it's arguably the highest-conviction trade of 2026.
1. The Bottom Is In — Here's Why This Time Is Different
Market bottoms are only obvious in hindsight. But there are fingerprints.
The recent low showed:
Capitulation volume — the kind of spike that historically marks exhaustion, not continuation
Breadth divergence — price made new lows but fewer stocks participated, a classic non-confirmation
When fear peaks and institutions quietly accumulate, the bottom is in. That's the setup here.
2. The Math Is Straightforward
$640 to $690 is 7.8% in approximately 8 months.
The Nasdaq 100 has recovered from every geopolitical shock, every rate scare, every recession fear in its history — and it has done so faster than most investors expected each time.
You are not being asked to believe in a bull market. You are being asked to believe that a 7.8% move is achievable for the most innovative index in the world, in a year where AI capex is accelerating and rates are likely heading lower.
3. AI Is Not a Narrative — It's a Revenue Cycle
The AI buildout is no longer speculative. It is showing up in:
Microsoft Azure revenue growth — accelerating, not decelerating
Google Cloud margins — expanding as AI workloads scale
Meta's efficiency gains — AI-driven ad targeting is printing money
Amazon AWS — re-accelerating after a digestion period
Nvidia — the picks-and-shovels play that anchors the entire cycle
The companies that make up the top 10 holdings of QQQ are not priced on hope anymore. They are priced on cash flows, and those cash flows are growing.
Bears who call this "2000 all over again" are confusing optionality with earnings. These companies have earnings. Enormous ones.
4. Rate Sensitivity Works Both Ways
If the Fed pivots — and the macro setup increasingly forces their hand — QQQ benefits disproportionately compared to SPY. The duration trade unwinds in your favor. Growth multiples re-expand.
The Bottom Line:
QQQ at $640 with a $690 year-end target is a 7.8% call on the most innovative, cash-generative, structurally advantaged index in the world — in a macro environment that is increasingly favorable for exactly this trade.
The bottom is in. The AI cycle is real. The Fed pivot is coming. The shorts are trapped. The seasonality is aligned.
Brazil Following in the Footsteps of Emerging MarketsThe Brazil ETF AMEX:EWZ is bouncing off its lows and heading toward the fund's all-time highs. The upcoming elections, combined with the broader emerging market uptrend AMEX:EEM , suggest the possibility of a bullish continuation — first targeting all-time highs, and then potential price discovery beyond them.
GGLL ETF = 2X GOOGL Trimming into Strength JournalJournal notes on the trade. Actual trims on chart.
04/14Strong breakout; MAGS strong day; EARNINGS APPROACHING
04/27- Took profits into strength over 4atr above the 21 day;
04/23 breaking above 110 HH- move stop;
04/28 SOLD 1/2 REMAINING DUE TO EARNINGS TOMORROW.
05/01 Trimmed 1/2 @137.14
05/20 Stopped
I was happy with this trade because I wanted the benefits of Googl, but I was seeking better than the market returns. Googl returned about 20% in this time period; SPY app 8.73%;
GGLL return in that time: 37%. I was able to capture a 20% due to the early gains.
**Daily Chart Breakdown** *Wednesday 5/20/26***SPY — SPDR S&P 500 ETF Trust**
**Daily Chart Breakdown**
*Wednesday 5/20/26*
### 🔍 Key Observations
• SPY continues showing extremely strong bullish continuation on the higher timeframe after the sharp V-shaped recovery from the April lows.
• Bulls have now reclaimed nearly the entire prior breakdown structure and continue grinding higher while respecting the rising trend structure.
• The current move is now consolidating just beneath the recent highs near **740–748**, which is typically constructive behavior after such an aggressive momentum expansion.
• Importantly, there is still no confirmed higher timeframe breakdown structure forming yet. Until that changes, the overall trend remains bullish.
• Price continues riding above the daily 50EMA while the daily 200EMA trends strongly upward underneath price action.
### 📊 Key Levels to Watch
**Immediate Resistance**
• **740.70** → near-term resistance
• **748.17** → major breakout level
• **749.53** → all-time high area
**Immediate Support**
• **734.59** → first key support
• **720.65** → major continuation support
• **714.47** → important higher low support
• **705.76** → major structure support
• **689.70** → larger higher timeframe support shelf
### 📈 Volume & Trend Notes
• Volume has steadily cooled during this consolidation near highs, which is generally constructive after a major expansion leg.
• The higher timeframe trend channel remains fully intact.
• Momentum remains firmly bullish while price continues printing higher lows and holding above the daily 50EMA.
• Broader market structure still favors continuation unless SPY begins losing actual higher timeframe support structure.
### ✅ Trading Plan
#### Bullish Scenario
Trigger: Continued hold above **734.59** with breakout continuation over **740.70**
Targets:
• PT1: **748.17**
• PT2: **749.53**
• PT3: Potential continuation into further price discovery if momentum expands
Stop Loss:
• Breakdown below **720.65**
#### Bearish Scenario
Trigger: Loss of **720.65** with weakness confirming beneath the recent trend structure
Targets:
• PT1: **714.47**
• PT2: **705.76**
• PT3: **689.70**
Stop Loss:
• Strong reclaim back above **734.59**
### 🧠 Summary
The market continues behaving like a strong bullish continuation environment until proven otherwise.
There is always room for pullbacks and consolidation after aggressive rallies, but structurally SPY still looks very healthy overall on the higher timeframe.
For now, the trend remains bullish until actual higher timeframe structure is lost.
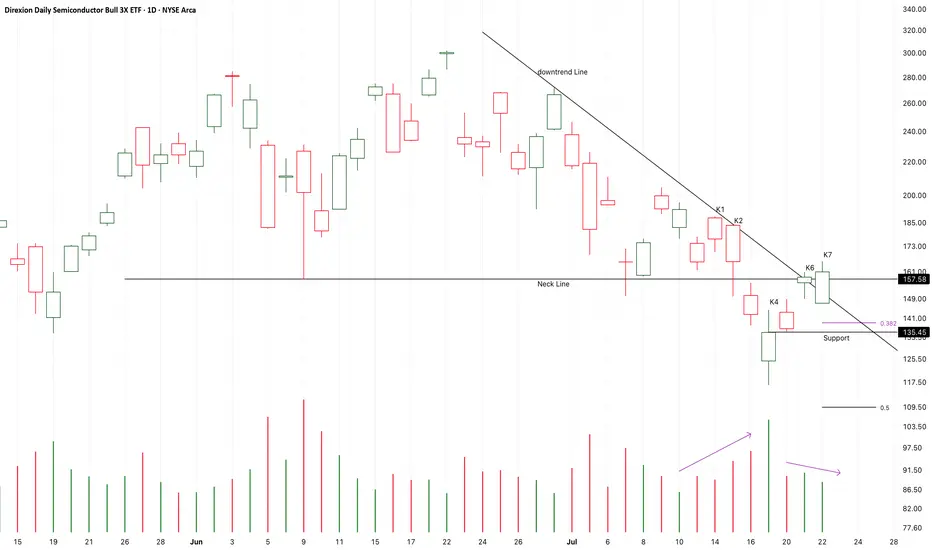
SOXL continues to reflect strength in the AI sectorThe ETF maintains a strong bullish structure after a powerful rally and continues to hold above a key support zone. The current consolidation within the 167-134 range appears to be a healthy correction inside a strong uptrend.
The trading plan is to consider long positions in the 167-134 zone with potential continuation toward new highs. The scenario becomes invalid below 120. Upside targets are located around 218 and 270.
From a technical perspective, price remains well above major moving averages while the structure continues forming higher highs and higher lows. The current pullback appears to be an accumulation phase before another bullish impulse. Holding support levels together with recovering volume confirms ongoing buyer strength.
Fundamentally, the sector continues to receive strong support from the global AI boom. Rising investments in data centers, AI chips, server infrastructure and high performance computing continue to drive demand for semiconductor companies. SOXL remains one of the key instruments for an aggressive bullish exposure to the semiconductor sector.
As long as the current structure holds, the bullish scenario remains in focus.
IGV - Software ETF Through the TrendGo Accumulate LensIGV spent the last few months rebuilding after a sharp breakdown earlier this year.
But the important part is not the bounce itself.
The important part is where the bounce started.
Using TrendGo Accumulate , we can see that IGV entered an accumulation area twice after the selloff. Both times, price interacted with the Accumulate structure near the lower part of the range, where the market started showing signs of absorption instead of continued downside expansion.
This is exactly what Accumulate is designed to highlight.
Not a signal.
Not a prediction.
A structure.
The first Accumulate zone appeared after the major decline, when price started stabilizing around the long-term accumulation curve. The second one appeared after another reset, again showing that the market was spending time in an area where selling pressure was no longer expanding aggressively.
That is the key point:
Accumulate helps identify where the market may be building structure before the move becomes obvious.
IGV then moved away from that area and continued higher, showing why accumulation zones can be useful for understanding market behavior after sharp corrections.
The lesson is simple:
The strongest recoveries often do not begin with a clean breakout.
They begin when price stops breaking down, starts absorbing supply, and builds structure near zones most traders ignore.
That is why we built Accumulate.
To help traders focus less on emotion - and more on structure.
GDX Approaches Key Support Zone $78.6– $82 RangeThe short‑term Elliott Wave outlook for Gold Miners ETF (GDX) shows a correction unfolding from the March 20, 2026 low. This move is developing as a zigzag structure, a common three‑wave corrective pattern. From the March 20 high, wave (A) ended at $85.46, followed by a rally in wave (B) that reached $98.74. The ETF has since turned lower, with wave (C) now in progress and subdividing into five smaller waves.
From the peak of wave (B), wave 1 concluded at $92.85. A corrective rally in wave 2 then advanced to $97.56. The ETF extended lower in wave 3, which is expected to finish soon. Afterward, a rally in wave 4 should emerge, likely in three or seven swings, before a final decline in wave 5 completes wave (C). The downside target aligns with the 100% Fibonacci extension of wave (A) and the prior pivot low of March 20, 2026. This area falls between $78.74 and $81.90, forming a critical support zone.
Near term, as long as price remains below $98.74, GDX retains scope to extend modestly lower before stabilizing. A decisive break beneath $78.74, however, would imply that the correction is evolving into a larger double structure. This scenario highlights the importance of monitoring Fibonacci projections and prior pivots to anticipate the next directional move.
$XHB Homebuilders ETF Moment of Truth at 50WMATHE REAL ESTATE MARKET IS SHOWING MAJOR CRACKS 🚨
Golden Arches spotted on the Homebuilders ETF 🍔🍟
AMEX:XHB has lost the .382 Fib, and currently testing the 200WMA which has historically acted as very strong support.
Last time it broke we saw a 50% correction.
So far it's 25% down, so has a ways to go.
Could easily get back down to ~$60, or even a full retrace to ~$50.
Expect the price of homes to crate if this happens.
Do you know the muffin man?I think we do the upward dispersion version of events here. We float up while some funds trim but nobody pushes the tape enough to really change trajectory. Internals will be pressured but refrain from breaking. Everyone hoping for a quick resolution will be very very butthurt.
$IGV new lows incomingI don't know how anyone looks at this chart and thinks that it looks bullish.
We've broken down through key support levels and have now retested them as resistance. There is a possibility we see a little more upside before a larger drop, but price is below the cloud and the structure of price action is bearish until it breaks above the cloud.
I personally wouldn't be a buyer in software until we hit one of the lower support levels or until price can make it back above the cloud.
I think we're set to fall much further from here.
SPYI showing short‑term upside pressure above $53.50Current Price: 53.53 (Analysis was generated on Monday Morning)
Direction: LONG
Confidence level: 38%(Only limited X sentiment data exists with a small bullish skew and almost no bearish pressure. Lack of trader transcripts reduces confidence but absence of strong negative sentiment supports a modest upside bias.)
Targets
Target 1: 54.60
Target 2: 55.40
Stop Levels
Stop 1: 52.70
Stop 2: 51.90
Key Insights:
Here’s what’s driving this setup right now. Data coverage for SPYI is thin this cycle—there are no detailed professional trader transcripts or deep discussion threads available. That usually lowers conviction. Still, the available social sentiment shows a small bullish skew with more positive trading mentions than negative ones.
What caught my attention is the absence of strong bearish positioning. When sentiment volume is low but the negative voices are even lower, it often means traders simply aren’t pressing shorts. In ETFs like SPYI that track broader equity dynamics and income strategies, that type of positioning often leads to slow grind‑higher price action rather than sharp moves.
Because we don’t have specific price levels from trader commentary this week, I’m anchoring levels around the current price using tight percentage‑based projections. With the asset sitting around $53.53, a typical short‑term ETF move of 2–4% gives us realistic targets for the next several sessions.
Recent Performance:
SPYI has been trading in a relatively stable band typical for covered‑call style income ETFs. The price has held in the low‑to‑mid $50 range recently, showing controlled movement rather than sharp volatility. That kind of structure usually favors gradual upside drift when broader equities remain stable.
The lack of aggressive downside breaks suggests buyers are still stepping in on minor pullbacks. That’s another small clue supporting a modest bullish bias this week.
Expert Analysis:
While detailed commentary from professional traders is missing in this dataset, the trading community’s limited discussion hints at a quiet accumulation environment rather than active distribution. Several traders discussing income ETFs broadly have pointed out that stable option‑income funds tend to climb slowly when the S&P 500 holds steady.
What I’m seeing here is a classic low‑noise ETF setup: modest social interest, minimal bearish conviction, and steady price behavior. Those conditions often precede slow upward continuation moves rather than breakdowns.
Without strong resistance levels identified in trader commentary, the most practical approach is a momentum continuation trade targeting a 2–4% move within the week.
News Impact:
There’s no major news catalyst affecting SPYI directly at the moment. That actually matters—income ETFs frequently move with broader equity sentiment rather than individual headlines. With no negative macro shock driving sentiment, the path of least resistance remains slightly upward alongside broader market stability.
If equity volatility suddenly spikes, that would be the primary risk factor to watch.
Trading Recommendation:
Here’s my take: SPYI looks like a cautious LONG trade for the coming week. The signal strength is modest because data coverage is limited, but the available sentiment tilts positive and there’s no strong bearish pressure showing up.
A practical setup would be entering near the current $53.50 area with upside targets at $54.60 and $55.40 over the next 5–7 trading days. Risk should be controlled with stops at $52.70 and $51.90 in case broader market sentiment weakens.
This isn’t a high‑conviction breakout trade—it’s more of a steady ETF drift play. Position sizing should reflect the lower confidence level.
Semiconductors ETF Facing Profit‑Taking Pressure After AI RallyCurrent Price: 556.34 (Analysis was generated on Monday Morning)
Direction: SHORT
Confidence level: 58%(Professional trader snippets repeatedly highlight profit-taking, sector rotation, and weakening short-term momentum after a major rally. While social sentiment remains partially bullish, trader commentary leans toward a near-term correction.)
Targets
Target 1: 532.00
Target 2: 515.00
Stop Levels
Stop 1: 575.00
Stop 2: 595.00
Key Insights:
Here's what's driving this setup right now. Several professional traders are warning that the semiconductor sector has become stretched after a massive AI‑driven rally. The ETF recently pushed to new highs, but trader discussions increasingly focus on profit‑taking rather than fresh momentum. That change in tone matters.
Multiple traders also pointed out that some leading chip stocks—AMD, Intel, and Micron—have started slipping below short‑term moving averages. When leaders lose short‑term trend support, the ETF that aggregates them often follows. I'm seeing repeated comments about sector exhaustion after the vertical run earlier this year.
Another factor traders keep mentioning is valuation pressure. The semiconductor ETF trades at a premium multiple compared with the broader market. That’s fine during strong momentum phases, but once yields rise or growth expectations wobble, high‑multiple sectors usually pull back first.
Recent Performance:
You can see this tension in the price action. SMH has been one of the best‑performing ETFs in the market, up more than 120% over the past year and nearly 20% in the past month alone. The rally accelerated during the AI infrastructure boom as Nvidia, TSM, and AMD surged. But volatility is picking up: the sector recently dropped more than 4% in a single session after hitting fresh highs, which traders often interpret as early distribution.
Expert Analysis:
Traders tracking the sector repeatedly highlighted the same theme: semiconductors may be entering a cooling phase after leading the market rally for months. Several traders specifically flagged the ETF's recent weakness relative to other tech groups like software, which can signal rotation away from chips.
Technical indicators still show the ETF above long‑term moving averages, but momentum oscillators are getting stretched. A few market experts pointed to resistance near the upper‑580s while noting strong structural support closer to the low‑500s. When I combine those levels with current price action, the risk‑reward favors a short‑term downside test.
News Impact:
News flow is adding to the uncertainty. The semiconductor sector continues to benefit from AI spending, but geopolitical risks and potential semiconductor tariffs are appearing more frequently in trader discussions. There are also supply chain concerns around memory pricing and chip production capacity. None of these immediately break the bull story—but they can easily trigger short‑term pullbacks after such an aggressive rally.
Trading Recommendation:
So where does this leave us? I’m leaning SHORT on Semiconductors ETF for the next trading week. The setup looks like classic post‑rally digestion: stretched momentum, traders talking about profit‑taking, and sector rotation starting to appear. I’d look for a pullback toward $532 first, with a deeper test around $515 if selling accelerates. Risk management matters here—if price pushes above $575 and holds, the bearish setup weakens quickly. For position sizing, I’d keep exposure moderate given how strong the long‑term trend still is.
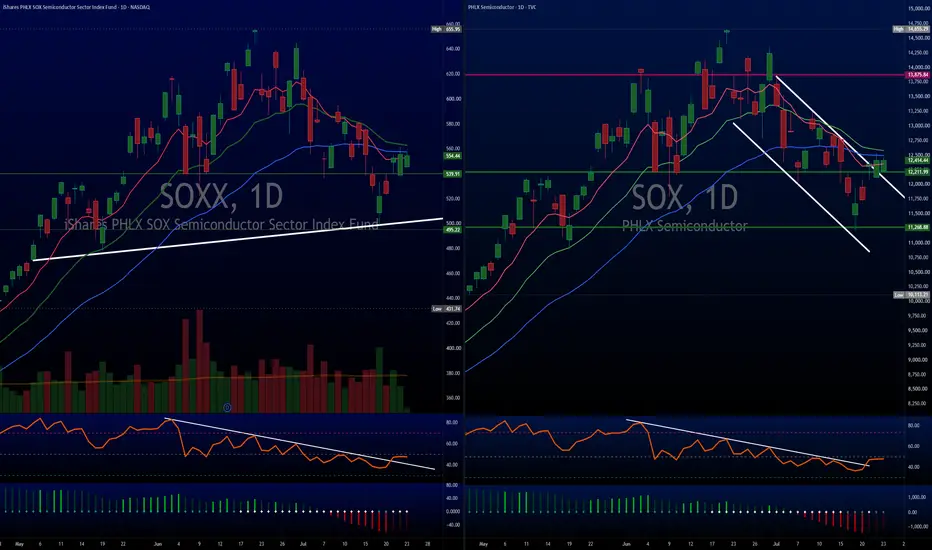
SOXX MAY 2026SOXX rejected below the 533.74 top zone after a strong vertical move. Price is now testing the 476.80 support area, with the 440 gap as the next key retest level if sellers keep control.
Institutional behavior suggests distribution near 510-533, while absorption should appear between 476-440 if buyers want to defend the trend. A clean loss of 440 opens the path toward the stronger 420-390 support range.
Upside target: 510-533
Downside target: 440, then 420-390
Extended downside if support fails: 368-350 gap zone
Bias: neutral to bearish below 510; bullish recovery only above 533.