 Long
Long
Long 
 Short
Short
$GLD Daily Close — Sep 4AMEX:GLD is my favorite one, and gold's tell is the gap. It gives the best gap setups in either direction.
Fundamentals crushed the market today and futures were falling into it. AMEX:GLD closed 406.77 with a range of 4.04 against a 7.94 ATR — 51% of a normal day — and volume at 9.82M against a 12.3M average, 80% relative volume. Below average, and below the last two sessions.
Today the gap filled completely and price closed green on low volume. That's No Demand. Buyers didn't show up to take the fill, they just stopped being sold. I'll grade it soft though, because the close came in the upper third rather than right at the high, and the low at 403.96 got bought back. Neither side committed.
The bar that still matters most is last week's. Wide spread down into 395.51, closing well off the low, on the heaviest volume on this entire chart. That's Stopping Volume — selling absorbed at the lows, not selling exhausted into them. I traded that red hammer near 395. The market held the 400 psych number, gave two days up, then the big gap.
That's why 400 is the key for me now, and it's more than a round number. The MTF cloud (@ripster47 EMA cloud) sits at 399–400.35, right on top of the Key Level, right on top of the psych figure. Three reasons stacked in two points. I change my bias on a 400 break.
Zoom out: AMEX:GLD did very well after breaking the 382.27 downward sloping trendline and running to 430. That was the whole move.
Upside, there's heavy options flow at 420. So if price can hold and curl the 408–409 5-12 Curl (@ripster47 EMA cloud), 420 comes into play. No long trigger before that.
Trigger 409.01, and I want it on volume above 12.3M. Invalidation 399.33.
Monday the US market is closed but the commodity market reopens Sunday evening. My suggestion — avoid it and enjoy the day with your families. Happy Labor Day. $SPY Daily Close — Sep 4, 2026Fundamental Side
NFP shook the whole market. The job numbers came in hot enough to be inflationary, and that's the kind of print that can change the Fed's stance. The whole market got shaken out with it — gold and silver included — while the USD Index strengthened on the hawkish data. More data next week to confirm.
Worth noting: AMEX:SPY still closed red on a hawkish print, but on low volume. That's the part most people will skip. A print that genuinely repriced the Fed should have brought sellers with size. It didn't.
Technical Side
Yesterday was a big day — effort and result in agreement, big move with the volume behind it.
Today's red candle is a pullback to the 5-12 cloud (@ripster47 EMA cloud) on low volume. Narrow spread too — 3.87 against a 6.22 ATR, the narrowest bar of the last four sessions.
Down bar, narrow spread, volume lower than the day before. That's No Supply. Sellers didn't commit. Profit-taking, not distribution.
Price is still holding above the cloud at 767.95–768.41, so the curl is intact. I hold the bullish view as long as 766 holds. Break 766 with good volume and I may short the market.
Volume Analysis
34.03M against a 36.8M average — 92% relative volume, and roughly 18% below yesterday's 41.28M. Red candles on falling volume points to profit-taking pullback rather than a shift in control.
Tuesday is the day — Monday is Labor Day. If the 5-12 cloud (@ripster47 EMA cloud) holds, this was just a pullback. If 766 breaks on real volume, effort produced no result and the 5-12 Break (@ripster47 EMA cloud) is the setup to play.
And note that qualifier: on real volume. A break of 766 on 30M shares is a shakeout, not a trend change. That's the one that stops people out right before the next leg.
Levels: hold 766. Above, 775 then 777.50–780. Below, 760.57 then 756.70.  Long
Long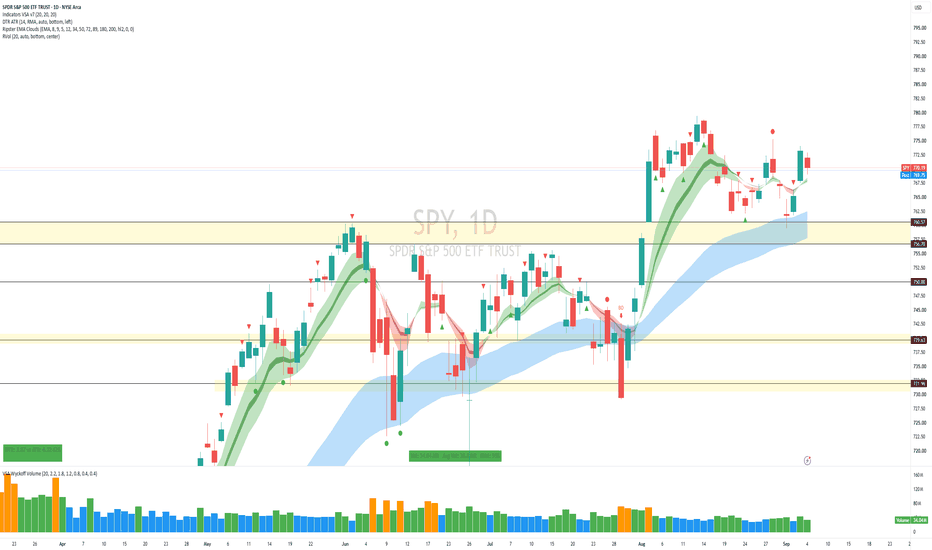
$QQQ Daily Close — Sep 4Fundamental side
NFP shook the whole market. The job numbers came in hot enough to be inflationary, and that's the kind of print that can change the Fed's stance. The whole market got shaken out with it — gold and silver included — while the USD Index strengthened on the hawkish data. We'll see more data next week to confirm.
Worth noting: NASDAQ:QQQ still closed green on a hawkish print. Tech absorbed the hit rather than breaking down on it.
Technical side
The market did very well yesterday on the @ripster47 34-50 EMA cloud and @ripster47 5-12 EMA cloud curl. Today's price action was indecisive, especially after NFP. We'll see on Tuesday — if the market holds 720 it may see 724, then 730. Otherwise a 712-710 pullback is expected.
Volume analysis
Narrow spread candle on higher volume. That shows profit-taking on the long trades.
Here's the part worth sitting with. Volume has climbed three sessions straight — 23.4M, then 28.9M, then 32.8M today at 107% relative volume. Yesterday the breakout happened without volume behind it. Today the volume finally turned up and price went nowhere: high of 721.86, the highest print since mid-August, then straight back to close at 718.96, below the open, mid-range.
More effort, less result. Buyers spent more today than yesterday and got a fifth of the move. That's supply meeting the advance, and it's why this reads as profit-taking rather than continuation.
What I'm waiting for
A low-volume pullback. If price eases back into 714-716 on quiet volume and holds, that's a test, and it's the better entry than chasing 720. Quiet is what I want to see there — a heavy pullback is a different story.
If the @ripster47 5-12 EMA cloud breaks on more than 115-120% relative volume, then 712-710 is live. The volume qualifier matters. A break on light volume is far less reliable than one on real supply.
I'm still long from the curl, managing against 714.
Have a great weekend — happy Labor Day. Long 
QQQ Weekly Outlook: 702 Support vs 725 Breakout | Aug. 31–Sep. 4QQQ Weekly Outlook: 702 Support vs 725 Breakout | Aug. 31–Sep. 4
QQQ finished last week at 716.43 after once again proving that the area between roughly 702 and 725 is the market’s current decision zone.
Last week gave us an unusually clean test of that framework. QQQ reached 702.70 on Monday, holding just above our lower support boundary, then rallied to 724.13 on Friday before failing just beneath the 725.39 breakout level. Neither side of the range confirmed, and price finished the week back near the middle.
The important change entering this week is that the broader structure has improved. The current chart shows the Daily, Weekly and Monthly trends all bullish , bullish market structure, price above the 20 EMA, and buyers controlling VWAP. The market-state model is also back to Bull Directional .
But that does not automatically make 716 an attractive bullish entry location. Momentum remains neutral, price is mid-range, and QQQ is still below both the descending resistance structure and 725.39 R1 . The current signal plan therefore remains WAIT .
Bullish scenario
The first real test is 725.39 . A convincing breakout and acceptance above that level would clear the top of the current decision range and weaken the descending resistance structure. Above 725.39, the next upside references are 736.10 , then 745.74 . The larger confirmed Double Bottom measured-move reference remains near 766.02 .
Neutral scenario
If QQQ remains between 702.14 and 725.39 , the market is still inside the same broad range that controlled last week. In that environment, strength into resistance and weakness into support can continue to reverse without producing a durable directional move. The middle of the range remains the least informative location.
Bearish scenario
The first important downside level is now 702.14 . A test that holds and reclaims that area would continue to support the bullish higher-timeframe structure. A decisive loss of 702.14 would materially change the picture and expose 686.19 next. Beneath that, the major lower reference is 662.46 , close to the existing Double Top measured-move reference around 664.20 .
So the setup entering the week is constructive, but conditional:
Above 725.39 → bullish expansion becomes more credible.
Between 702.14 and 725.39 → remain patient; the range still controls.
Below 702.14 → downside risk increases materially.
The strongest part of the chart right now is the higher-timeframe trend. The weakest part is location. Until QQQ reaches one of the edges of the range or produces a clean breakout, there is little reason to force a directional call from the middle.
This week’s major catalysts are heavily concentrated around the labor market. Tuesday brings JOLTS and ISM Manufacturing at 10:00 ET. Wednesday brings ADP employment at 8:15 ET. Thursday includes jobless claims and revised productivity/costs at 8:30 ET plus ISM Services at 10:00 ET. Friday brings the August Employment Situation / nonfarm payrolls at 8:30 ET.
Friday is especially important because the previous July employment report showed payrolls down 23,000 with unemployment at 4.1% , making the August report a potentially significant catalyst for rates and growth-sensitive technology shares.
Bottom line: QQQ enters the week with bullish higher-timeframe structure, but still trapped beneath the same resistance that capped last week. 702 and 725 remain the levels that matter most. Let price tell us which side wins.
Informational purposes only. Not financial advice. Long 
A September to Remember?This is a 1-hour SPY chart, and the scenarios on it extend all the way through the end of September.
That is much longer than most of the scenario maps I normally share, so before we talk about Green, Yellow or Red, I want to explain exactly what this chart is — and what it is not.
First: these dotted lines are NOT predictions
I am not saying:
“SPY will be at this exact price on September 14, then it will drop on September 18, then rally again on September 25.”
I cannot know that.
Nobody can.
Think of this chart like looking at a map before taking a road trip.
You might say:
If Highway A is clear, I can take that route.
If there is traffic, I can take Highway B.
If both roads are blocked, I have another route.
You are not predicting which road will have traffic.
You are simply making sure you know what to do before you get there.
That is what these scenarios are.
Preparation > Prediction.
Where SPY is starting
At the time of this chart, SPY is around 773–774.
HDTL is showing several important Areas of Agreement around price:
776 — major upper Projected AOA
773 — Projected AOA
771 — Projected AOA
769 — Projected AOA
~767–768 — prior-day structure
766 — Projected AOA
765 — Projected AOA / demand area
~760 — another important demand area
If you are new to HDTL, an Area of Agreement is basically an area where price has previously spent enough time doing business that I expect traders to care about it again.
Think of them like floors in a building.
Price can move from one floor to another.
Sometimes it walks right through.
Sometimes it stops.
Sometimes it gets rejected and goes back downstairs.
That is why I am much more interested in how price behaves around these levels than I am in trying to predict every candle.
What is Wall Street saying?
Interestingly, Wall Street is still broadly optimistic.
A recent Reuters survey of 46 strategists put the median year-end S&P 500 target around 7,900. J.P. Morgan recently raised its own target to 8,000, citing strong corporate earnings and continued AI-related investment.
So the professional consensus is not:
“The market is about to collapse.”
It is closer to:
“We still think the market can finish the year higher, but the path may be messy.”
That distinction matters.
A bullish year-end target does NOT mean September has to go straight up.
SPY could fall 3%, rally 5%, chop sideways for two weeks, and still finish the year higher.
This is one reason I do not build my trading around somebody else's year-end price target.
Charles Schwab recently made this exact point. Their research showed that Wall Street targets are often changed after the market moves. When prices fall, analysts lower targets. When prices recover, they raise them again.
In other words, even very smart analysts are frequently reacting to the market rather than predicting it.
So I listen to analysts.
I read their reasoning.
But I do not treat their target like a magic number.
What is the media saying?
The media has two major stories right now.
Story #1: September has a bad reputation
Historically, September has been one of the weaker months for stocks.
And because this is also a U.S. midterm-election year, some historical studies show September has tended to be even rougher than normal.
But this is where people get themselves in trouble.
“September is historically weak” does not mean:
“SPY must fall this September.”
Seasonality is a tendency.
It is not a law.
If I told you Missouri is usually cold in January, that would be useful information.
It would not tell you the exact temperature on January 17.
Same idea.
Story #2: The Fed, inflation and interest rates still matter
The market is currently trying to figure out what the Federal Reserve will do at its September 15–16 meeting.
That decision will depend heavily on economic data.
Today we get the August jobs report.
Next week we get inflation data.
PPI comes first.
Then CPI.
Those numbers can move expectations for interest rates very quickly.
Earlier this week the market was pricing a much greater chance of another rate increase.
Then Fed Governor Christopher Waller sounded more comfortable waiting if inflation continues improving, and those expectations moved back toward roughly 50/50.
This is important because interest rates affect almost everything.
Higher rates make borrowing more expensive.
They also make bonds more attractive compared with stocks.
That can pressure expensive growth stocks.
Lower or stable rates generally remove some of that pressure.
Then we have oil and geopolitics
The U.S.-Iran conflict has pushed energy prices higher and added another inflation risk.
If oil keeps rising, businesses pay more for transportation, manufacturing and energy.
Those costs can eventually make their way into inflation.
That creates a very simple chain:
Higher oil → more inflation pressure → potentially higher interest rates → tougher environment for stocks.
That is one reason I refuse to throw the Red scenario away just because the chart currently looks constructive.
Geopolitics can change the market very quickly.
What are regular investors saying?
This is where things get especially interesting.
The newest AAII sentiment survey has:
39.7% bullish
37.6% bearish
22.7% neutral
So bulls barely outnumber bears.
Bearish sentiment is also still above its long-term average.
That is not extreme excitement.
It is not extreme fear either.
It is basically:
“I think stocks may go higher.”
standing beside:
“I don't trust this market at all.”
😂
And social-media sentiment looks just as confused.
Stocktwits reported SPY sentiment still leaning bearish, while QQQ had moved back toward bullish this morning.
Again, mixed.
That matters because markets often become most interesting when price is strong but people still do not completely trust the move.
What is the options market saying?
The VIX closed Thursday around 14.32.
The VIX is often called the market's “fear gauge.”
When it gets very high, traders are paying a lot for protection against big moves.
When it is low, traders are generally expecting less near-term volatility.
At 14.32, the options market is not currently pricing panic.
So we have a strange combination:
The news sounds scary.
Oil is elevated.
Rates matter.
We have war risk.
We have a major Fed meeting coming.
September has a bad historical reputation.
But actual market volatility is still relatively calm.
That is worth paying attention to.
Now let's talk about the scenarios
🟢 GREEN — SPY proves it wants higher
The Green scenario is the straightforward bullish case.
The most important level for me is around 776.
I do NOT care if SPY simply touches 776.
I want to see acceptance above it.
What does acceptance mean?
Imagine jumping over a fence.
Touching 776 is like jumping over the fence for one second and immediately falling back.
Acceptance means:
SPY gets above the fence…
stays above the fence…
and starts walking around on the other side.
That could mean hourly closes above it, successful retests, buyers defending it and new structure forming above it.
If that happens, Green becomes much more believable.
From there, the upper 780s and eventually the area around 790 are completely reasonable possibilities during September.
But here is where I want to be very clear.
Once SPY gets above 776, HDTL currently gives me fewer established reference points.
That means the exact green dotted path becomes increasingly speculative.
So I like the Green idea.
I do not pretend I know the exact Green route.
Green gets stronger if:
776 breaks and holds.
Pullbacks become shallow.
Buyers defend reclaimed levels.
Treasury yields remain under control.
Inflation data is not hotter than expected.
Earnings and economic growth remain strong.
Green gets weaker if:
SPY repeatedly reaches 776 and gets slapped back underneath it.
🟡 YELLOW — My heaviest-weighted scenario
Yellow is still the scenario I currently like the most.
And I want to explain why, because Yellow is probably the hardest one for newer traders to understand.
Yellow does NOT mean:
“I think the market is bearish.”
It means:
“I think the market may need time to figure out what it wants to do.”
Markets do not always trend.
Sometimes buyers and sellers spend days fighting over the same territory.
That could mean SPY moves:
773 → 771 → 769 → 766
then back up again.
Maybe it tests 776.
Maybe it fails.
Maybe it pulls back into 765.
Maybe buyers show up there again.
That is what I mean by negotiation.
Imagine two people trying to agree on the price of a house.
Seller wants $400,000.
Buyer wants $370,000.
They might go:
Eventually they agree.
Markets do the same thing.
That is what these Areas of Agreement help us visualize.
And look at how much structure sits between 765 and 776.
There are multiple HDTL levels packed into a relatively small range.
That makes this an extremely logical area for price to spend time negotiating.
Why Yellow makes sense fundamentally too
Yellow also fits the current economic situation.
We have reasons to be bullish:
Corporate earnings have been strong.
Wall Street remains constructive.
AI investment remains a major growth driver.
The broader trend has been strong.
The VIX is not signaling panic.
But we also have reasons to be cautious:
September seasonality.
High Treasury yields.
Elevated oil prices.
Geopolitical risk.
Inflation uncertainty.
A Fed decision right in the middle of the month.
That's almost the definition of a rotational environment.
There is enough good news to keep buyers interested.
There is enough risk to prevent everyone from blindly chasing.
That is why Yellow remains my heaviest-weighted scenario.
🔴 RED — Something actually starts breaking
The Red scenario is not:
“I think the market crashes.”
It is:
“What happens if buyers stop defending the structure underneath us?”
The first cracks could appear around 769 and the prior-day area underneath it.
But those are not my biggest concern.
The real battlefield is around 765.
There is a cluster of HDTL structure there plus visible demand.
If SPY falls to 765 and buyers immediately step in?
Fine.
Yellow may still be alive.
If SPY drops underneath 765 and then begins staying underneath it?
Now we have a different conversation.
That would tell me the market has stopped respecting an area that previously mattered.
Then I start watching approximately 760.
If 760 fails too, the Red scenario becomes much more serious.
At that point, a move into the low 750s is not crazy.
And people sometimes hear “750” and think that means Armageddon.
It doesn't.
From the 770s, that's only a few percent lower.
Markets have ordinary corrections like that all the time.
Could Red become worse than I drew?
Absolutely.
And this is where I need to criticize my own chart.
The Red scenario I drew represents what I would call a normal bearish outcome.
It does NOT represent every possible disaster.
Imagine:
Inflation comes in much hotter than expected.
Oil explodes higher.
The Fed becomes much more aggressive.
Treasury yields surge.
The geopolitical situation gets dramatically worse.
Could SPY fall below my red dotted path?
Of course.
A scenario map is not supposed to contain every possible future.
If new information arrives, we update the map.
That is not failure.
That is trading.
And Green could surprise us too
Same thing in the other direction.
Suppose:
Jobs are fine.
Inflation cools.
The Fed holds rates.
Oil drops.
Geopolitical tensions calm down.
Corporate earnings remain excellent.
SPY could blow through 776 and move faster than my Green scenario suggests.
Again:
That would not make the chart “wrong.”
It would mean new evidence caused Green to deserve more weight.
So what are my weights?
Before today's jobs report, if you forced me to assign rough weights, I would say:
🟡 Yellow: 45%
🟢 Green: 30%
🔴 Red: 25%
These are NOT mathematical probabilities.
I did not run 100,000 simulations.
They simply describe how I currently rank the possibilities.
Yellow first.
Green second.
Red third.
And those weights can change as evidence changes.
That's important.
If today's data completely changes the environment, I am allowed to completely change my opinion.
There is no prize for being loyal to Friday's opinion on Tuesday.
What could change the entire chart?
A lot.
That is why mapping an entire month is so interesting.
Between now and the end of September we have:
Today's jobs report.
PPI inflation.
CPI inflation.
The September 15–16 Federal Reserve meeting.
Retail-sales data.
More labor data.
More inflation data later in the month.
The market will learn a lot more between now and September 30.
That means our scenarios should evolve too.
The biggest lesson in this chart
I don't actually care whether Yellow ends September looking almost exactly like the yellow dots I drew.
Seriously.
That is not how I grade this.
What I care about is whether these decision areas help us recognize when the market changes character.
For example:
If we are under 776?
Don't pretend Green has been confirmed.
If we're bouncing around 765–776?
Yellow makes sense.
If 765 breaks and sellers start controlling the area?
Red deserves more attention.
If 776 breaks and turns into support?
Green deserves more attention.
Very simple.
This is also why I prefer scenarios over analyst targets
Wall Street can say the S&P 500 will finish the year at 7,900 or 8,000.
Maybe they are right.
But that does not help me much if the market falls 5% first.
A trader has to live through the path, not just the destination.
That's what Charles Schwab's criticism of year-end targets gets right: markets change regimes, macro conditions change, forecasts get revised, and the journey can matter far more than the December closing number.
That is exactly what scenario planning is built for.
I don't need to know where SPY closes September 30.
I need to recognize what SPY is telling me along the way.
The simplest way to read this entire chart
Forget all the squiggly lines for a second.
Remember three things:
ABOVE 776
Green starts getting interesting.
Show me acceptance.
765–776
Yellow battlefield.
Expect negotiation.
BELOW 765
Red starts getting interesting.
Then 760 becomes very important.
That's it.
Everything else is detail.
Why I practice this every week
I believe one of the biggest mistakes traders make is waiting until something happens before deciding what it means.
SPY suddenly drops.
Panic.
SPY suddenly rallies.
FOMO.
SPY goes sideways.
Boredom.
Then people make emotional decisions.
Scenario planning flips that around.
I ask myself beforehand:
What if it rallies?
Okay.
What if it sells off?
Okay.
What if it does absolutely nothing?
Okay.
Now when one of those things actually happens, I have already thought about it.
That does not mean I know the future.
It means the future has fewer ways to surprise me.
And that's the entire point.
We did the same thing last Sunday.
We mapped bullish, bearish and rotational possibilities before the week started.
Yellow was my heaviest-weighted scenario.
Then the market spent the week moving through many of the exact decision areas we had already identified.
Not because we predicted the future.
Because we prepared for it.
None of what happened this week was shocking because we already said it could happen. SPY Is Holding Above The 771.43 Ceiling It Broke.SPY Is Holding Above The 771.43 Ceiling It Broke.
SPY is trading at 773.89, a second session above the level that rejected it repeatedly for two weeks, with 775.30 as the overnight high. The two timeframes do not agree: the 4H reads low-conviction long with a Q1 surface, a live CQI in the top quartile and volume at the 98th percentile, while the hourly reads Q4 short with a swept high behind it and nothing at all on the timing layer. That is price leading conviction rather than conviction confirming price, the same shape the breakout itself had. The monthly jobs report lands before the open, and structure cannot price a scheduled release. Neutral.
Resistance: 775.30 - the overnight high
Key resistance: 779.37 - the swing high above 777.62
Current price: 773.89
Support: 771.43 - the broken ceiling, now the line that has to hold
Key support: 765.52 - the old range floor
Structural floor: 759.13 - the flush low from earlier this week
Two paths from here:
It holds 771.43 and the breakout becomes structure. A decisive close above 775.30 opens 777.62 and then the 779.37 high, and each session that closes above the old ceiling turns it from a poke into a floor. For that to be more than drift the hourly surface has to firm with price instead of fading against it.
It loses 771.43 and the break was a poke. A close back below the reclaimed level puts 765.52 in play as the range floor again and resets the whole two-day round trip to chop. Below 765.52 the 759.13 low is the next reference.
The level that governed the last two weeks is now underneath price instead of above it, and today's release is what tests it. 771.43 holds and this is a breakout; 771.43 fails and it was a visit.
Built with SYNTHESIS v3.3 | SOM / ACE / IMP / SYNTHESIS
Study, not financial advice. FV: news flow leaning bullish — the net read
FV did not get one story today, it got several, and they do not all point the same way. Weighed against each other — new against old, and tracking which ones have already faded:
++ USD/JPY bounces near the major 155.00 support; pullback or the start of a rally into new highs?
+ Bibi Makes Crystal Clear That Toppling Iran Is Israel's 'Central Mission, Within Reach' (fading)
+ United States Dollar Index weakens as Fed’s Waller signals rate pause (fading)
11 stories were weighed in this window; the 3 carrying the most weight are listed.
Net read: +++ leaning bullish — top of our scale.
What this is: a measure of which way the *news* is leaning right now — not a promise about price. A read being right and a read still being worth taking are two different things: once price has travelled a long way from where the read was published, it is stretched, and a lean that is stretched is a no-chase rather than an invitation.
Weight is not fixed either. A fresh headline lands, the balance tips, and the net read can flip inside an hour — that shift is the part worth watching, not the first print.
I will post an update under this idea once the market has had time to speak, either way.
(Informational only — not financial advice, not a signal.)  Long
Long
Short 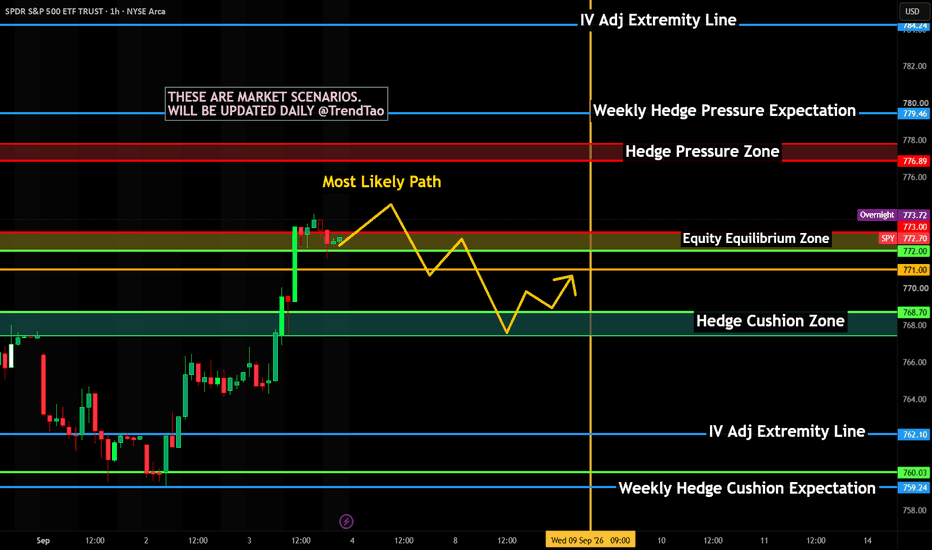
$SPY Daily Close — Sep 3Perfect trade setup over the curls.
AMEX:SPY closed 773.17, up 1.05%. The market respected the breakout and retest with a 34-50 cloud bounce (@ripster47 EMA cloud), and today price completed the 5-12 Curl (@ripster47 EMA cloud) on the daily that I've been waiting on for two sessions.
Strong candle with strong volume. Range was 6.58 against a 6.38 ATR — a full-size day, closing at the highs. Volume 41.28M against a 36.54M average, 113% relative volume, and roughly 40% above yesterday's 29.49M.
That last part is the whole point. Yesterday's green bar came on 79% volume — No Demand, sellers stepping away rather than buyers stepping in. Today the buyers actually showed up. Effort and result finally agree, and yesterday's No Demand bar is negated.
This is why the curl matters as a trigger and the candle doesn't. Two days ago the chart looked bullish and the volume said wait. Today both say the same thing.
Trigger is behind us. Structure now: hold above the 5-12 cloud (@ripster47 EMA cloud) near 766. Above that, first resistance is 775, then the prior highs at 777.50–780.
What I don't want to see: a green bar into 775 on lighter volume than today. That would be No Demand again, right into overhead supply.
Lose 766 and close back inside the cloud and the curl fails. Below that, 761.73 and the 760.57 shelf are the structural floor.
Reference 766. Target 775 then 780. Watch the volume on the approach. Long 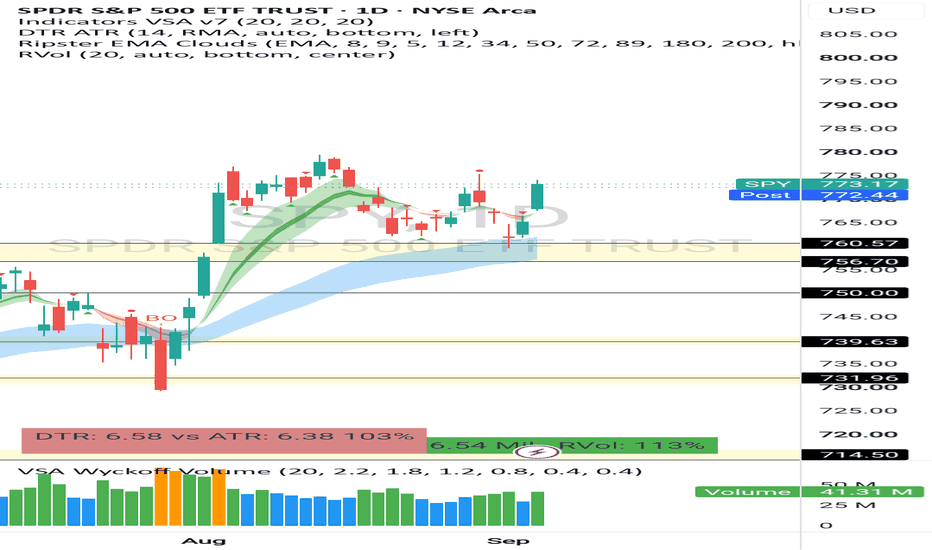
$QQQ Daily Close - Sep 3 2026NASDAQ:QQQ Daily Close — Sep 3
The trigger fired. NASDAQ:QQQ closed 717.67, up 1.19%, back above both the 5-12 and the 34-50 clouds and through the 715–717.50 shelf that had rejected every attempt since mid-August.
That's a 5-12 Curl and a 34-50 Crossed. Wide bar too — 9.22 range against a 9.77 ATR, 94% of a normal day, closing near the highs. Effort produced result.
I'm long from the curl. And I want to be straight about why I waited, because Tuesday was the test.
Tuesday's bar was green at support and it was tempting. It was also the narrowest range in weeks on the lowest volume on the chart — No Demand. Buying it would have cost 5 points of risk to make 3 before the first resistance. Waiting for 712.50 gave a tighter stop and the same target. Same trade, three points higher, and confirmed instead of hoped for.
Now the part I'm not going to skip. Volume today was 28.92M against a 30.88M average — 94% relative volume. Below average. That's the one thing this move is missing.
Yesterday I said the bull case needed a bar above 712.50 on volume above 31M. We got the bar. We didn't get the volume. Price broke a shelf where sellers had been working for two weeks, and it did it without a surge. Either that supply was already exhausted, or it's still sitting there untested.
So: setup confirmed, VSA only partly confirmed. I'm long and I'm respecting the level, not the story.
What I want tomorrow: follow-through above 717.67 with volume above 31M — or a quiet pullback that holds 712.50, which is a Test and would tell me more than another green candle.
What would concern me: a narrow up bar tomorrow on volume below today's. That's No Demand above the shelf, and those unwind fast.
712.50 is the line for the long. 715 needs to act as support now. 724.20 is the target.  Short
Short
SPY Is Retesting The 765.71 Floor From Below.SPY Is Retesting The 765.71 Floor From Below.
SPY sold down to 759 after breaking its range, tagging the level that was the breakdown target, then bounced back to 764.88 and is now retesting the 765.71 floor from underneath. The 4H is neutral and the hourly is neutral with a liquidity-sweep flag, so the down-momentum has eased even though price is still under the broken floor. That level overhead is now the whole question. Neutral.
Resistance: 765.71 - the broken floor, now the reclaim test
Key resistance: 771.58 - the old range top
Current price: 764.88
Support: 762.57 - the first shelf below
Key support: 759.13 - the breakdown target it already tagged
Structural floor: 753.22 - deeper support
Two paths from here:
It reclaims 765.71 on a close and holds. That negates the breakdown, pulls price back inside the two-week range, and turns attention back up toward 771.58. The bounce off 759 is the early attempt at this, but it needs the level back to confirm.
It rejects at 765.71 and loses 762.57 instead. That returns price to the 759.13 low it already tested, and losing that opens 753.22 beneath. Under the floor the lower path still has the edge.
765.71 is the line: back above it undoes the break, a rejection there keeps the lower path alive.
Built with SYNTHESIS v3.3 | SOM / ACE / IMP / SYNTHESIS
Study, not financial advice. Short 
Long 
Long 


