ETF market
Research 03.06.2026🌏 Markets:
AMEX:SPY −0.59 −0.08%(pre/m)
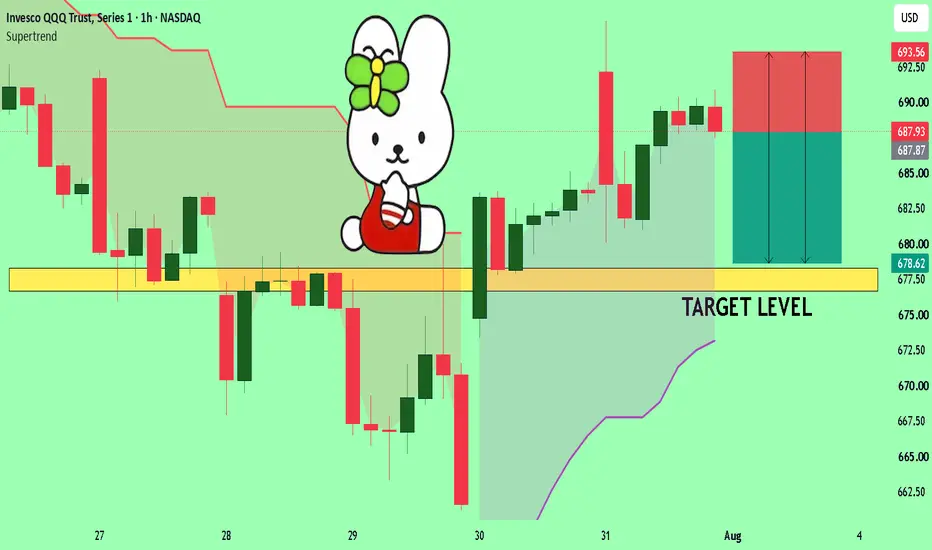
NASDAQ:QQQ +1.98 +0.27%(pre/m)
🆕 Economic News:
08:15 USA – ADP Employment Change
10:00 USA – Factory Orders
10:00 USA – ISM Services PMI
10:30 USA – EIA Crude Oil/Gasoline Stocks Change
📈 Gap Ups
Reaction to earnings/guidance:
NYSE:GME NASDAQ:OLLI NASDAQ:MMED NYSE:MDT $M
Other news:
NASDAQ:XOS on Launch of Power Systems Targeted at Data Centers
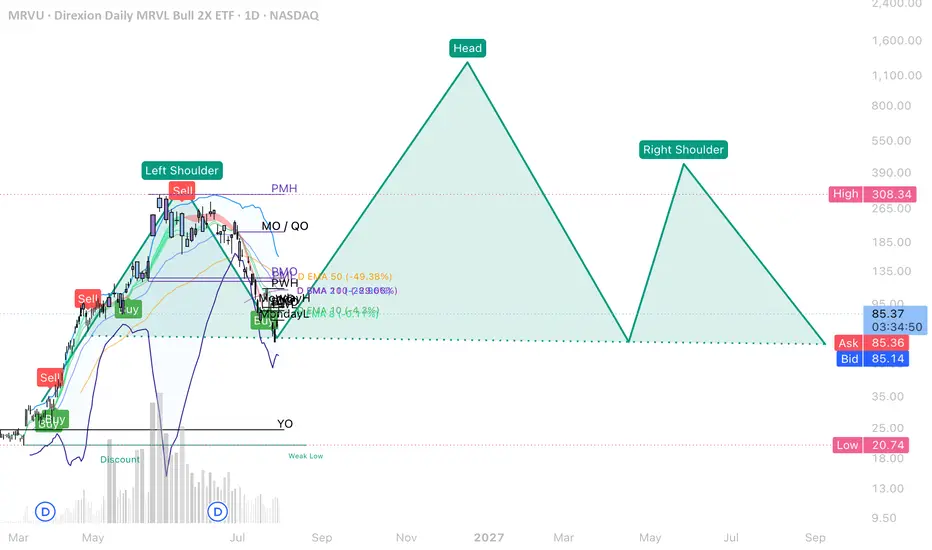
NASDAQ:MRVL NASDAQ:AMD NASDAQ:INTC rally continues
NYSE:BB CFO Stands Firm On AI Vision
NASDAQ:AXSM announced that it has resolved all patent litigation related to Axsome’s product SUNOSI (solriamfetol).
NASDAQ:IREN Announces First Australian Data Center Campus - 800MW in South Australia
NASDAQ:CIFR , NASDAQ:WULF , NASDAQ:KEEL jump as former Bitcoin miners decouple from lagging Bitcoin price
NASDAQ:SIMO : Enterprise storage expansion and MonTitan ramp to 10% revenue drive growth and margin stability
NYSE:VRT declared a quarterly cash dividend of $0.0625 per share
📉 Gap Downs
Reaction to earnings/guidance:
NASDAQ:GTLB NYSE:THO NASDAQ:PANW NASDAQ:ULTA NASDAQ:CGNT
Other news:
NASDAQ:MLYS Announces Pricing of $150 Million Underwritten Offering of Common Stock
NASDAQ:ASTS , NASDAQ:RKLB , NASDAQ:SIDU , NYSE:RDW Reverse Losses As Blue Origin CEO Vows New Glenn Return This Year
NASDAQ:CELC announced a proposed underwritten public offering of $400,000,000
NYSE:BX and NYSE:KKR slump in premarket trade as private-asset travails mount (CLIFFWATER PRIVATE CREDIT FUND STUNG BY 17% REDEMPTION REQUESTS)
Leading Bank maintains sell on NYSE:AZN as ASCO glow fails to resolve key pipeline questions
NASDAQ:GRRR Announces Pricing of $107 Million Senior Unsecured Convertible Bond Offering
‼️ Additional
Iran has not responded to the US in recent days and has paused the exchange of messages.
-- Tasnim is once again denying Trump’s statements.
SpaceX plans to create the most advanced orbital defense system for the US, hinting at major defense contracts.
The unrealized loss of Tom Lee’s BitMine NYSE:BMNR from its ETH investments has exceeded $9 billion.
Trump signed an executive order on AI oversight for national security risks less than two weeks after refusing to approve it.
Goldman sharply raised its targets for Asian equities and expects upside over the next year of 12% to 36% from current levels, referring to Japan, South Korea, and Taiwan.
The US is proposing new tariffs of at least 10% on imports from most major trading partners following an investigation into goods allegedly produced using forced labor — BBG.
🏢 IPO
NYSE:AADX – Applied Aerospace & Defense
Company provides design, engineering and vertically integrated manufacturing services for aerospace and defense customers. It builds mission-critical subsystems for space and launch systems, defense aviation, airborne systems, C5ISR and precision strike platforms. A major strength is deep customer integration: sole- or single-source positions represented about 87% of revenue in 2025.
Price: $20.00
Shares: 32.5M
Raised: $650.0M
LTM:
Revenue: $498.8M
Net Income: -$17.0M
Comparable public companies: NYSE:HWM , NYSE:TDG , NYSE:HEI , NYSE:RTX , NASDAQ:KTOS
📋 List of tickers involved:
AMEX:SPY NASDAQ:QQQ NYSE:GME NASDAQ:OLLI NASDAQ:MMED NYSE:MDT $M NASDAQ:XOS NASDAQ:MRVL NASDAQ:AMD NASDAQ:INTC NYSE:BB NASDAQ:AXSM NASDAQ:IREN NASDAQ:CIFR NASDAQ:WULF NASDAQ:KEEL NASDAQ:SIMO NYSE:VRT NASDAQ:GTLB NYSE:THO NASDAQ:PANW NASDAQ:ULTA NASDAQ:CGNT NASDAQ:MLYS NASDAQ:ASTS NASDAQ:RKLB NASDAQ:SIDU NYSE:RDW NASDAQ:CELC NYSE:BX NYSE:KKR NYSE:AZN NASDAQ:GRRR NYSE:BMNR
Best regards – hi2morrow team.
Title: TQQQ | June 3In today's review of TQQQ, I walk through how I use previous day levels, higher-timeframe analysis, and Fibonacci retracements to build a trade plan before the market opens.
The process begins by identifying the Previous Day High (PDH) and Previous Day Low (PDL), which often act as important liquidity levels throughout the trading session.
From there, I move to the higher timeframes to establish context and determine whether price is trending, consolidating, or approaching a significant level of interest. Once the broader picture is established, I use Fibonacci retracement levels to identify potential pullback areas where price may offer a higher-probability entry.
A major focus of this review is taking emotion out of the decision-making process by using probabilities rather than predictions. Instead of assuming where price will go, I build a case using confluence and ask what price is most likely to do based on the information available.
Key topics covered:
• Previous Day High (PDH) and Previous Day Low (PDL)
• Higher-timeframe market context
• Fibonacci retracement pullback zones
• Building confluence through multiple factors
• Using probabilities to create objective trade plans
The goal is not to predict the market, but to develop a structured framework for understanding price behavior and making more informed trading decisions.
As always, the focus remains on confirmation over prediction.
Rally intraday bounce setup as traders watch supportCurrent Price: 36.91
Direction: LONG
Confidence level: 42%(Professional trader snippets describe a corrective wave structure within a strong broader market. With limited sentiment data and mismatched long-term levels, the decision leans toward a modest intraday bounce from support.)
Targets
Target 1: 37.30
Target 2: 37.75
Stop Levels
Stop 1: 36.40
Stop 2: 35.90
Wisdom of Professional Traders:
This analysis synthesizes insights from thousands of professional traders and market experts, combining what traders are saying to identify good setups in Rally. The collective wisdom of traders helps filter out individual bias and highlight where the market may move during TODAY’s session.
Key Insights:
Here’s what stands out in the trader discussions. Several professional traders described the recent move from the late‑May low as a three‑wave advance. In Elliott Wave terms, that often signals a corrective phase before the next impulse higher. When traders see that structure, they frequently watch for a temporary dip followed by a continuation move.
What’s interesting is that the same traders also emphasized that broader equity momentum remains strong. Even though they expect corrective behavior inside the structure, the underlying trend environment is still supportive. For TODAY’s session, that combination often produces intraday dips that buyers step into quickly.
The price levels mentioned by traders were far above the current market price (support around $73–$75 and resistance near $78.59–$86). Because those levels clearly belong to a different timeframe or broader chart context, they aren’t useful for TODAY’s intraday trade. Instead, I’m focusing on a tight 1–2% bounce range around the current price.
Recent Performance:
Rally is currently trading at $36.91. The stock has been moving in a relatively tight intraday range lately, which fits the corrective structure several traders described. That kind of consolidation often leads to short bursts of momentum during the trading session, especially when buyers defend intraday support.
Expert Analysis:
Looking deeper into the trader commentary, several professional traders pointed out that the recent price action doesn’t yet show a clean three‑wave decline into support. That matters because traders often wait for that pattern before aggressively buying.
Even so, the broader takeaway from the trader analysis is that markets remain strong overall. When you combine that strength with a corrective wave structure, the typical pattern during TODAY’s session is a modest bounce rather than a sharp breakdown.
News Impact:
There isn’t any major Rally‑specific news driving price today. Most of the discussion among traders is centered on overall equity strength, especially flows into technology and AI‑related sectors. That broader risk‑on tone can help support smaller intraday bounces in individual equities during TODAY’s session.
Trading Recommendation:
Here’s my take for TODAY only: I’m looking for a controlled intraday bounce from the current $36.91 level. The plan would be a LONG position targeting $37.30 first, with a stretch toward $37.75 if momentum builds during the session. Risk management matters here because the signal quality is limited, so stops at $36.40 and $35.90 keep downside contained if sellers step in.
Position sizing should stay moderate due to the lower confidence level and limited sentiment data. The setup is essentially a tactical intraday bounce trade rather than a strong directional conviction.
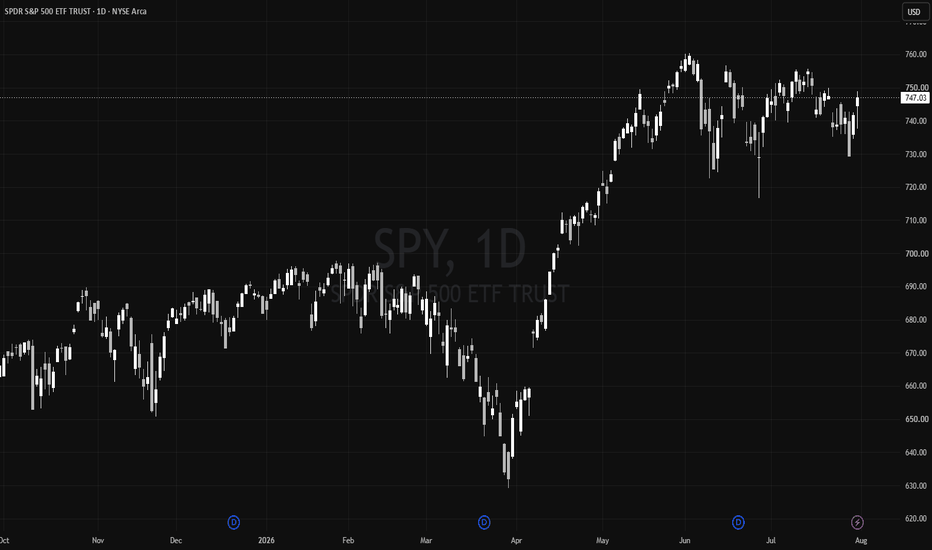
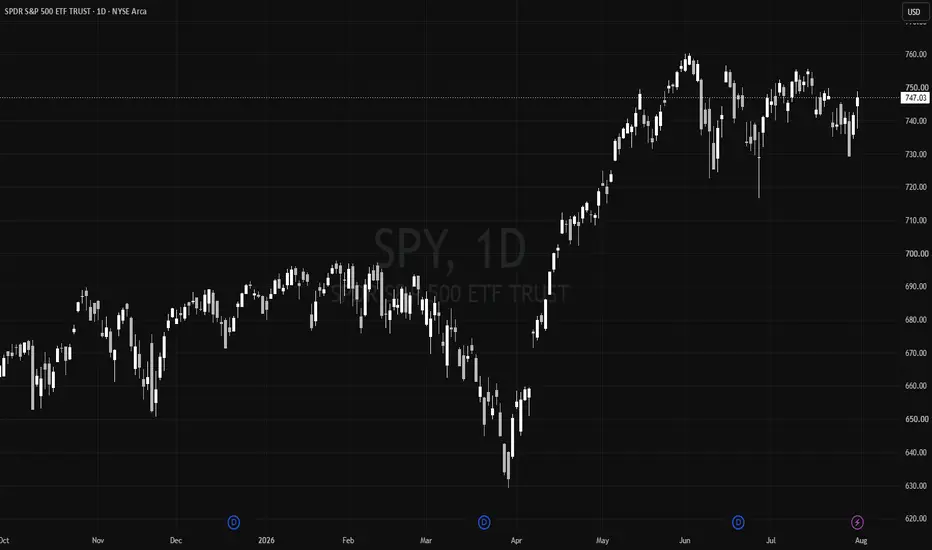
SPY - Daily FORMING again. Last Ann 202 bars ago. Still green.Daily FORMING again. Last Ann 202 bars ago. Still green.
Two things worth noting on SPY
this morning that the v3.2 dashboard
makes visible for the first time.
First - the Last Ann row.
The last SOM announcement on the
daily was 202 bars ago. Bull
direction. CQI 70.2 at announcement.
It's showing green - meaning the
direction of that announcement
still aligns with the current
signal direction.
202 bars is a long time. The
structural event that anchors
the current read is months old.
The suite flags it - but green
means the bias hasn't flipped.
Second - the Phase row.
NEUTRAL on both timeframes.
No ACCEL, no COAST, no BRAKE.
The market is digesting. The
institutional window hasn't
activated a new move.
The daily FORMING is clean -
no anti, PART mode, Open Hour
firing, CQI 74.5 Q1. Cleanest
daily setup this week for the
second consecutive day.
But OBSERVING on SOM. Zero
announced zones. The structural
anchor from 202 bars ago is the
last thing the engine confirmed.
The setup is assembled. The
structure hasn't arrived yet.
WAIT for SOM to announce.
---
SYNTHESIS v3.2 - SPY 1H + Daily
SOM + ACE + IMP + SYNTHESIS
Not financial advice.
Past signals do not guarantee
future results.
USO ETF Mirroring Crude Weakness Potential for Today’s SessionCurrent Price: 137.27
Direction: SHORT
Confidence level: 85%(Trader consensus remains unified across group metrics.)
Targets
Target 1: 136.40
Target 2: 135.60
Stop Levels
Stop 1: 138.10
Stop 2: 138.90
Wisdom of Professional Traders:
When I combine the signals across this crude oil group, the balance of evidence points slightly bearish for TODAY’s intraday session. The interesting part is the disagreement in the data: several YouTube traders are leaning bullish on crude futures themselves, while USO-related commentary from professional traders has been more cautious to bearish. At the same time, X (Twitter) sentiment is largely neutral, which usually means momentum traders are not strongly pushing price higher.
When I see that combination—divided professional opinions and weak social momentum—it often leads to intraday fade trades rather than strong breakouts. In other words, rallies tend to get sold during the session. For TODAY only, I’m treating the recent strength in crude as vulnerable to a small pullback rather than expecting continuation higher.
The real story here is positioning. Energy traders discussing crude on YouTube appear structurally bullish longer-term, but that doesn't automatically translate into intraday upside. With X sentiment not confirming bullish momentum and no strong catalyst appearing in the data feed, the cleaner trade setup for TODAY’s session is leaning SHORT across both CL=F and USO, targeting modest intraday pullbacks while keeping tight risk controls.
So the unified approach for this asset group today is fading strength in crude-related instruments with tight stops just above current price levels.
Key Insights:
USO is currently trading at $137.27, and its structure closely tracks the intraday behavior of WTI crude futures. Since the broader oil complex is showing mixed sentiment and limited bullish momentum on X, the ETF looks vulnerable to a small pullback during TODAY’s session.
What’s interesting is that ETF traders often react slightly faster than futures traders when sentiment cools. That can lead to gradual selling pressure throughout the day rather than a sharp drop. For TODAY only, the most likely scenario appears to be a slow drift toward lower intraday support zones.
Another key factor is correlation. When crude futures stall near resistance—as they appear to be doing today—USO typically mirrors that pause with a mild retracement. That reinforces the SHORT bias for the intraday window we’re analyzing.
Recent Performance:
USO has moved steadily higher alongside crude in recent sessions, but the momentum has flattened. Price is now sitting near an upper short-term range where traders often start taking profits. During TODAY’s session, that positioning could translate into mild downside pressure.
Expert Analysis:
Professional trader commentary tied to USO is more cautious compared to crude futures discussions. Several traders highlighted that energy ETFs can lag or retrace when the underlying commodity pauses.
Since X sentiment is not aggressively bullish and tweet volume doesn’t show strong momentum chasing, the collective signal suggests traders are not eager to push USO higher TODAY. That aligns with the short-side intraday setup.
News Impact:
The absence of strong oil-related headlines means price action is likely to be driven by technical flows rather than new macro information. In those environments, energy ETFs like USO often experience modest pullbacks if crude stalls. For TODAY only, that dynamic favors the downside.
Trading Recommendation:
For TODAY’s session, the cleaner setup is a SHORT bias on USO, targeting a controlled intraday pullback while protecting the trade with tight stops above resistance.
Algorand intraday weakness as altcoin pressure buildsCurrent Price: 0.11
Direction: SHORT
Confidence level: 38%(Professional trader snippets consistently warn about altcoin weakness, bear flag risk, and crypto market corrections. There is no direct bullish trader commentary on Algorand. However, the absence of specific intraday levels lowers confidence.)
Targets
Target 1: 0.109
Target 2: 0.1078
Stop Levels
Stop 1: 0.1125
Stop 2: 0.1140
Wisdom of Professional Traders:
This analysis pulls together the collective thinking of many professional traders discussing crypto markets. When you combine trader commentary across multiple discussions, patterns start to appear. Even when Algorand itself isn't heavily discussed, the broader altcoin context often guides intraday direction. The wisdom of professional traders right now points to caution across smaller altcoins, which is why today's bias leans short.
Key Insights:
Here's what's driving today's trade idea. Several traders highlighted that the altcoin market is currently dealing with a bearish technical structure. One discussion pointed out a potential bear flag forming across the altcoin sector. When traders talk about patterns like that, it usually means downside continuation risk if support levels break during the session.
Another factor that stood out is how sensitive altcoins remain to Bitcoin movement. Multiple traders referenced key Bitcoin levels like the $64k region acting as a directional trigger for the whole market. When Bitcoin shows volatility, smaller assets like Algorand tend to amplify those moves. For today's session, that means traders are cautious about upside follow‑through.
There's also a liquidity story here. Several traders mentioned capital rotation toward AI and technology equities. When speculative capital flows into another sector, altcoins often lose momentum intraday. That dynamic doesn't necessarily destroy the long‑term thesis for Algorand, but for today's session it can keep pressure on price.
Recent Performance:
Algorand has been hovering around the $0.11 zone recently and hasn't shown strong momentum compared with larger cryptocurrencies. The price action looks sluggish and reactive rather than leading the market. During broader crypto pullbacks, ALGO tends to drift lower faster than majors like Bitcoin or Ethereum, which reinforces the short‑biased intraday setup.
Expert Analysis:
Several professional traders focused on macro crypto structure rather than ALGO specifically, but the message was consistent: altcoins are vulnerable during correction phases. A few traders warned that if the current bearish pattern across altcoins confirms, many smaller tokens could experience quick downside spikes during trading sessions.
What caught my attention is the repeated emphasis on leverage pressure and unresolved crypto market overhangs. Traders pointed out that these factors can trigger sudden liquidity events. When that happens, lower‑cap assets like Algorand are usually among the first to drop intraday.
News Impact:
There isn't major Algorand‑specific news driving today's move. Instead, the story is broader crypto sentiment. Discussions around market leverage, Bitcoin volatility, and capital rotating into AI equities all contribute to a weaker speculative environment today. Without a catalyst to attract buyers, Algorand may struggle to attract strong bids during today's trading session.
Trading Recommendation:
Putting it all together, I'm leaning SHORT on Algorand for today's session. The trader discussions point to weakness across altcoins, and ALGO hasn't shown independent strength to counter that trend. My approach would be a short bias around $0.11 targeting $0.109 first and $0.1078 if selling accelerates. Risk management matters here because crypto can move fast, so stops sit at $0.1125 and $0.114. Confidence isn't high because direct trader commentary on ALGO is limited, but the broader altcoin pressure gives this short setup a reasonable edge for today.
XLE/SPY at Major Support: Base Building for the Next Leg Higher?The Energy sector relative strength chart (XLE/SPY) is once again testing a major support zone that has held multiple times over the past year.
After a strong rally earlier this year, relative performance pulled back sharply and is now approaching a key area where buyers previously stepped in.
What makes this level interesting:
• Multiple historical reactions around the same support zone
• Relative strength remains above long-term lows
• Potential base-building structure after a corrective phase
• Risk/reward becomes more attractive near support than after an extended rally
The key question is simple:
Is Energy quietly consolidating before the next relative-strength breakout, or is this support finally ready to fail?
For now, I'm watching price behavior around this zone rather than predicting the outcome. Confirmation always comes first.
Educational market analysis only. Not financial advice.
June 9–11 This is my own trading journal, shared publicly. It is not investment advice. I’m not a financial advisor, these are the levels and rules I use for my own decisions, and trading carries substantial risk of loss. Confirm everything on a closing basis and never risk more than you can afford to lose.
SPY June 3: Bulls Defend 756Bulls Defend 756, But 760 Remains the Key Battleground
SPY enters June 3 trapped inside a tight range after buyers stepped in aggressively near support late in the session. The sharp rejection from the 757 area shows dip buyers are still active, but price remains pinned below major resistance near 760.
The overall structure remains neutral-to-bullish as long as SPY holds above the 756 HVL support zone. However, bulls have repeatedly failed to push through 760, creating a clear decision area for the next trading session.
A breakout above 760 would likely trigger momentum buying and force dealers to hedge higher. Failure to reclaim 760 could keep SPY stuck in a range or open the door for another test of support.
Key Levels to Watch
Support
756 (HVL)
754
752
750
Resistance
760
762
763
764
Bullish Scenario
The late-session bounce suggests buyers are defending the HVL near 756. If SPY opens above support and breaks through 760, the next upside targets become 762 and 764.
A clean move above 760 would likely confirm buyers remain in control and could trigger a continuation toward new highs.
Bullish Targets
760
762
764
Bearish Scenario
If SPY loses 756 support, the dealer positioning shifts less favorable and downside targets near 754 and 752 come into focus. A break below 752 would likely attract additional selling pressure toward 750.
Bearish Targets
754
752
750
Options & GEX Positioning
The options map remains extremely important heading into June 3.
HVL support sits near 756.
Major dealer resistance remains near 760.
Additional call resistance is stacked at 762-764.
Put support begins to weaken below 756.
Current positioning suggests dealers prefer price remaining inside the 756-760 range.
This creates a classic compression setup where the first break outside the range could generate an accelerated move.
Outlook for June 3
SPY finished the session showing resilience after rejecting lower prices, but bulls still need to reclaim 760 before a larger breakout can occur.
Above 760, momentum favors a push toward 762-764.
Below 756, bears gain control and a move toward 754-752 becomes increasingly likely.
For June 3, watch the battle between 756 support and 760 resistance. The winner of that battle will likely determine the next directional move.
ProShares Short Bitcoin ETF BULLISH Cup & Handle Pattern Ok apologies for not watching this on a regular basis, however, non-the-less the correction ended and the "potential" pattern appears to have resumed according to my prior call. Green horizontal dashed line has been drawn in regards to the potential target based upon my humble opinion! Wishing you all nothing less than the very best!
Out Early (and no, I'm not bearish)EURONEXT:VWRL — Why I sold at the top of the channel
I didn't sell because I think the market drops.
I sold because the asymmetry was gone.
What I see:
— Long-term uptrend channel, still intact
— Price pinned to the upper edge
— Last leg almost vertical
— Way above the long-term average
I never ask "can it go higher?"
I ask "is the risk/reward still worth it?"
Upside from here → maybe +5–10%
Downside → a pullback to the channel mid or the 200, a totally normal correction.
Small reward, big risk. That's where I get uncomfortable.
This wasn't a broken trend — it was a trade: I give up the last bit of upside to get rid of a lot of uncertainty.
Most people ask "how much more could I make?"
I ask "how much risk am I taking for that last scrap of return?"
I don't need to own the final candle. Thanks for the gains. 🙏
Not financial advice — just my own process.
#VWRL #RiskManagement #SwingTrading #Asymmetry #CapitalProtection
IGV: The Software Spring is Coiling | Targets $103–$106💻 💻 💻
The Technical Thesis: The iH&S Breakout
The IGV chart is showing a textbook transition from a "distribution" phase into a fresh "accumulation" cycle.
The Pattern: We have a clearly defined Inverse Head & Shoulders. The "Head" bottomed out near $74 in April, and the "Right Shoulder" has just completed its consolidation above the $88 neckline.
The Breakout: As of the May 8 close, IGV is trading at $91.11, having successfully cleared the neckline.
Price Targets: * Linear Tgt $103.25)
Log Tgt $106.11
The Fundamental "Engine": AI Monetisation
The software sector is moving from "AI Hype" to "AI Revenue." The heavy hitters inside this ETF are the primary beneficiaries of this shift:
The Titans: IGV is anchored by Microsoft (8.8%), Oracle (8.6%), and Salesforce (6.7%). These companies are now reporting tangible margin expansion from integrated AI agents.
The Momentum Play: Palantir (PLTR), now an 8% weight in the fund, is the "X-factor" driving the recent 5.2% weekly pop in the ETF as commercial customer acquisition accelerates.
Sector Health: With an expense ratio of 0.39%, IGV remains the cleanest way to play a diversified software recovery without the single-stock risk of an individual earnings miss.
Quant Note: IGV currently holds a 7/10 "Buy" rating from major AI models, with an 80.7% historical win rate for positive performance three months after this specific chart pattern confirms.
BTC (#Bitcoin): The "Risk-Extension" Play
As of May 2026, the "four-year cycle" theory could have largely dissolved, replaced by a strong 0.73 correlation between BTC and the IGV Software ETF.
The Component Heatmap
#MSFT #ORCL #PLTR #CRM #PANW #ADBE #SNOW #WDAY #INTU #NOW
#IGV #SoftwareStocks #TechInvesting #InverseHeadAndShoulders #StockMarket2026 #ETFs #TradingView #Nasdaq #AIRevolution
Research 02.06.2026🌏 Markets:
AMEX:SPY −1.19 −0.16%(pre/m)
NASDAQ:QQQ −0.57 −0.08%(pre/m)
🆕 Economic News:
10:00 USA – JOLTs Job Openings/Quits
16:30 USA – API Crude Oil Stock Change
📈 Gap Ups
Reaction to earnings/guidance:
NYSE:HPE NYSE:VSXY NYSE:SIG NYSE:DG NYSE:GMRS NYSE:DCI
Other news:
NASDAQ:MRVL surges after Nvidia's Huang calls it 'next trillion-dollar company
NASDAQ:SMCI NYSE:DELL grows following NYSE:HPE report.
NYSE:STM Raises Data Centre Revenue Forecast to $1 Billion as AI Demand Accelerates
NASDAQ:CAMT RECEIVES OVER $105 MILLION MULTI-SYSTEM ORDERS FROM A TIER-1 OSAT AND A LEADING HBM MANUFACTURER
NYSE:XPEV NYSE:NIO NASDAQ:LI Stocks Soar on Sign China’s EV Sales Are Bouncing Back
Manulife Hong Kong has entered into a strategic cooperation agreement with Alibaba Cloud NYSE:BABA for more active development of AI .
NASDAQ:NBIS Initiated at Neutral by BNP Paribas / Price Target Announced at $255.00/Share. Recently NVDA SEO Huang said “We worked with Nebius, and they are growing incredibly fast,”.
NASDAQ:CRWV Initiated at Outperform by BNP Paribas / Price Target Announced at $192.00/Share
NYSE:VRT Introduces First Converged Physical Infrastructure Digital Twin for NVIDIA Omniverse DSX
📉 Gap Downs
Reaction to earnings/guidance:
NASDAQ:CRDO
Other news:
NASDAQ:GOOGL unveiled plans to raise $80 billion in equity, a massive fundraise aimed at accelerating its AI infrastructure buildout. NASDAQ:AVGO is a main beneficiar.
NASDAQ:ABVX : experimental ulcerative colitis pill posted stronger-than-expected late-stage trial results, but the headline numbers were overshadowed as the data flagged rare malignancy events.
NASDAQ:PRAX reported that its vormatrigine candidate failed to reduce the monthly frequency of focal onset seizures in certain patients in a trial, prompting a pause in enrollment of a second registrational study.
NASDAQ:XMTR offering of 2,647,059 shares for total gross proceeds of approximately $225.0 million.
NYSE:NU : BofA Sees Trouble Ahead As Key Executive Hands Over The Reins
Goldman Sachs Downgrades NASDAQ:INTU to Sell from Neutral as AI Tax Rivals Intensify Competitive Pressure and sharply reduced its 12-month price target to $276 from $519
All software stocks are falling after INTU's downgrade: NASDAQ:TEAM NYSE:HUBS NYSE:RBRK NASDAQ:DDOG NYSE:FIG NYSE:ORCL NASDAQ:GTLB NASDAQ:OKTA NYSE:NOW
NYSE:SNOW Director Sold Shares Worth Over $25M
NYSE:IBM has announced plans to invest more than $10 billion in quantum computing over the next five years.
NASDAQ:ASTC pump and dump due to SpaceX IPO. (aerospace stock)
‼️ Additional
EU lawmakers are preparing the trade deal with the US for final approval by July 4 — BBG.
Gold has started replacing US Treasuries as the world’s main reserve asset, according to the ECB.
The Senate will resume work on June 3 to continue negotiations on the CLARITY Act.
-- Lawmakers plan to pass a comprehensive cryptocurrency legislation package by August 2026.
Annual spending on data center construction in the US has exceeded $50 billion, which is already comparable to government spending on transportation infrastructure — BBG.
The Trump administration is proposing 25% tariffs on Brazilian goods over unfair trade practices.
📋 List of tickers involved:
NYSE:HPE NYSE:VSXY NYSE:SIG NYSE:DG NYSE:GMRS NYSE:DCI NASDAQ:MRVL NASDAQ:NVDA NASDAQ:SMCI NYSE:DELL NYSE:STM NASDAQ:CAMT NYSE:XPEV NYSE:NIO NASDAQ:LI NYSE:BABA NASDAQ:NBIS NASDAQ:CRWV NYSE:VRT NASDAQ:CRDO NASDAQ:GOOGL NASDAQ:AVGO NASDAQ:ABVX NASDAQ:PRAX NASDAQ:XMTR NYSE:NU NASDAQ:INTU NASDAQ:TEAM NYSE:HUBS NYSE:RBRK NASDAQ:DDOG NYSE:FIG NYSE:ORCL NASDAQ:GTLB NASDAQ:OKTA NYSE:NOW NYSE:SNOW NYSE:IBM NASDAQ:ASTC AMEX:GLD CRYPTOCAP:BTC NASDAQ:COIN NASDAQ:MSTR NYSE:CRCL
Best regards – hi2morrow team.
SPY - New high $760.31. EXT on 1H. Daily FORMING - no anti.New high $760.31. EXT on 1H. Daily FORMING - no anti.
SPY broke to another new high
this morning. $760.31.
The 1H responded with EXT MODE -
ATR expanded to the 95th percentile
on the move. The extension sub-system
is flagging the new high as an
extended move.
---
The daily tells a different story.
FORMING signal. PART mode. No anti.
Open Hour firing. ATR at the 8th
percentile on the daily - extreme
compression after the 1H extension.
For the first time in this analysis,
the daily setup qualifies without
NR7 blocking it. The gate is open.
The conditions are clean.
CQI 67.8, Q1. T=2 score. Direction
Q1 LONG.
---
The tension:
1H says the move to new highs is
extended - EXT MODE, ATR 95th pct,
reversal tendency per doctrine.
Daily says the setup is the cleanest
it's been - FORMING, PART mode,
no blockers, Q1 conviction.
Same instrument. Same morning.
The 1H is warning about the move.
The daily is ready to fire.
---
OBSERVING on SOM - zero announced
zones at $760. 38 primary zones
in the pool. The structure hasn't
confirmed the new high.
Last Ann Budget Line at $758.18
is directly below current price.
SPY is above its own structural target.
---
The daily FORMING without NR7 is
the most constructive setup SPY
has shown in this sequence.
Watch the open hour.
If the 1H EXT fades and PART
mode holds on the daily - that's
the bar.
---
SYNTHESIS v3.1 - SPY 1H + Daily
SOM + ACE + IMP + SYNTHESIS
Not financial advice.
Past signals do not guarantee
future results.
Title: TQQQ | June 2In today's review of TQQQ, I walk through how I use previous day levels, higher-timeframe analysis, and Fibonacci retracements to build a trade plan before the market opens.
The process begins by identifying the Previous Day High (PDH) and Previous Day Low (PDL), which often act as important liquidity levels throughout the trading session.
From there, I move to the higher timeframes to establish context and determine whether price is trending, consolidating, or approaching a significant level of interest. Once the broader picture is established, I use Fibonacci retracement levels to identify potential pullback areas where price may offer a higher-probability entry.
A major focus of this review is taking emotion out of the decision-making process by using probabilities rather than predictions. Instead of assuming where price will go, I build a case using confluence and ask what price is most likely to do based on the information available.
Key topics covered:
• Previous Day High (PDH) and Previous Day Low (PDL)
• Higher-timeframe market context
• Fibonacci retracement pullback zones
• Building confluence through multiple factors
• Using probabilities to create objective trade plans
The goal is not to predict the market, but to develop a structured framework for understanding price behavior and making more informed trading decisions.
As always, the focus remains on confirmation over prediction.
XLV Facing Overhead Supply – Short Setup Below $150Current Price: 149.47 (Analysis was generated on Monday Morning)
Direction: SHORT
Confidence level: 42%(Professional traders highlight weak relative strength and overhead supply despite some bullish rotation narratives. X sentiment leans bullish but tweet volume is low, creating mixed signals and lowering conviction.)
Targets
Target 1: 147.00
Target 2: 145.00
Stop Levels
Stop 1: 151.50
Stop 2: 153.00
Key Insights:
Here's what's driving this setup. Several professional traders analyzing sector rotation pointed out that healthcare has started to “pick up a little,” but the move is messy and running into heavy overhead supply. In plain terms: buyers are trying to push higher, but there's a lot of trapped sellers waiting above current levels.
What's interesting is the relative strength charts traders are watching. Multiple traders noted that XLV’s ratio trends versus other sectors remain in downtrends. That means capital is still flowing more aggressively into stronger sectors like technology and semiconductors. When a sector shows weak relative momentum, rallies often fade unless a strong catalyst appears.
At the same time, some traders mentioned a longer‑term bullish trigger: healthcare breaking to all‑time highs would confirm broader market strength. But we're clearly not there yet. Until that breakout actually happens, the path of least resistance in the short term looks like consolidation or pullback.
Recent Performance:
XLV closed at $149.47 after slipping about 0.93% in the latest session. Over the past few weeks the ETF pushed into the $150–$151 area several times but struggled to hold above it. Price action has basically been a series of rallies into resistance followed by quick fades, which is exactly what traders mean when they talk about overhead supply.
You can also see this in recent price history: late‑May highs pushed near $151 before sellers stepped back in. That makes the $150–$152 area the zone traders are watching closely this week.
Expert Analysis:
Traders focusing on sector leadership made an important point: healthcare hasn't regained leadership yet. Several professional traders highlighted that the bounce in XLV lacks strong follow‑through, and bears still control the relative performance charts.
The real story here is market rotation. The broader rally has been led by tech and semiconductors, and traders say healthcare needs a strong breakout to attract capital again. Without that catalyst, many short‑term traders are fading rallies into resistance rather than chasing them higher.
This is why the $150–$152 region matters so much. If XLV keeps failing there, short‑term sellers will likely press the trade looking for a move back into the mid‑$140s.
News Impact:
Healthcare fundamentals remain stable, but the sector hasn’t been the market’s main focus recently. Some large pharma names are performing unevenly, and analysts note that certain healthcare stocks are outperforming the ETF itself. Meanwhile macro data showing slower GDP growth has kept investors cautious about defensive sector rotations.
There is a longer‑term projection suggesting XLV could reach around $160 over the next year, but that’s not the time horizon traders are focused on right now. For this week, the market is reacting more to sector rotation and technical resistance than long‑term forecasts.
Trading Recommendation:
Putting it all together, I’m leaning SHORT on XLV for the week. The collective wisdom of professional traders points to overhead supply near $150+, weak relative strength versus stronger sectors, and rallies that keep stalling.
My approach would be fading strength below $150 with downside targets at $147 and $145. Risk management matters here because the setup isn’t high‑conviction; if buyers push XLV above $151.50, momentum could shift quickly toward $153 and invalidate the trade.
Position sizing should stay moderate given the mixed signals between trader commentary and social sentiment. If healthcare finally breaks above resistance, this setup flips fast. But until that happens, fading rallies still looks like the cleaner short‑term play.