Long
Long
 Long
Long
Technical Analysis – EWYEWY is showing signs of a constructive trend reversal after correcting from its June highs. The recent decline unfolded within a descending channel, while the broader primary uptrend remained intact as price continued to respect its long-term ascending trendline.
Over the past few sessions, EWY has broken above the descending trendline, signaling that the corrective phase may have ended and that buyers are beginning to regain control. The strong bullish candle accompanying the breakout increases the probability that this move represents a genuine shift in momentum rather than a temporary overshoot.
From a momentum perspective, RSI has also broken its multi-week downtrend line and is recovering toward the neutral zone, a classic early indication that bullish momentum is rebuilding. This positive divergence between price structure and momentum strengthens the breakout thesis.
If the breakout is confirmed with sustained closes above the recent resistance area around $170–$172, the ETF could target a retest of the previous highs near $200, with additional upside potential toward the $220 region based on the broader uptrend.
Structural Context
Beyond the technical setup, South Korean equities continue to benefit from improving sentiment around the AI semiconductor cycle. As the home market of global technology leaders such as Samsung Electronics and SK Hynix, the ETF is well positioned to benefit from sustained demand for advanced memory chips, AI infrastructure, and high-performance computing.
Conclusion, the combination of:
A breakout from the corrective downtrend,
A successful retest of the long-term rising trendline,
Improving RSI momentum,
And favorable semiconductor fundamentals,
suggests that EWY may be entering the next leg of its primary uptrend. As long as price remains above the breakout zone, the technical bias continues to favor a bullish continuation scenario.  Long
Long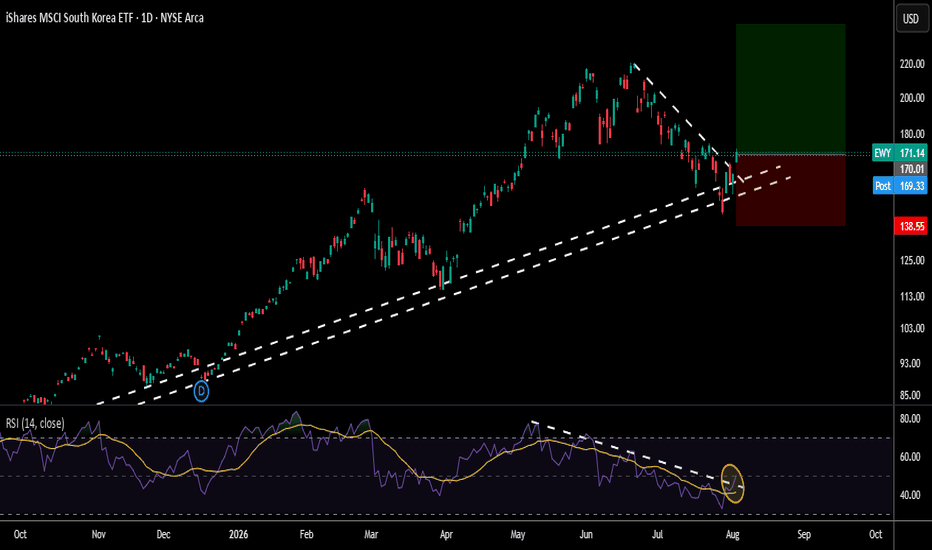
 Short
Short
QQQ Weekly Top: Is This Jan 2022 Again?Everyone's reading this week's drop in QQQ as a dip to buy in a strong uptrend. Here's what that read misses: the weekly signal already flipped down, price closed under the level it had been defending, and the whole structure rhymes with the January 2022 top.
QQQ printed a -4.16% weekly bar and closed at 695.33, back under the 1st Warsh FOMC key level at 731.62. That level is the median of the price range around a wrecking-ball new Fed chair's first FOMC, so it bakes in the whole event: the expectations going in, the reaction on the day, and the digested read once analysts and real flows had weighed in. It is where the positioning of everyone trading that regime reset settled, which is why the tape keeps defending it. Losing it on the weekly close is the tell. From here the weekly signal projects a sequence of targets stepping lower: 665.25, then 609.61, 558.37, 511.44 and 468.45. This is not happening in isolation. SPY closed the same week under its own Warsh line at 745.41, so the Nasdaq is leading the whole complex down as the AI-capex trade re-rates.
The path from here is two-sided. As long as QQQ holds under 731.62, the targets stay live and the January 2022 analog is the roadmap into the fall, first stop 665.25. The way this call is wrong is simple: a weekly close back above 731.62 reclaims the level and puts the buyable-dip read back on the table.
The weekly signal already turned. 731.62 is the number that proves it wrong.
Cheers,
Ivan Labrie. Short 
 Long
Long

Long 
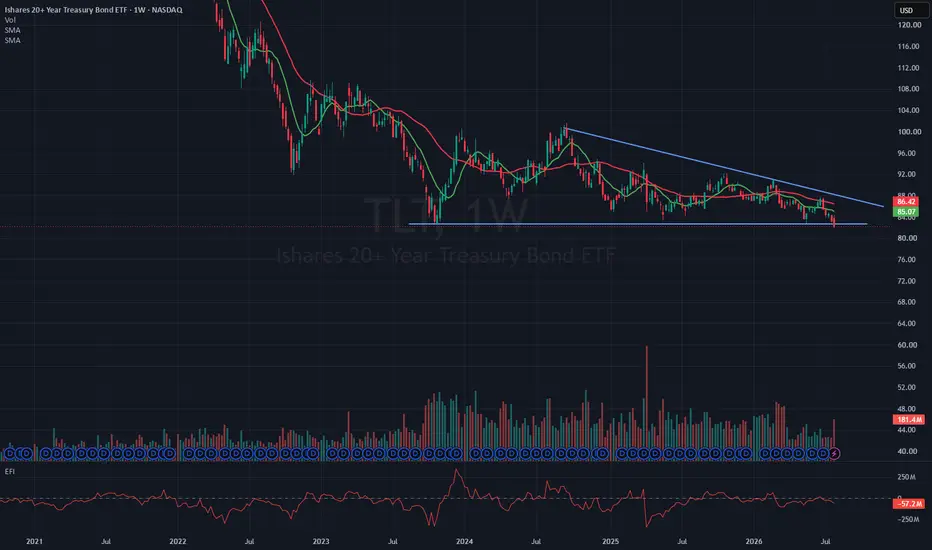
$TLT VCP BaseTLT is an ETF that tracks 20+ year Treasury bonds. When its price falls, interest rates are generally rising. Last Friday, TLT undercut its October 2023 lows.
If you expect rates to keep rising, you would likely expect TLT to continue declining. If you believe rates are near a peak, you would look for TLT to reclaim the October 2023 undercut and eventually move above the VCP wedging pattern.
This has been a very long basing pattern, lasting more than two and three-quarter years. I expect it to eventually reclaim the lower baseline and break out of the wedge, though I do not know when. I have set an alert on the lower trendline, and if it triggers, I will trade it as an undercut-and-rally setup.
Keep in mind that if the Fed raises rates, TLT will likely continue trading lower. However, the market sets longer-term rates, not the Fed, even though the Fed heavily influences the bond market.
From a longer-term perspective, I do not see long rates continuing much higher from current levels. That said, this is only my opinion, and the market does not care what I think.
As always, if this idea provides value, make it your own and trade or invest according to your own rules. After all, it is your capital at risk.
Long 
 Long
Long
SPY TRADE IDEA AUG 4,2026 BRADROC TRADING LLC SPY Trade Idea – August 4, 2026
Here's what I'm watching today...
SPY is sitting at all-time highs, and I think she still has room to climb if buyers stay in control.
At the opening bell, mark off the pre-market high and pay close attention to volume. If buyers can push through that level and hold, I'll be watching for a move to 764–765 possible move to 766.25
PUT IDEA
If SPY falls back below 758, I wouldn't be surprised to see her trade sideways between 758 and 757 while buyers and sellers battle for control: sellers can break below 757 and stay in control, I'll be watching for a possible move back to: 749, 748.75
let price confirm the move before jumping in. Based on the time you have on your contract, don't be afraid to take profits along the way.
Quick Reference
CALL
Watch: Break & hold above the pre-market high
TP1: 764.00
TP2: 765.00
TP3: 766.25
RANGE: 757.00 – 758.00
Watch for consolidation if SPY loses 758.
PUT
Entry: Break & hold below 757. Look for a possible $8 move
TP 756, 755, 754.25, 752.50, 749-748.75
Disclaimer
My goal is to keep these trade ideas simple without all the complicated trading terminology that can overwhelm newer traders. Take the levels I provide and compare them with your own chart, making sure to mark any additional support and resistance levels you feel are important. This is not financial advice—it's simply how I see the market based on my own analysis. Always do your own research before entering any trade. Trading involves risk, so manage your risk, take profits along the way, and trade responsibly. @everyone SPY's Break Was Real - Ran To 759.SPY's Break Was Real - Ran To 759.
The 748 break held and ran. Monday the caution was that SPY broke 748 on a bottom-quartile surface - a divergence that had trapped breaks all month. This time it did not trap: price held above 748, the conviction surface rotated all the way up to maximum, and SPY ran through 753 and the 755.66 highs to 759.55. The divergent break resolved bullish and the surface caught up to price. Credit where due, the break was the real thing. The flip side is that it is now extended into new highs with euphoria showing, so this is not the spot to chase. Neutral.
Resistance: 759.67 - the high
Key resistance: 765.71 - next shelf up
Current price: 759.55
Support: 755.66 - the prior high, now support
Key support: 753.22 - first support below
Structural floor: 748.00 - the broken ceiling
Two paths from here:
It holds the breakout and extends. With conviction now maxed and the range resolved up, holding above 755.66 keeps the path open toward 765. A confirmed breakout that holds its breakout level is a trend, not a trap.
It reverts after the euphoric run. Maxed conviction and euphoria at new highs is stretched, and the run from 748 to 759 was fast. A loss of 755.66 and then 753 would signal the breakout needs to backfill. Extended moves mean-revert.
SPY's 748 break was the real thing - it held, the surface confirmed, and it ran to new highs. The honest note is that we stayed Neutral through a break that worked, and it is now extended. On any pullback, 755.66 holding as support is the level that matters.
Built with SYNTHESIS v3.3 | SOM / ACE / IMP / SYNTHESIS
Study, not financial advice.  Short
Short
Long Expanded Tech SoftwareGood morning traders,
# Long Investment Thesis: iShares Expanded Tech-Software Sector ETF (IGV)
## Investment Thesis
The **iShares Expanded Tech-Software Sector ETF (IGV)** provides diversified exposure to some of the world's highest-quality software and cloud computing companies. The ETF benefits from long-term structural trends, including digital transformation, artificial intelligence, cybersecurity, cloud migration, and enterprise software adoption.
Software businesses typically enjoy attractive economics, characterized by recurring revenue, high gross margins, scalable business models, and significant free cash flow generation. As organizations continue to digitize operations and increase technology spending, software remains one of the most resilient and profitable segments of the global economy.
## Why IGV?
### 1. Structural Growth
Software is expected to remain one of the fastest-growing industries over the coming decade, supported by:
* Artificial Intelligence adoption
* Cloud infrastructure expansion
* Enterprise digital transformation
* Cybersecurity spending
* Data analytics and automation
* Subscription-based Software-as-a-Service (SaaS) models
These secular drivers are largely independent of short-term economic cycles.
### 2. High-Quality Businesses
IGV holds many industry leaders that demonstrate:
* High return on invested capital (ROIC)
* Strong free cash flow generation
* Asset-light business models
* Pricing power
* High customer retention
* Significant switching costs
Many constituents have established durable competitive advantages and long operating histories.
### 3. Attractive Business Economics
Compared with many other industries, software companies generally exhibit:
* Gross margins above 70%
* High operating leverage
* Limited capital expenditure requirements
* Strong cash conversion
* Consistent earnings growth
As revenue scales, profitability often improves disproportionately.
### 4. AI as a Multi-Year Catalyst
Artificial Intelligence is likely to increase demand for software rather than replace it.
Software vendors are embedding AI capabilities into their products, enabling:
* Higher productivity
* Premium pricing
* Improved customer retention
* New revenue opportunities
The broad adoption of AI should support long-term earnings growth across many IGV holdings.
## Key Risks
Investors should also consider several risks:
* Elevated valuations during periods of market optimism.
* Higher sensitivity to interest rates compared with value-oriented sectors.
* Slower enterprise IT spending during economic downturns.
* Increased competition and technological disruption.
* Regulatory scrutiny affecting large technology companies.
Despite these risks, the long-term demand for software continues to be supported by powerful structural trends.
## Why Hold IGV for the Long Term?
IGV is well suited for investors seeking exposure to innovative, high-quality companies capable of compounding earnings over many years.
Rather than relying on the success of a single software company, the ETF provides diversified access to the broader software ecosystem, reducing company-specific risk while maintaining exposure to long-term industry growth.
From technical perspective, check 200MA on a daily timeframe
Regards
Josep Long 
 Long
Long
Long 
TECL: Is the correction creating a new opportunity?The Direxion Daily Technology Bull 3X ETF remains one of the most volatile ways to gain leveraged exposure to the U.S. technology sector. Long-term fundamentals continue to be supported by investment in artificial intelligence, cloud computing, semiconductors, and strong earnings from major technology companies. If the sector maintains its momentum, these factors could fuel the next bullish leg.
Technically, price is holding the key $150-152 support zone, where buyers previously stepped in. After a deep correction, the chart is building a recovery base, while CCI is leaving oversold territory, suggesting that selling pressure is fading. As long as support holds, I expect a move toward $227, followed by $340. A break below $150 would invalidate the bullish scenario. Long 
Long