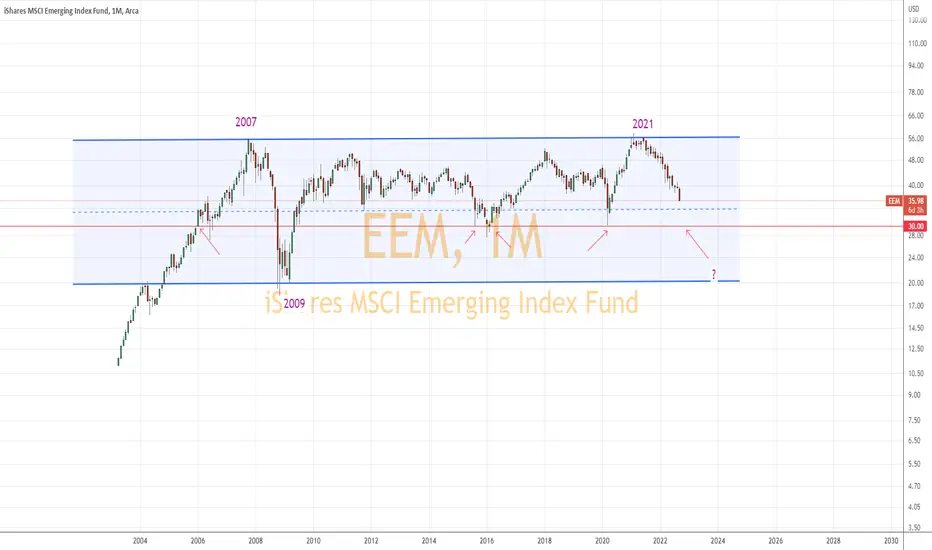
EEMEmerging markets have been under pressure right from June 2021 hopefully by Dec 2022 mean of the channel may give bounce. by SunilDhawan2
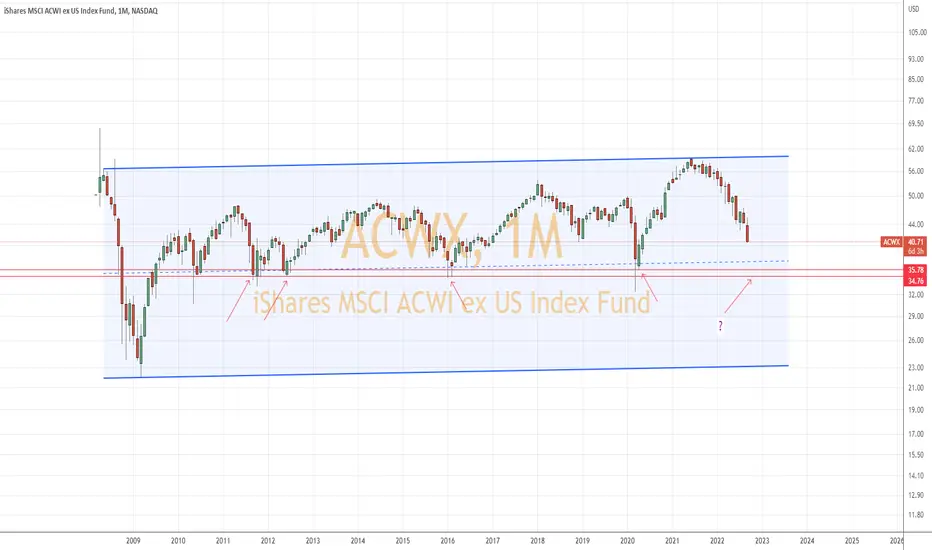
ACWX global equity markets outside of the U.S.ACWX is clearly showing this is not any country specific. It's a global bear from all developed market. Will it be able to bounce from mean or for the first time it may try to touch lower elbow of the channel. I am hopeful of bulls coming back from meanby SunilDhawan1
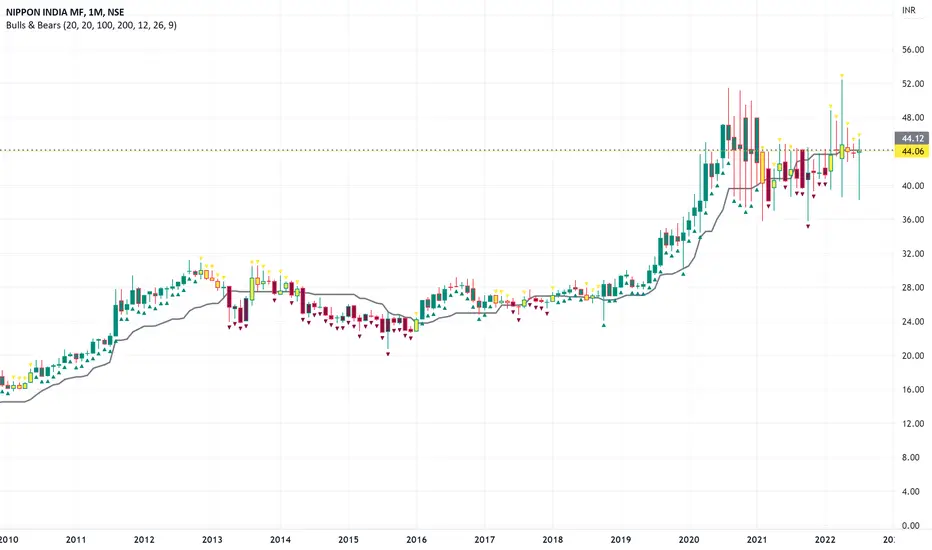
Dow Theory Implemented on Nifty BeesMarked the entry and exit points along with the peaks and bottoms using Dow TheoryLongby pratikmkj16
Silver at strong support.Silver at its first strong support of 17. Next at 15.3 . Good time to enter for long term in my opinionLongby mkmunir30
Gold in USD terms- likely to find support in a few weeksGold is moving towards a multi year trend line. Expecting it to take support on it. RSI is also in oversold zone and we can see reversal from these levels. See previous such occurrences marked.by mkmunir37
Weekly Out Look on ETF I have Made an Analysis that suggest the Major Trend out look , if you are trading in ETF then it will help you to Identify better trade opportunity Good luck 07:33by ShreeKrishna_F17
Long on goldbees with conditionBuy goldbess till it's below 44, according to your risk & portfolio prportion.Longby StraddleShort0
Nifty Bees in buy after last week of December 2021.No long signal generated after last of December 2021 exit. Longby StraddleShort4
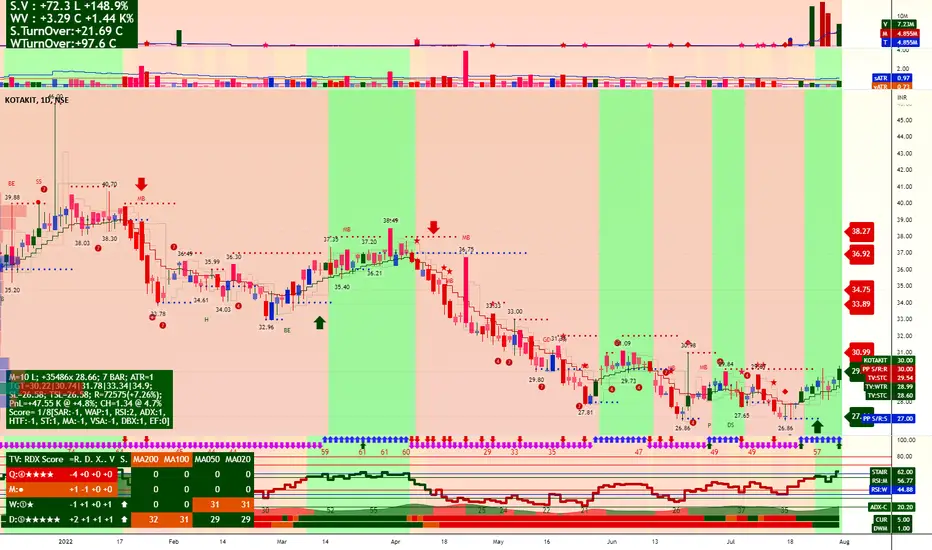
Invest/SIPNiftyIT ETF looking good. VSA SAR system had given buy around 28.66. RSI sustaining above 60. VOLEXP seen in the ETF with volume rising 2 folds siince last 2 weeks. Good to buy now and add more on SIP basis if it deeps towards 26. 30.0 is pivot SAR resistance above which its a breakout for a target of 34/38.KLongby TradersVenueUpdated 1
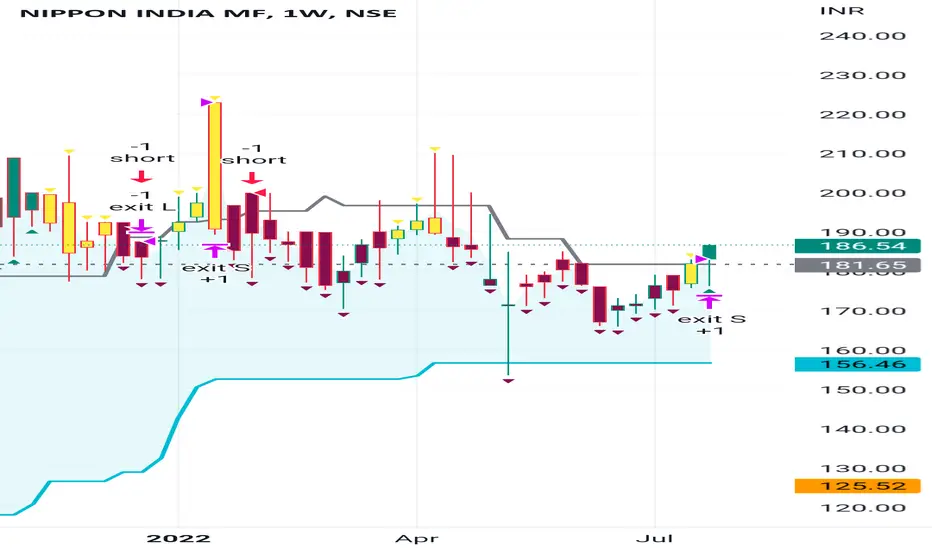
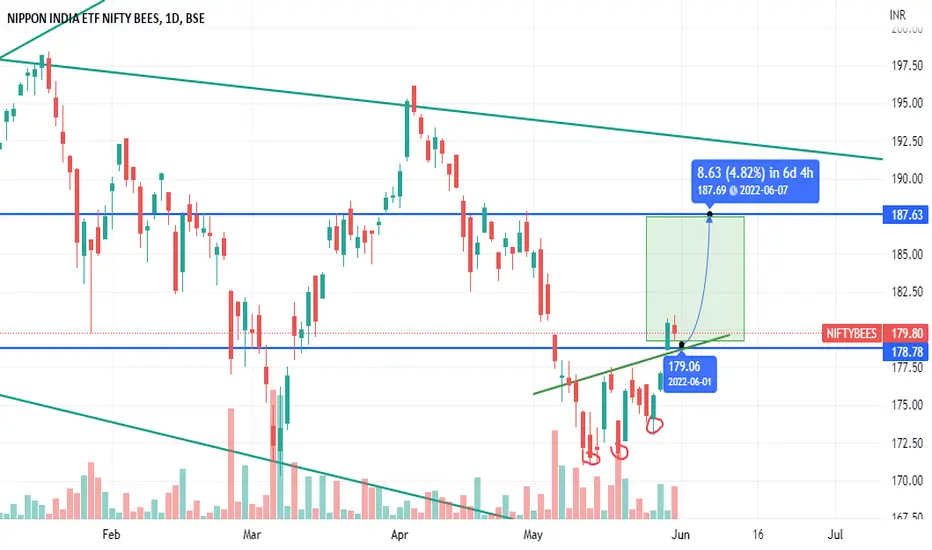
NIPPON INDIA ETF (NIFTY BEES) NIFTY BEES seems Triple bottom pattern in daily chart. It is strong bullish pattern. In this pattern neckline clearly breakout at 178. Now expect small retracement & then it's rally may move upwards to the target.Shortby SubashganesanUpdated 6
copper buy longtermcopper buy 26.90 stoploss 26 longterm complete all correctionLongby UnknownUnicorn122314262
XBI Chart Analysis Don't own XBI. Below analysis is only for educational purpose & not a buy or sell recommendation. 1 & 2 : Double bottom test couldn't break the initial low. Confirming strength from buyers - Bullish 3: Last lower high in the downtrend & converting that resistance into support by re-testing it on low volumes - Bullish 4: Resistance confluence of consolidation high & long term trendline resistance broken with strong volumes – Bullish 5: Recently established weekly resistance level broken though by Venkat_0141
copper buy longtermcopper buy 29.73 stoploss 27.20 longterm complete all correctionLongby UnknownUnicorn122314261
copper buy longtermthis correction start 5 april 2022 this time price 47 and price go down 5 wave and price go up corrective wave b 12 may 2022 to 7 june 2022 and again price go down 5 wave structure this correction extended zig zag correction zig zag correction (5-3-5) zig zag correction price go down 5 wave and again move up a,b,c and down fall 5 wave this structure complete all correction complete . and price go higher cycle Longby UnknownUnicorn122314261
copper buycopper buy long term 32.71 stoploss 31 complete all correction wave structureLongby UnknownUnicorn122314261
Nifty Auto analysisanalysis of nifty auto and nifty index #NiftyAuto #M&M and #TvsMotors03:39by Bengaluru_Expert_Traders2
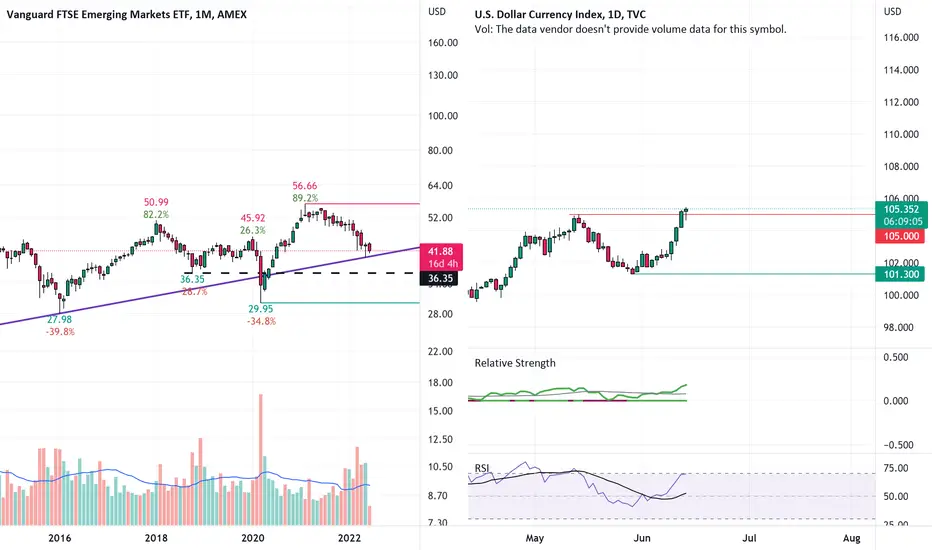
Emerging Economy chart and Dollar IndexProbably the two most important to see regularly in context to Emerging Economies like India. DXY will have a inverse relation to performance of equities in India and Vice-Versa. First chart chart shows the strength of FII's into EE. by roopak290
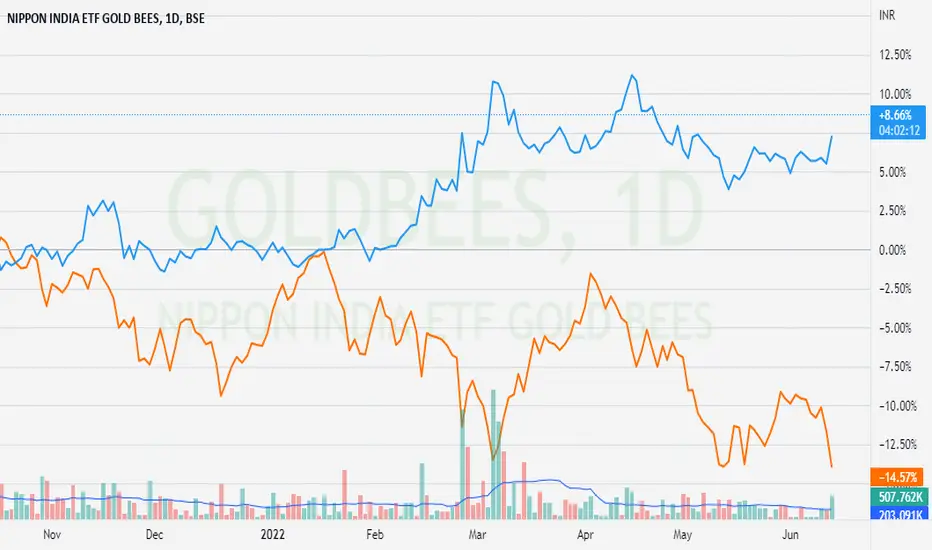
Rebalance on mind...In next 2~5 weeks we can get good opportunity to rebalance. Gold to equity will be good bet. +22% divergence seen since october 21 by yndesai1
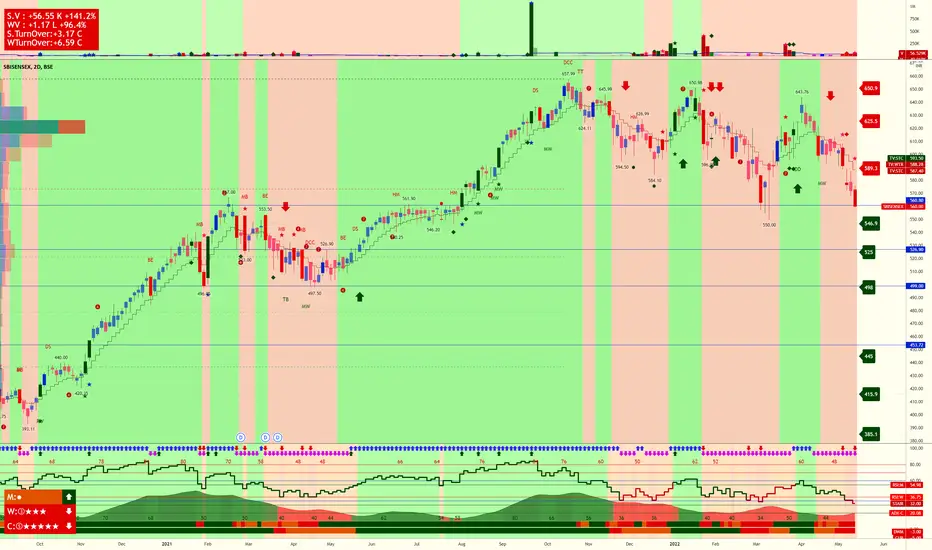
ETFInvestIndexes are on steady decline. I will use the opportunities to buy index ETF's and pledge them for trading as collateral. Keeping that in mind, I have plans to accumulate #SBISENSEX ETF around 555/526.9/499/453. Will increase quantity on lower purchases. While we don't know the bottom, one thing is for sure indexes will move higher in few months or years. Additional rental income can be generated by selling 2 DTE OTM weekly CE.Longby TradersVenueUpdated 0
Renko for box theoryTimeframe - Weekly. Box size - 0.5 x ATR 8 in candlestick chart. Change the Box size every 4 weeks as per the formula mentioned. Also, don't change the timeframes when a trade is taken based on the above system to avoid false signals.by KunalMore2
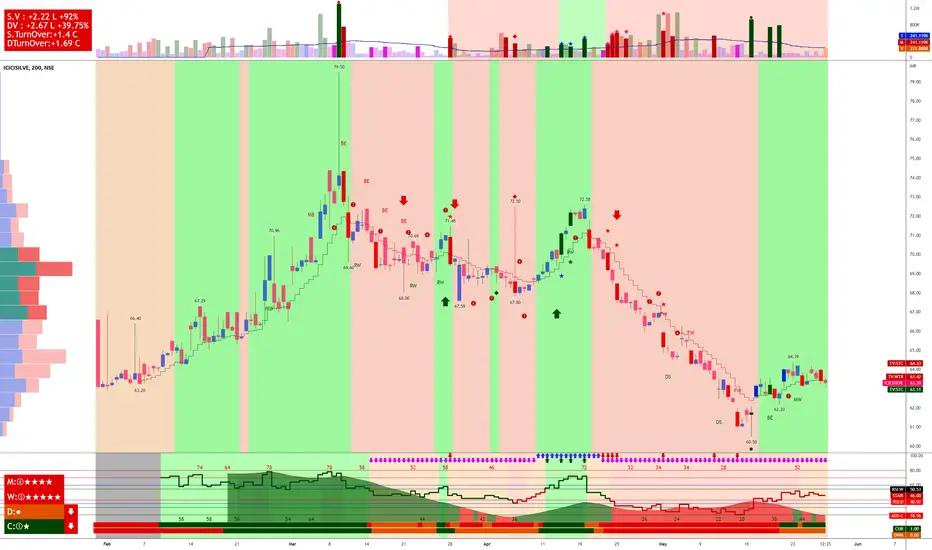
InvestSilver ETF is good to buy at this level. One should invest 25% of investment here. Add in 4 trenches with 25% each for every 2-3 rupees fall. Basically on every 5% decline add more. View should be long term.ILongby TradersVenueUpdated 1
Invesco Next supportslooks like this stock will test the following supportsby udhaysadagopanUpdated 2
PLANDEMIC STUDY ADUSTED TEXT BOXES FOR EVENT 201 and MARCH 311SPY Chart update to clarify the dates used in the time based fib extensions. -TTby Brian82932
copper buycopper down five wave structure and confrimation candle stick down side or rsiand macd postive crossover copper buy 36.10 stoploss 34 target 38 or 42Longby UnknownUnicorn122314264

 LongLong

 LongLongShort
 LongLongLongLong
 Long
 Long