
ETF market

QQQWatch how this stock moves through this, which I consider an indicator with which I can know the movement of all the charts
 Long

uranium URA renkoIs the renko chart trying to tell us that this is where we should add to our postion??
 Long

Goldbees taking support and moving up!!The stock price is now moving steadily upwards since it took EMA 100 as a major support. Expected targets shown on chart
Long
Gap down and run?If we open where things are at as of (Sunday night), looking at lower targets of $335 and $329 this week.
Short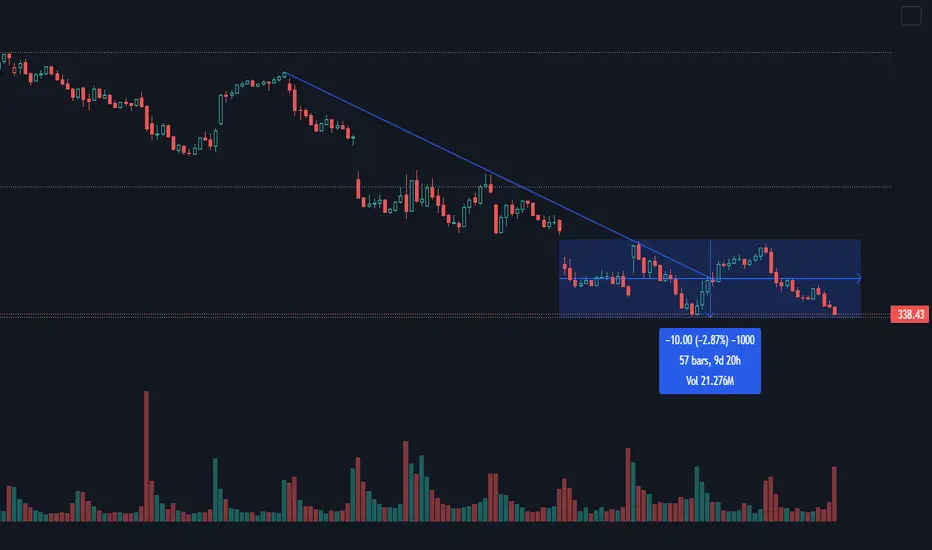
Buy Goldbees for the long runStart Buying Goldbees as you wont get it at the current levels after 1 Jan 2023. The Chart is very clearly depicting a strong Bullish Upmove on Gold.
It could be due to high inflation or it could be due to rising commodity prices or it may be due to Government printing money. Whatever the reason is look at Rate of Change indicator below. The Roc is depicting that there is a clear breakout and the Current prices are above 6M 12M 24M & 36M EMA.
Long
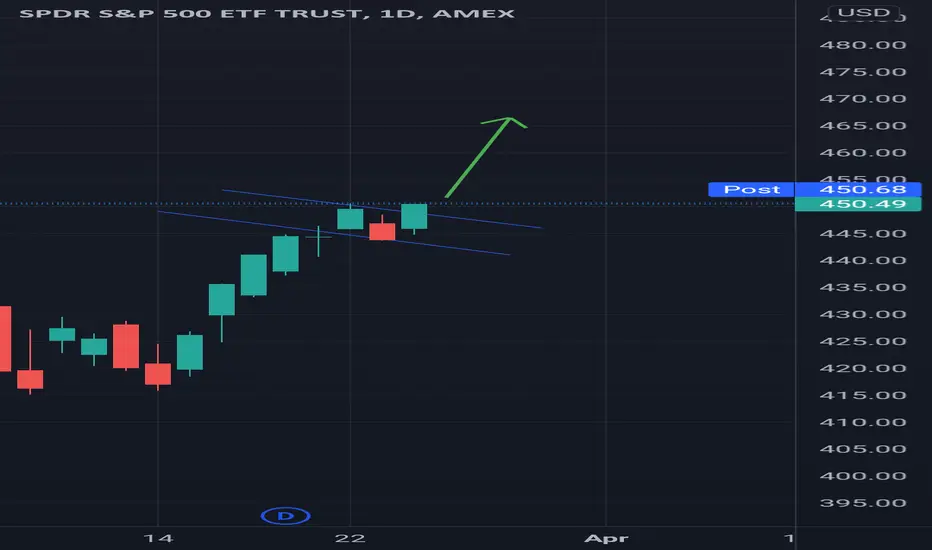
SPY 4hour bull flag In this we can see a big bull move on tomorrow that is Friday 25 march. Market is in bull runner so it easy that we can go up from here
 Long
QQQ: Buy only ABOVE 329, SL 317 TGT 345QQQ seems to be a Long trade above 329 with Stop-loss of 317 and a Target of 345. One can look in to Long trade only if it crosses 329.
This is for education purposes only.
Long
Cup and Handle pattern right after floor is consolidated? Because of the gas supply problem europes going to face, I doubt it will keep going down, there's only up, how fast it goes up depends on the gravity of the Russian invasion or if it drags on until next fall.
Change in the downward tendency, with big volumen especialy during handle dip.
my projection is 170 USD by september.
 Long

Niftybees Fallen 20% from high One of the safest place to be invest is "NIFTYBEES", You may see good return in upcoming months. I'm investing myself as well, even trader can buy after that you can pledge for margin.
Long
Buy holdNifty bees run bass nifty Intex. Nifty now support place and maybe support form. So nifty bees buy hold short time 10,15 points profit possible
Long
IMW (Russell 2000) AB=1.618CD patternDisclaimer - I don't own IWM ETF shares. This is not a trading or investment recommendation.
This is in continuation to my previous post on IWM Analysis, this chart shows the AB=1.618CD pattern of IWM.
All the best!


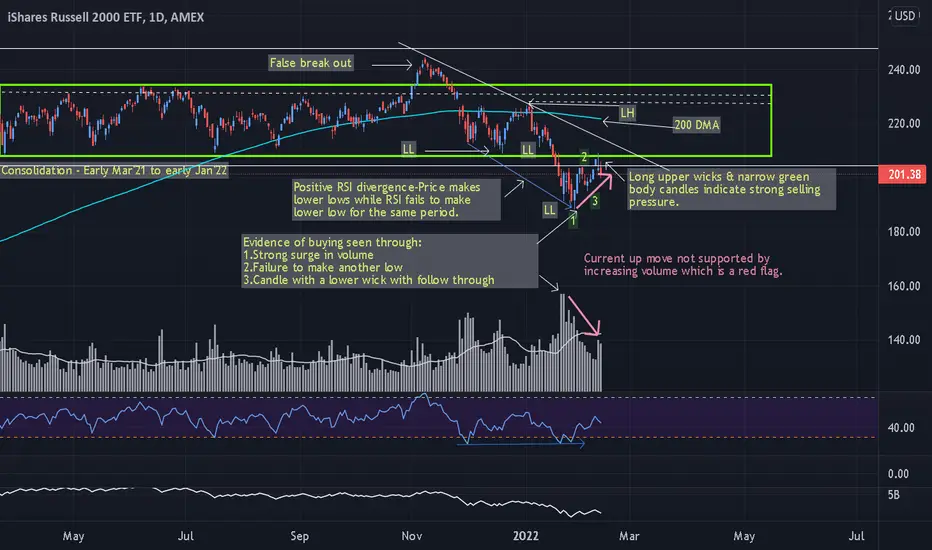
Analysis of IWM(Russell 2000)Disclaimer - I don't share of IWM ETF. This analysis is not a trading or investment recommendation & is only for educational purpose.
1.IWM has been in a lower high lower low structure after the false break out.
2.The long consolidation support area was broken indicating that the activity during consolidation was distribution.
3.IWM has paused its downtrend & has formed a 1-2-3 structure & also evidenced through positive RSI divergence.
4.However, the current up move from a low of 188.09 is not
Technical ANalysis of XLEDisclaimer: I don't own shares of XLE . This analysis is not a trading or investing recommendation & is only for educational purpose.
1. XLE has been going up slowly & steadily since Mar’20 after putting a bullish 1-2-3 pattern marked by the successful break of point#2 of the pattern.
2.In Jan 2022 price crossed a major downtrend resistance line (dotted line) that has been valid since July 2014.
3.Price then re-tested the resistance converted support in the week of 18-Jan-22 & failed to break t

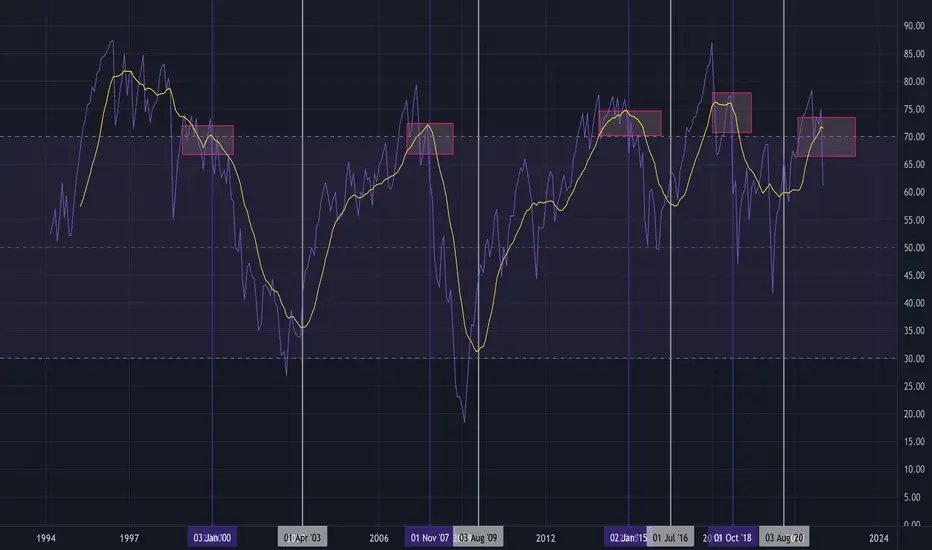
S&P Sectors Relative Strength - Quarterly/Monthly/Daily viewUse the below indicator to setup quarterly/monthly/daily view of S&P sector relative strength.

Spy Looking Week Spy Is looking week if not hold level above previous high then 3-5% downside is possible AMEX:SPY
Short Short
ARKK idea to pick tech stocks ARKK ETF holds a good mix of US stocks. Look for 63-60 to start building portfolios


PSU BANK BEESRight time to invest in this stock for at least 6months.Its getting ready to give breakout of descending triangle pattern same as it was seen GANESHA ECOSPHERE.
Long
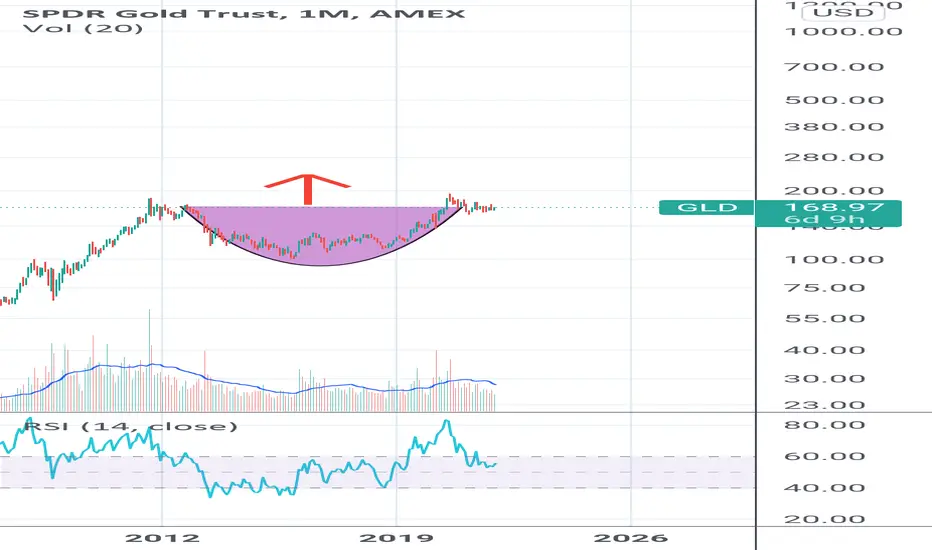
Gold on decade BO monthly chart Gold can see 225 against 168 today.
Cup and handle formation in the making
Obviouslyitsmonthly chart so the target is also in coming years.
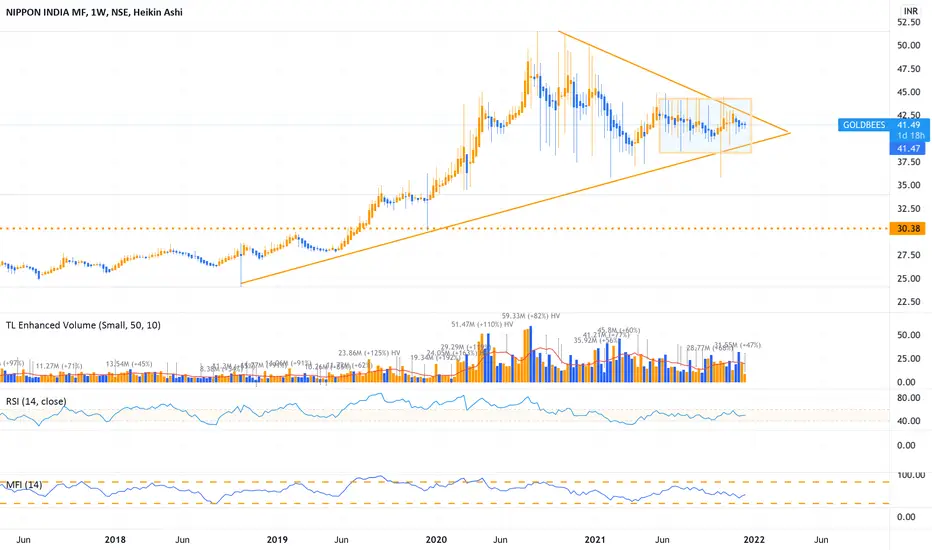
Goldbees weekly chart- Can have move on either sideGoldbees consolidating in a tight box and a triangle since Jun'21. Can give a big move either side now. Looking at PA, i can look at an upmove.
spying on spylooking at poss inv head and shoulders forming. using channels upon channels, inside more channels....

ETF BANKBEESBuy ETF BANKBEES through SIP without any risk instead of buy individual banking stocks or BANKNIFTY. It can be average / manage at any range. My Target is minimum Rs.400

Nifty GOLDBEES◾goldbees is consolidating in a narrow range between two trend lines in black color
◾Buy goldbees @CMP
◾If it give close below the lower black trend line on weekly basis...Then exit
◾Risk reward + safety is very favourable
Long