Global Uranium ETF chart analysisGlobal Uranium ETF
cmp $29.12
1) Shorterm Buy
SL $26.23 Target $31.43 - $32.29
Bullish Rising wedge patterm
2) Longterm invest like SIP for 5+ years
Bullish uptrend
3) World's most power consuming countries are
now shifting from Coal based to Nuclear
based power plants
Prepared by Vivek Kolte
Lakshy Assets Service
ETF market
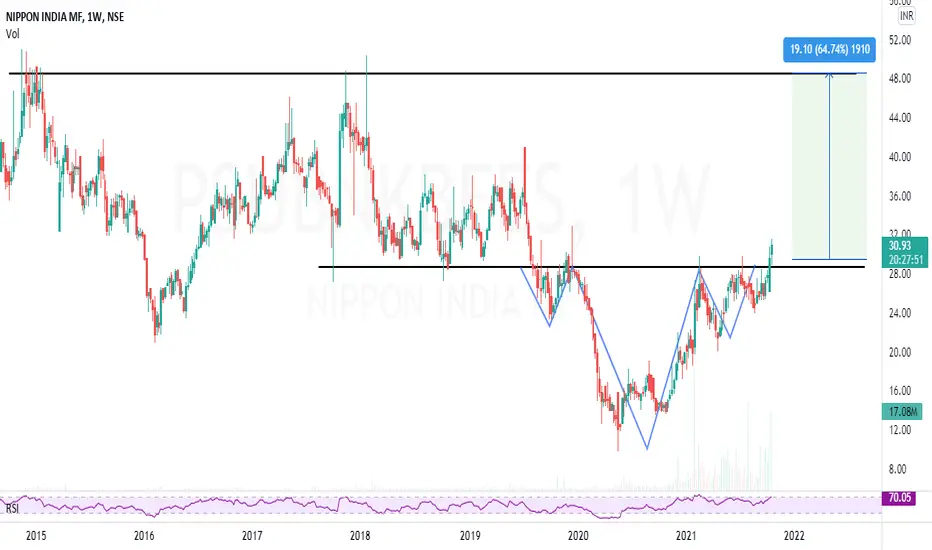
PSUBNKBEES | Investment on ETF opportunity | Potential for 60%PSUBNKBEES | Investment on ETF opportunity INHS pattern with good breakout above previous supply zone - Looks potential for 60%
CMP : 31 (Dip : 21)
SL : 25
Target : 45, 48
Since it is Index it could be a safe bet and low volatile.
Thanks to @Ananthan21 for bringing to notice :)
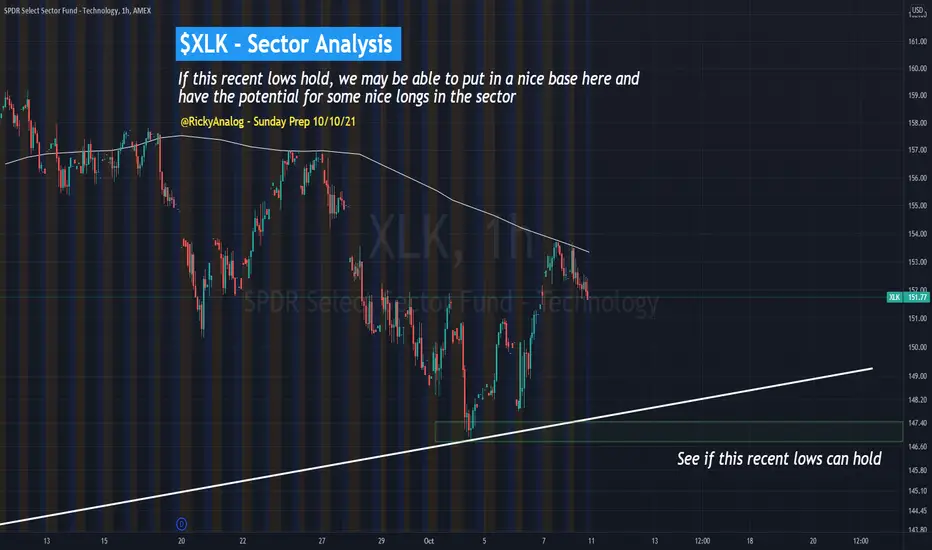
Sunday Prep 10/10 - $XLF Pullbacks can Offer Long OpportunitiesFinancials still look extremely strong as well, making higher lows and higher highs. Pullbacks can very well offer long opportunities. We also may get some extension on it, since we just broke out. Depends on the overall market though, but the weekly chart looks great on this
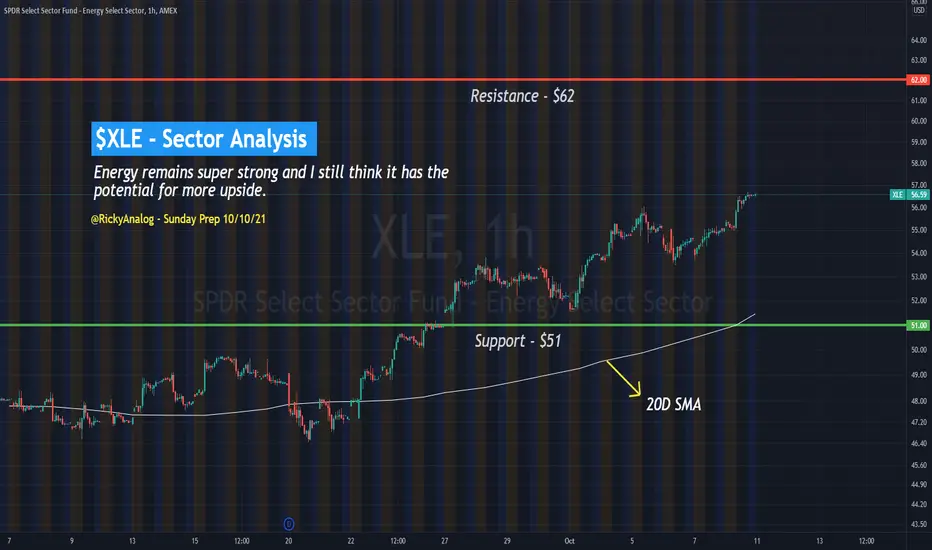
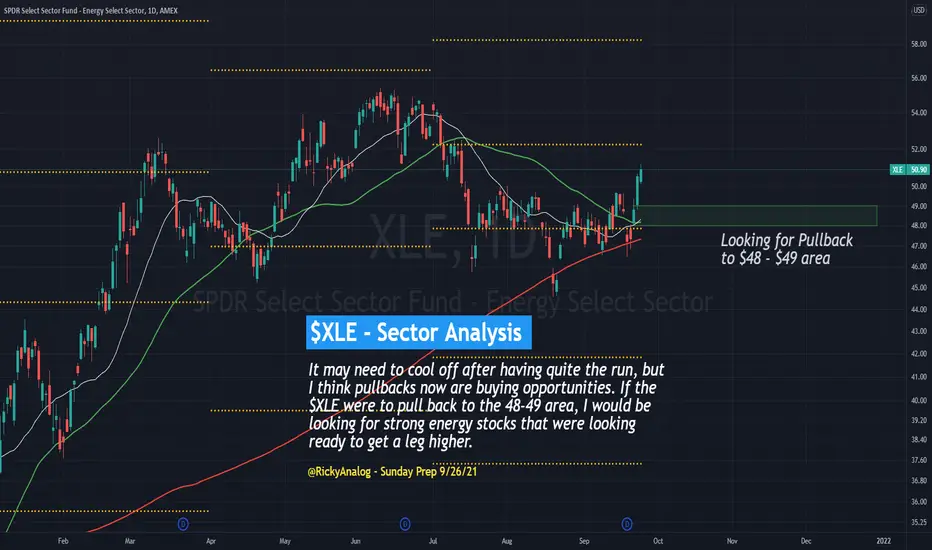
Sunday Prep 10/10 - $XLE Has Potential for More UpsideEnergy remains super strong and I still think it has the potential for more upside. You can see on $XLE that the $62 area is where I may think some resistance shows up. But if we pull back ahead of that, i still like the buying opps down around $51 (20d)
ILong
Sunday Prep 9/12 - $XLC Communication Services Looks DecentWhat a change in this from last week. Red across the board. When you look at all the sector ETFs, you also see a LOT of the charts look like they are hanging on by a thread and may take a tumble. One of the few that I thought still looks pretty decent is the Communication Services. The $XLC chart is pulling back into a real nice area and may have some strength this week. Will be monitoring.
ILong
Sunday Prep 8/29 - $XLV Looking for Strong Names in the SectorWhereas Healthcare has been a strong sector but had a down week. Well, let’s look at the $XLV chart……pullback to support. So this may be a sector where you can possibly spot some strong names that are basing at support and look for pushes higher out of those bases.
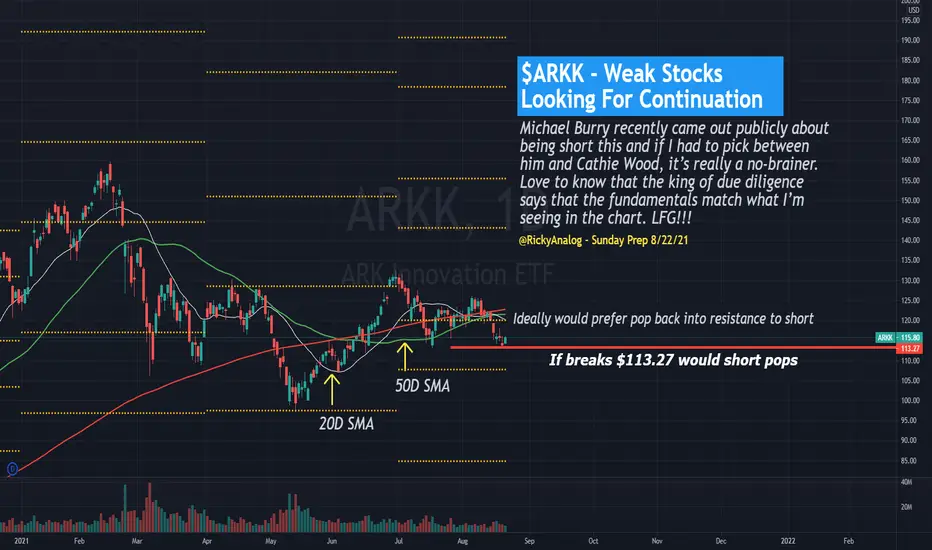
Sunday Prep 8/22 - $ARKKThis was in the Sunday Prep 2 weeks ago for a short and so far it’s come in quite nicely. Would prefer pops back into resistance to hammer short, but if we were to break 113.27 I would probably start shorting pops joining trend. Michael Burry recently came out publicly about being short this and if I had to pick between him and Cathie Wood, it’s really a no-brainer. Love to know that the king of due diligence says that the fundamentals match what I’m seeing in the chart. LFG!!!
Sunday Prep 8/22 - $XLE - Want to short bounce on energy namesOne thing that is important to point out is the fact that each weak I look at all the different sector ETFs to see their charts. Just because something had a down week doesn’t mean that I’m not interested in it. Look at the Financial sector for example. They were down over 2% for the week. But then look at the $XLF chart.
You can see it’s really just pulled back to support and is still looking very bullish. Contrast that with the Energy sector via the XLE chart.
This is a completely broke
BUY OPPORTUNITY TLT is a fund that reflects the price of bonds with a maturity of 20 years. It reflects the price of the bonds but not the yield which is inversely proportional to the price. When the interest rate increases the price decreases while when the interest rate decreases the price increases in value.
It is a highly protective asset that helps diversify portfolio risk. It has a long-term bullish statistical bias and is particularly tempting to place in a portfolio. By statistically analyzing the pri