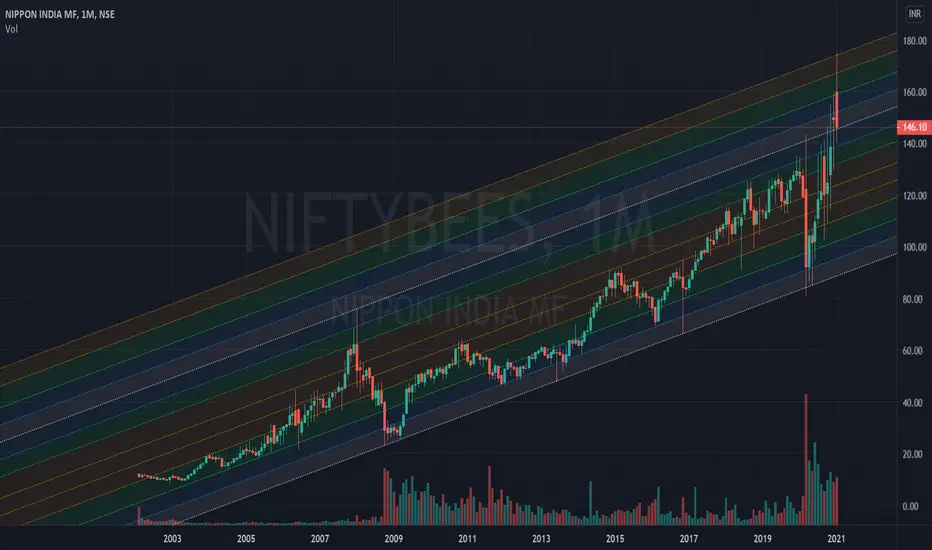
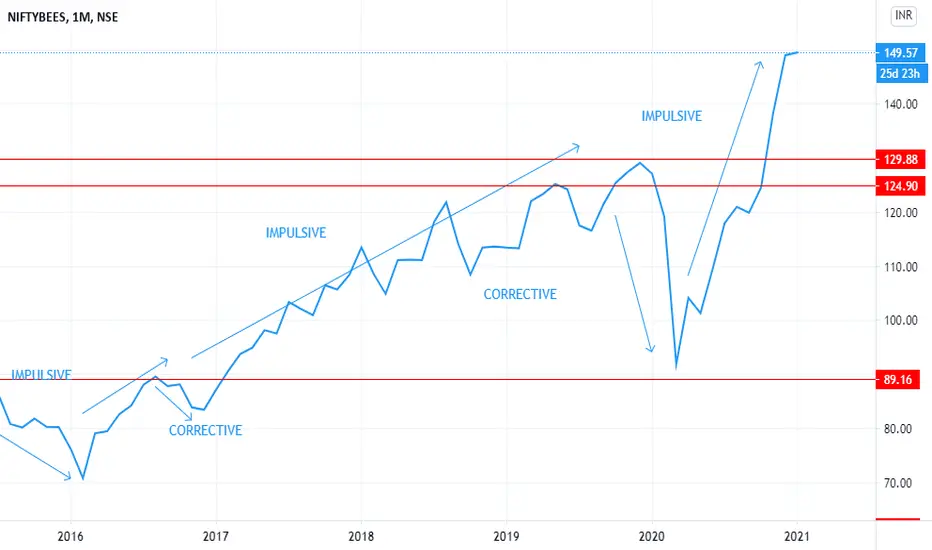
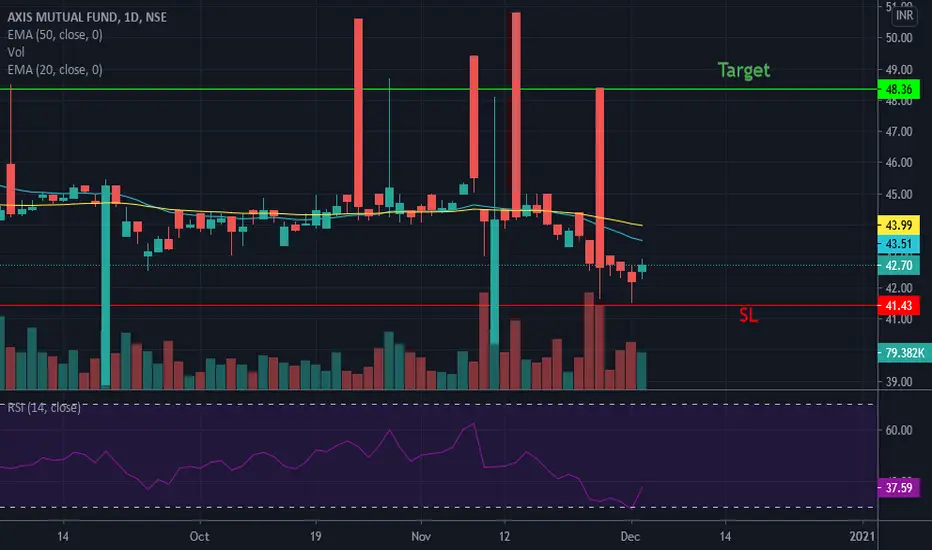
Nifty 50 Bees forever growth chartEveryone can you use this chart to buy ETF at low level and sell at High level to make profit.Longby AmalSathya53
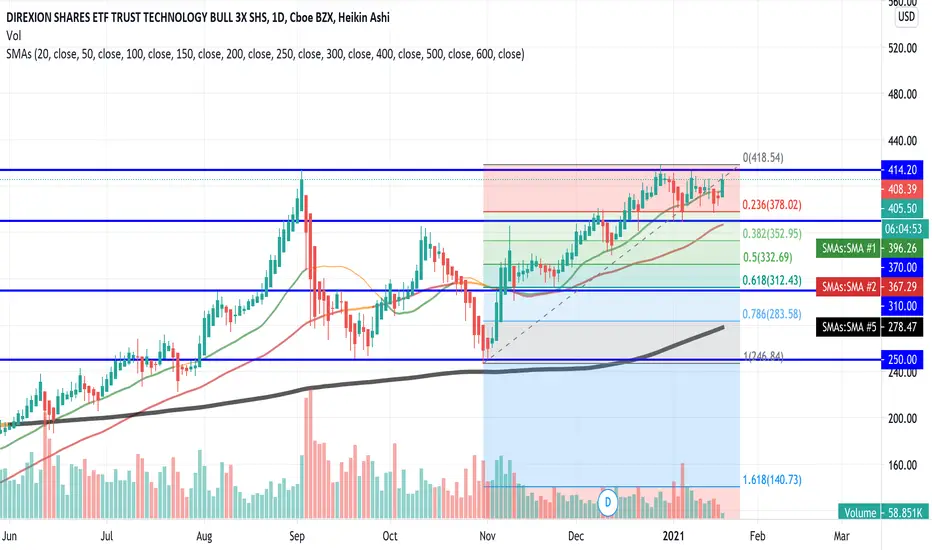
TCEL AnalysisTCEL Support Levels, Fibonacci Retracement Levels an Moving Averages SMA20, 50, 200Longby naidu0824731
► Stock Info #1: ETFs !!! ◄► Stock Info #1: ETFs ◄ 📌 It’s important to build our own portfolio to create wealth. Here, I have posted one of my favourite investment 💕 tool. 📌 An ETF is a basket of stocks that reflects the composition of an Index, like S&P CNX Nifty or BSE Sensex. The ETFs trading value is based on the net asset value of the underlying stocks that it represents. Think of it as a Mutual Fund that you can buy and sell in real-time at a price that change throughout the day. ☆ Kindly like 💗 & share ➥ this Longby Profitable_Traders10
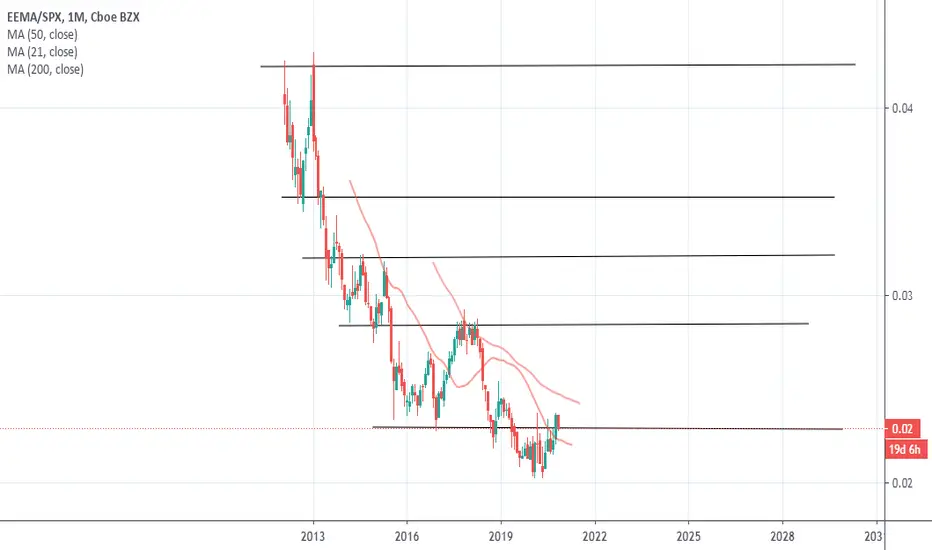
Nifty Relative to other markets - 6M ViewFellow bountyhunters, We can observe the relative returns of Nifty to other markets in the last 6 months. Observe and make your own inference. This is just to show where Nifty stands relative to other markets and momentum. IEV- European Maretks ETF EEM -Emerging markets ETF EFA-Developed markets minus North America EEMA-Emerging markets Asiaby bountyhunter210
Goldbees stock strategiesNSE:GOLDBEES The Goldbees company is a gold exchange traded product that also is an invested ETF. In the 1990s, the price for 1 kg gold was equivalent to a maruti 800 and over the years the same amount equals to the cost of a high end BMW car. Gold is the same, but the value increases. Similarly, if bought now as goldbees specifically is in a dip but gold is a lifetime investment so it will be a safe investment that reaps benefits over time. Goldbees is owned by Nippon that is doing well in theby Hridai2
Stocks vs Bonds & Copper vs Gold - Bounty for Global equitiesFellow Bountyhunters, Two charts that tell us what can happen to the global equities is posted here. Chart on left is the relative ratio of Stocks vs Bonds. One can see PRICE ACTION rising to the north after bottoming and testing some resistance as of now. If they breakout then we have a continuation and and this can possibly indicate continuation of the rise in equity markets. Chart on right indicates the relative ratio of Copper vs Gold (Miners). Copper moving North is bullish for equities aLongby bountyhunter211
Rising yields leading to Breakdown in TLT ETFWith all major US treasury bond yields rising, TLT ETF is looking at breaking down from 155 support. A good short trading is developing.Shortby vipulmehta8172
Morningstar pattern in down trendA Morning star pattern with good volumes and specifically in a downtrend.Give it a try as risk reward is very favourable.Aby Tradingpath0
BankBees Accumulate for Long termBANKBEES is at monthly demand zone of 190 to 200 for long term accumulation (SL 176) Next level of accumulation is 140 150 (SL 134) next level to accumulate 95 to 105 ( SL 87) This is for long term only and to be done in tranches SL is given for every level for better money & risk management Longby akshay.lakhinaUpdated 1
Corrélation BTC 2016/2020 avec GRAYSCALE2016/2020 paterne correlation on the BTC with the addition of the same paterne on Grayscale to see in the coming weeks if our correlation holds the road. This is an idea and not an investment strategy. /// /// Corrélation paterne 2016/2020 sur le BTC avec ajout du même paterne sur Grayscale à voir dans les semaines qui viennent si notre corrélation tiens la route . Ceci est une idée et non pas une stratégie d'investissement . GLongby ThisisSPARTAAAAAAUpdated 428
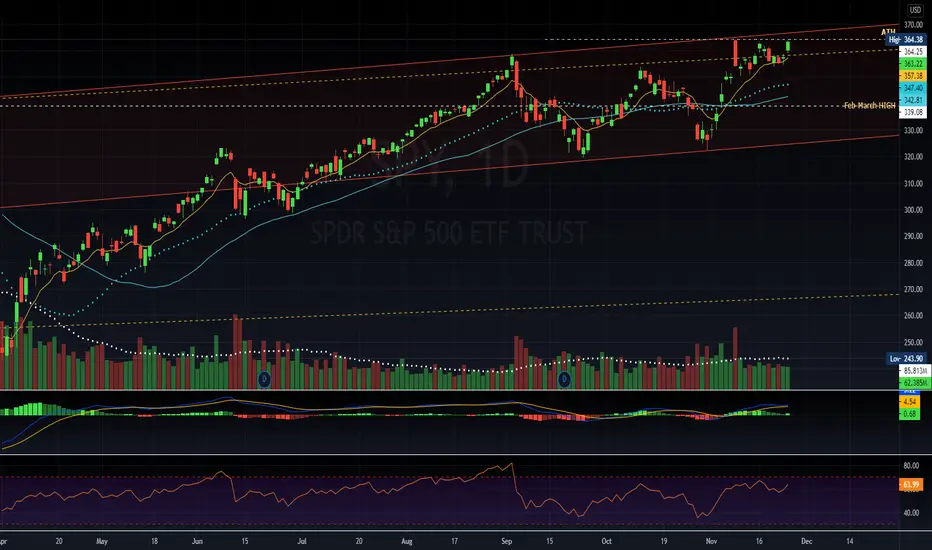
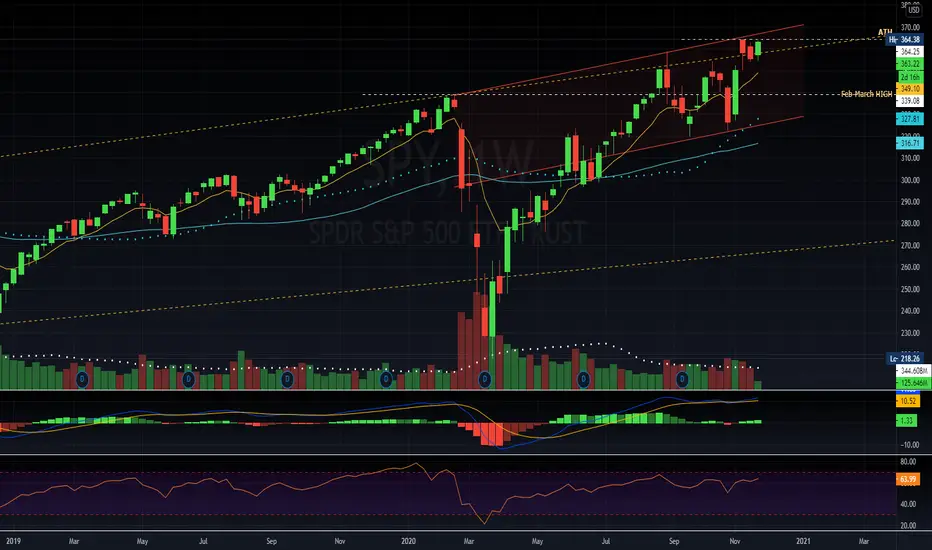
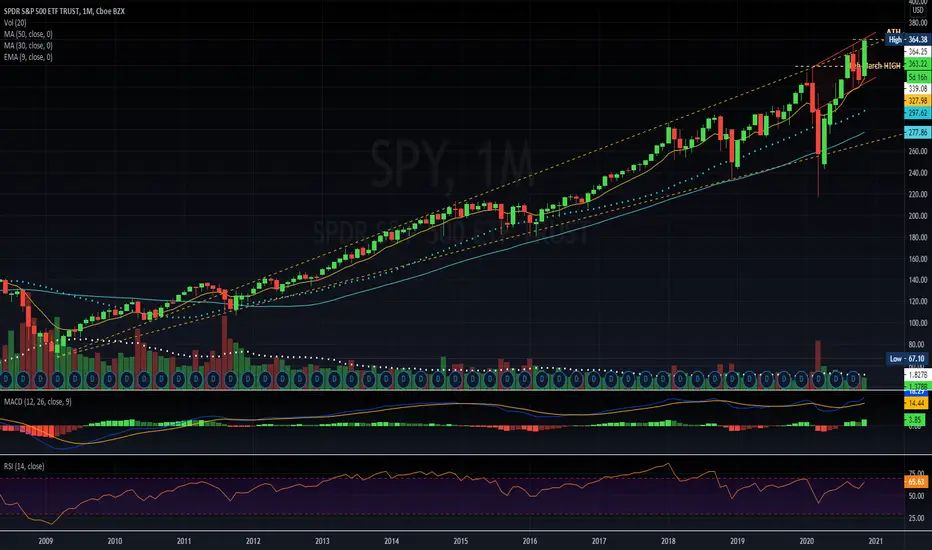
590 600$ SPY by 2024Rona was the 4th down of the larger degree. 1 up of the large 5th is in. 260 270 buy of a lifetime.Longby scripter1
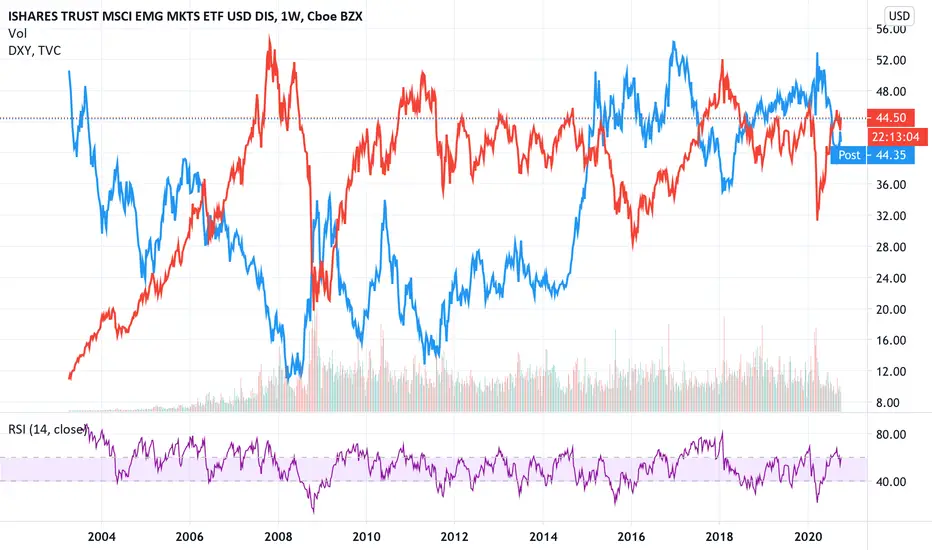
Emerging markets and DollarWe seen some negative correlation between Dollar Index and Emerging Markets Index (EEM). Currently, the dollar index has broken a significant upword sloping trendline and is retesting the same from below. If this trendline now becomes a resistance, the we may witness further fall of Dollar and a bullish really in EEMs.by santosh_dts1
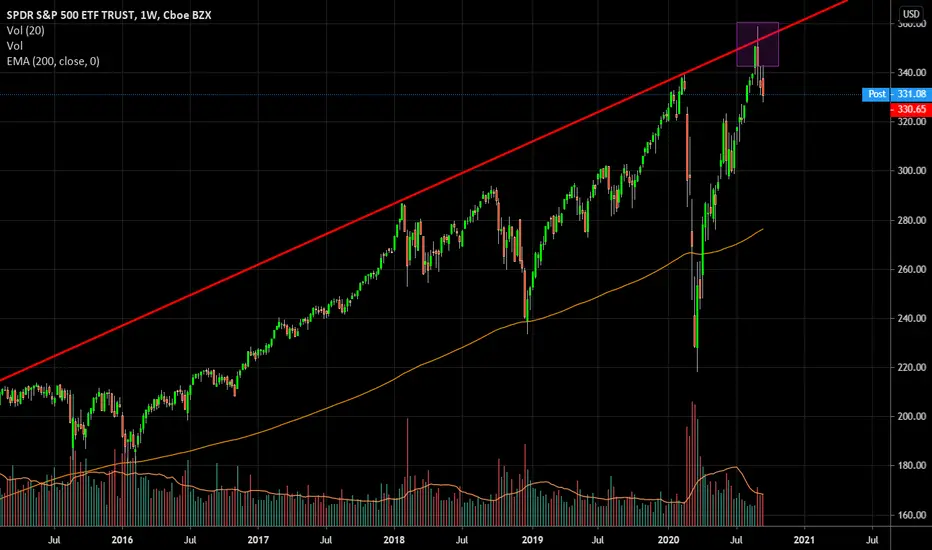
SPY Reject of longterm weekly/monthly trend since 2011Can short starters then add on lower highsShortby hua872984Updated 0
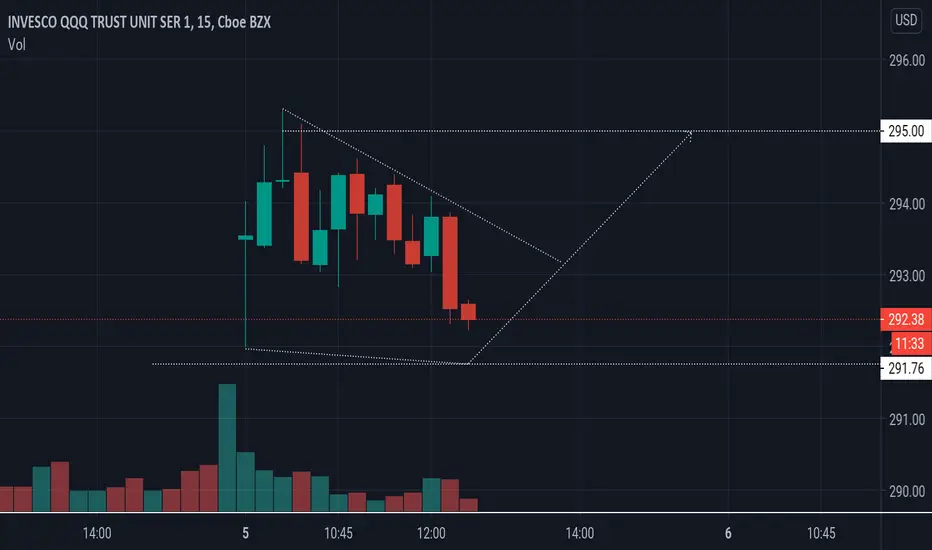
Gap up Trading - How to Trade the Gaps - Part 1Om Namah Shivay Brothers, Let us discuss on "How to Trade the Gaps" - ( part 1 ) During the trade progression, many gaps happen. There is no hard and first rule to restict them based on count, or based on where gap can happen / where it can not happen. There is nothing like that. Gaps can happen anywhere during the trend. Say we want to categorize them, then they can be categorized as 3 types 1. Break Away Gaps - these happen during the initial stage of the trend. ( Check Educationby sudhannayak24
 LongLong
 LongLong

 LongEducationShortEducationLongLong
 LongLongLongShortEducation