#GROWWRAIL Trend: The ETF has reversed its recent spring recovery after making a lower high at 34.47, resuming a broader medium-term downtrend on the daily chart.
Price Action: A sharp red candle broke firmly below the immediate horizontal support at 30.65 to close at 30.02, threatening a further slide toward the next major structural support level at 29.35.
ETF market
#MIDCAPETFTrend: While the broader structure was steadily bullish peaking near 23.96, the ETF has entered a sharp short-term corrective phase over the last few sessions.
Price Action: The price witnessed a steep decline to test a critical psychological and horizontal support zone around 23.00 (22.98 orange dashed line) before staging a small relief candle to close at 23.10.
Institution Option Trading Part-2PCR (Put-Call Ratio) – Institutional Trading Strategy
What is PCR?
PCR = Put OI ÷ Call OI
It shows market sentiment of big players in indices like NIFTY 50.
Institutional Psychology
2. How Big Players Use PCR
Retail buys options randomly
Institutions control PCR zones to trap traders
👉 You follow PCR = You follow smart money
📈 PCR Levels (Game Changer)
3. Key Zones
PCR < 0.7 → Bearish sentiment (too many Calls) → ⚠️ Reversal possible
PCR 0.7 – 1 → Neutral zone
PCR > 1.2 → Bullish sentiment
(Smart Money PerspectiveRSI Divergence (Smart Money Perspective)
RSI Divergence signals a hidden shift in momentum before price reacts
Bullish Divergence → Price makes lower low, RSI makes higher low (reversal up)
Bearish Divergence → Price makes higher high, RSI makes lower high (reversal down)
Works best at strong demand & supply zones (institutional areas)
Always combine with market structure + liquidity grab for confirmation
Divergence alone is not enough—wait for price action validation
Most powerful when seen on
Institution Option Trading Part-3PCR means Put-Call Ratio
It compares how many Put options are traded versus Call options.
Simple formula: Put Volume ÷ Call Volume.
This helps understand market mood.
Institutions use options heavily
Big players like banks, hedge funds, mutual funds often use options for hedging and positioning.
So PCR can give clues about what smart money may be doing.
Shows fear vs confidence
High PCR = More puts than calls = Fear, protection, bearish mood.
Low PCR = More calls than puts = Confidence, bullish
Banknifty and Nifty AnalysisPCR means Put Call Ratio
It tells us how many Put options and Call options people are buying or trading.
Why it matters for institution trading
Big players mostly use options. So PCR helps us understand what big money may be thinking.
If PCR is high
More puts than calls.
Means traders are scared or taking protection.
Sometimes big players expect weakness.
If PCR is low
More calls than puts.
Means confidence in upside.
Sometimes market is bullish.
Why learn this
Price only shows movement.
PCR sho
RBI Interest Rate & Liquidity DecisionsIntroduction
The Reserve Bank of India (RBI) plays a major role in controlling inflation, maintaining financial stability, and supporting economic growth in India. One of the most important responsibilities of the RBI is managing interest rates and liquidity in the banking system. These decisions directly impact the stock market, banking sector, businesses, loans, investments, and the overall economy.
This report explains RBI interest rate policies, liquidity management tools, market impact, a
Trading Option Analysis With Education and Logic PCR means Put Call Ratio
It tells us how many Put options and Call options people are buying or trading.
Why it matters for institution trading
Big players mostly use options. So PCR helps us understand what big money may be thinking.
If PCR is high
More puts than calls.
Means traders are scared or taking protection.
Sometimes big players expect weakness.
If PCR is low
More calls than puts.
Means confidence in upside.
Sometimes market is bullish.
Institution Option Trading Part-1PCR means Put Call Ratio
It tells us how many Put options and Call options people are buying or trading.
Why it matters for institution trading
Big players mostly use options. So PCR helps us understand what big money may be thinking.
If PCR is high
More puts than calls.
Means traders are scared or taking protection.
Sometimes big players expect weakness.
If PCR is low
More calls than puts.
Means confidence in upside.
Sometimes market is bullish.
Why learn this
Price only shows movement.
PCR sho
Technical Analysis VS. Institutional Option Trading part - 2.0Trading is the process of buying and selling financial instruments such as stocks, commodities, currencies, or derivatives with the objective of generating profit. Unlike long-term investing, trading focuses more on price movements over shorter timeframes.
Key Objectives of Trading:
Capital appreciation
Hedging risk
Generating regular income
Leveraging market volatility
Trading operates on the principle of demand and supply, where price fluctuates based on market participants’ actions.
Tradin
XOP - strong breakoutLooking at the AMEX:XOP monthly frame, the breakout above $153 is a significant shift in market character. Despite the recent red candle (profit-taking/mean reversion), the long-term trend has shifted from "sideways" to "up."
The 1M chart shows a classic rounding bottom/cup formation over 4 years. Is the market pricing in a tighter oil supply for the long haul?
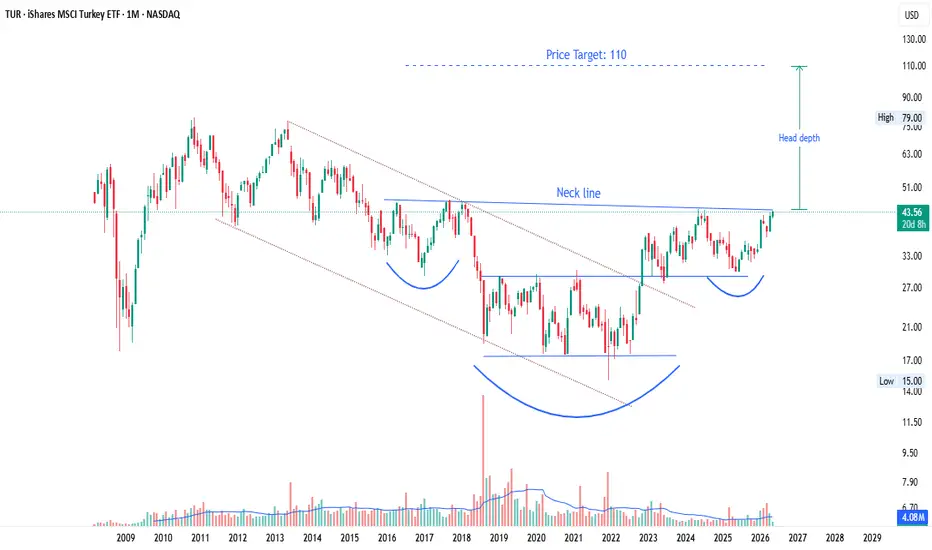
iShares MSCI Turkey ETF (TUR) | Massive Inverse H&S Monthly TFiShares MSCI Turkey ETF (TUR) | Massive Inverse H&S Bottom reversal on Monthly Chart 🇹🇷📈
The monthly chart of TUR is showing a strong long-term Inverse Head & Shoulders bottom reversal pattern, which could signal the beginning of a major bullish cycle after years of consolidation and downtrend.
The neckline zone around 43–44 has been tested multiple times and price is now attempting a decisive breakout. What makes this setup interesting is the huge multi-year base formation created be
SPY May ForecastSPY is now trading above equilibrium (705–710) and moving into the upper half of the monthly structure.
This is no longer a repair phase — it is a potential trend continuation phase, provided equilibrium holds on any pullback.
The key shift:
Earlier the market was deciding at the lower rail → now it is deciding whether to build continuation above equilibrium or fail back below it.
.................................................................
1) Continuation Case — “Above equilibrium → expan
#ITBEESPrice Action & Trend
Current Price: 32.37 INR, up +0.94% for the day.
Short-Term Recovery: After a sharp decline from the 35.50 level (seen in mid-April), the price appears to be stabilizing. It recently hit a low near 31.25 and is currently attempting a bounce.
Candlestick Pattern: The most recent candles are small-bodied and green, appearing after a large "exhaustion" red candle. This suggests the selling pressure is cooling off, and buyers are stepping in at these lower valuations.
SPY Weekly Levels: 13-17 AprilSPY Weekly Levels: 13-17 April
Overwhelmed by the response and DM requests for weekly levels, so here are the SPY weekly levels for 13-17 April from my NeuralFlow market-structure map.
Context:
On the April monthly map, SPY has already pushed into the 682-697 equilibrium zone (See last article), which is an important shift because the market is no longer trading from the weaker lower-half structure seen earlier in the month. On the weekly map, price is now around 691, which puts it near the up
IJH - Bullish BounceWhile the market gets volatile, AMEX:IJH is holding its breakout level like a champ. This kind of base-building is exactly what you want to see for a healthy, long-term bull market.
This is a solid "Bullish Consolidation" chart for the iShares Core S&P Mid-Cap ETF ( AMEX:IJH ). It shows a classic breakout-retest-bounce sequence.
Key Level to watch: $66.70 (The Line in the Sand).
As long as this holds, the bulls are in control. 🐂
SPY Forecast - April 2026This is a market-structure map from my NeuralFlow algorithm — educational only. No trade calls, no signals, no recommendations.
Context:
SPY is entering April from the lower half of the monthly structure, with price pressing right into the lower rail area rather than trading near equilibrium. That makes April a decision month: either SPY stabilizes here and rotates back toward balance, or it fails at the lower rail and opens the next downside pocket. The immediate battle is around 660. If that
Bank Nifty Bees Swing Long Setup - Bank Nifty is down 15% so far from the recent highs
- Bankbees is sitting at a crucial discounted zone and in my opinion we could soon see an upside surge of 5-10%
- The swing setup in Bankbees looks highly rewarding instead of buying concentrated stocks the risk to reward ratio in Bank bees looks high
- Those interested in buying Bankbees can target 530-540 as their first buy zone
Silver ETFs are retesting 61.8% level again.Though all the silver ETF's underlying commodity is silver only but taking example of Tata silver ETF here.
After a strong uptrend, price appears to be consolidating within a range following a sharp rejection from the highs. It has already retested 61.8% Fibonacci level multiple times before. Again it is going to retest the same level.
A sustained move above the upper range could shift momentum back to the upside, while a breakdown below the support zone may lead to further downside.
Consideri
iT Crash !! What Next ??💡 Liked the idea?
Then don’t forget to Boost 🚀 it!
Comments are Most Welcome
iT Bees
CMP 35.90
Add on Dips till 32.00
SL CLB 28
Tgt upto 49
Maintain TSL & Keeping Booking/Churning as per Moves
For more insights & trade ideas,
📲 Visit my profile and hit Follow
Warm regards,
Naresh G
SEBI Registered Research Analyst
💬 Comment below if you want me to analyse any stock for you 🔍
Nifty bees will rebound? cmp 269Nippon Nifty Bees cmp 269
Due to the recent US-Iran geopolitical tensions, global markets witnessed panic selling and Indian markets also corrected sharply.
Technically, Nifty Bees is approaching a major demand area and can gradually on dips around 242 - 252
Instead of trying to catch the exact bottom, investors can start accumulating gradually from current levels.
Market corrections caused by geopolitical events are usually temporary and historically such dips have provided good long term e