ETF market
TATA GOLD Next StepGold and gold-linked ETFs can be sensitive to:
📉 Short-Term Risks
Profit booking after strong rallies (can cause dips).
Global macro data (e.g., US rate news, dollar strength) affecting gold prices.
Market corrections can continue before new trend emerges.
📈 Short-Term Positives
Safe-haven demand remains strong — especially with geopolitical uncertainty and inflation concerns.
Corrective pullbacks often become entry points for long-term investors.
Important: Short-term price moves are ha
Future of Global Currency – Key Trends and Directions1. Gradual Shift from Dollar Dominance
The US Dollar has dominated global trade and reserves for decades, but its absolute dominance is slowly declining.
Rising US debt, repeated sanctions, and geopolitical tensions are pushing countries to reduce over-reliance on the dollar.
De-dollarization does not mean the end of the dollar, but a move toward a more multipolar currency system.
In the future, the dollar will remain important, but share of global reserves will decrease.
2. Rise of a Multi
Global Economy Fluctuation Effects1. Impact on Economic Growth and Output
One of the most direct effects of global economic fluctuations is on overall economic growth. During global expansions, increased demand, investment, and trade boost production across countries. Firms expand capacity, governments collect higher tax revenues, and consumers enjoy rising incomes.
Conversely, during global downturns or recessions, growth slows or turns negative. Reduced consumer spending, declining investments, and falling exports cause outp
Eurostoxx remains constructive with bullish consolidation1 Price moved higher first and then shifted into bullish consolidations rather than breaking down
2 Each consolidation formed at a higher level, showing controlled digestion of gains
3 The current phase around 58 to 60 looks calm and orderly, with no visible distribution
4 Silent Flow does not confirm a future breakout here, it confirms that trend risk remains contained
5 The indicator is not about prediction, it is about staying aligned during consolidation
6 Scenario A is continued work within
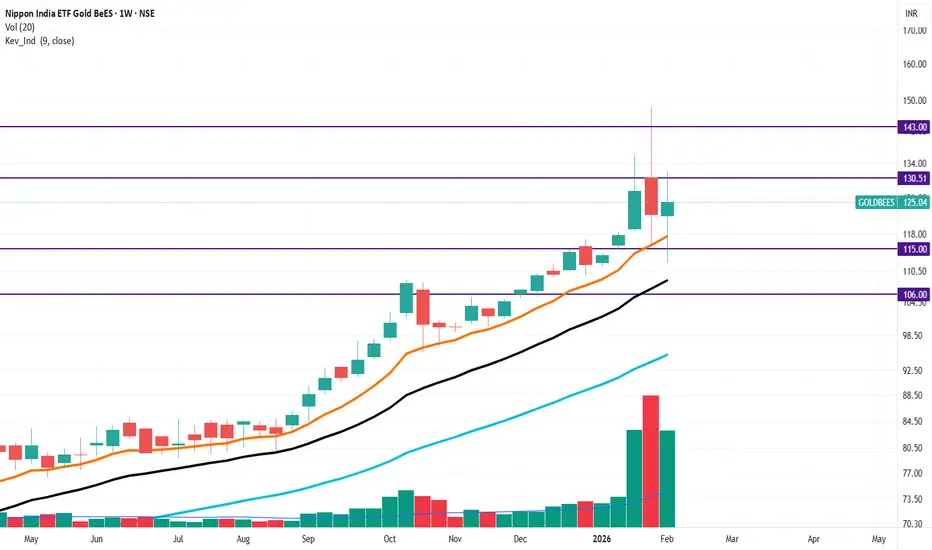
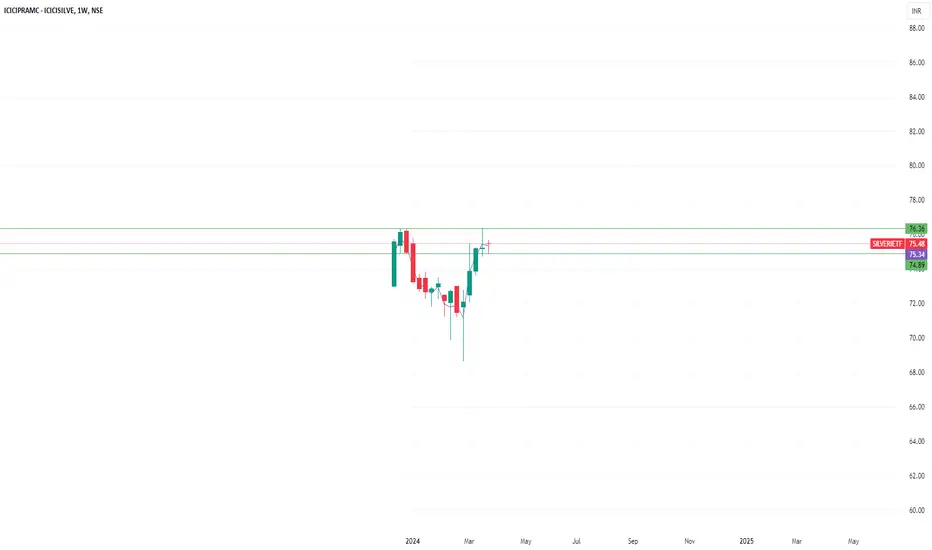
Gold Continues to Shine in the Eyes of Investors
India’s gold exchange-traded funds (ETFs) saw net inflows of $2.49 billion in January 2026, up 98% from December's $1.25 billion, marking the eighth consecutive month of growth.
In 2025, total inflows reached $4.68 billion, a 262% increase from $1.29 billion in 2024; inflows were $310 million in 2023 and $33 million in 2022.
Globally, gold ETFs attracted $19 billion in January, the highest monthly inflow on record, with assets under management hitting $669 billion, up 20% during the month.
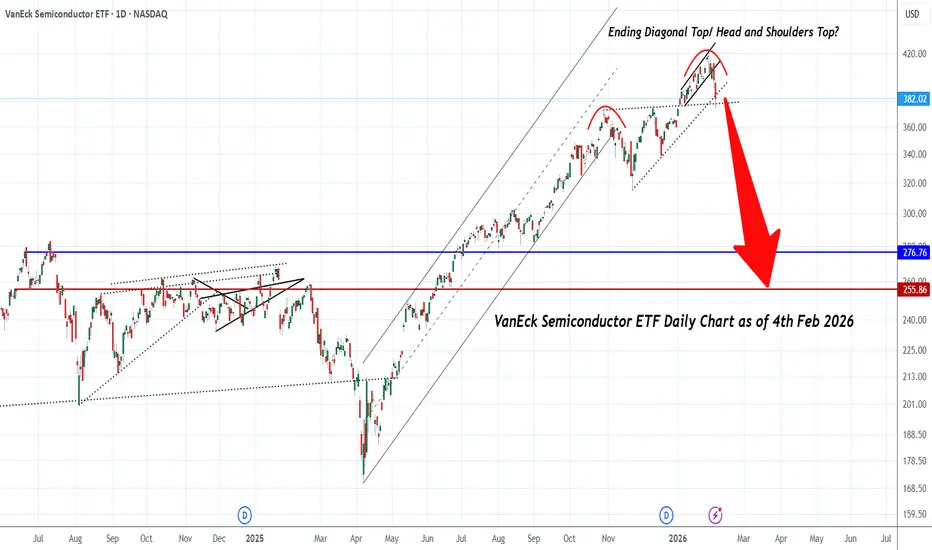
Semiconductor ETF Ending Diagonal Warning !NASDAQ:SMH Daily Chart is showing an Ending Diagona Pattern🐻⚠️
(which can also become a Head and Shoulders Top)
Semiconductor industry is at risk if the AI Bubble bursts as it would lead to Overcapacity
I wonder what happens then...
all Supercycles end like this don't they📉🩸
Invalidation above 420
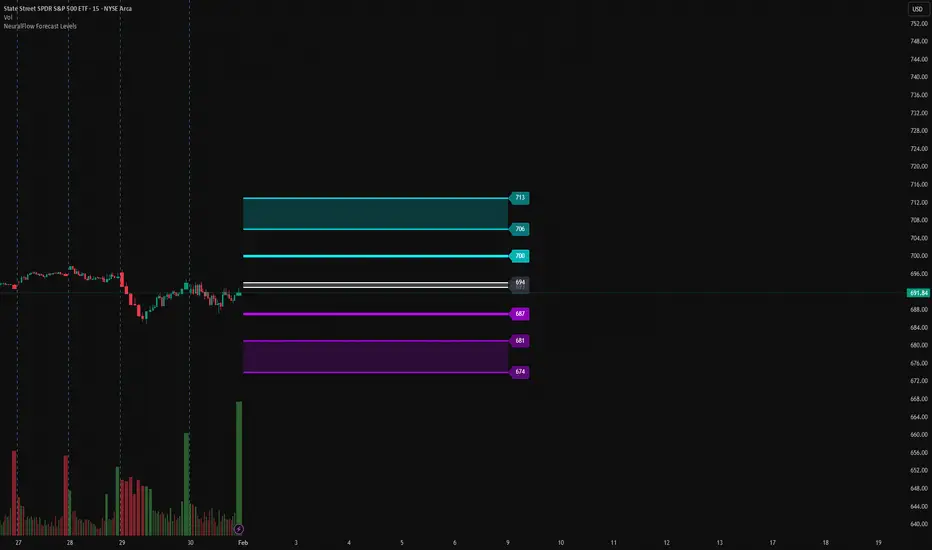
SPY Weekly levels ( 2 Feb - 7 Feb 2026)
Here’s weekly levels for SPY —
1) Bull Case — “Acceptance above equilibrium → reclaim upper rail”
Trigger: Hold above 692.18–692.28, then reclaim and accept above 698.48–698.68.
Targets: 704.98
Stretch (only if momentum persists): 711.28
Notes: The 698.5–698.7 zone is the “decision ceiling.” Clean acceptance above it opens the path to 705 first; 711 is only for a strong trend week.
2) Bear Case — “Rejection at equilibrium / failed reclaim”
Trigger: Lose acceptance at 692.18–692.28 (back belo
When Gold ETFs Crash, Psychology Crashes Faster Than Price!Hello Traders!
When Gold ETFs start falling sharply, the damage doesn’t begin on the chart. It begins in the mind. Prices may drop in percentages, but psychology collapses much faster. Confidence disappears, patience breaks, and long-term thinking gets replaced by fear-driven decisions.
Right now, we are in one of those phases. Headlines are loud. Charts look heavy. And emotions are running far ahead of logic. This is where most investors don’t lose money because Gold failed, they lose because
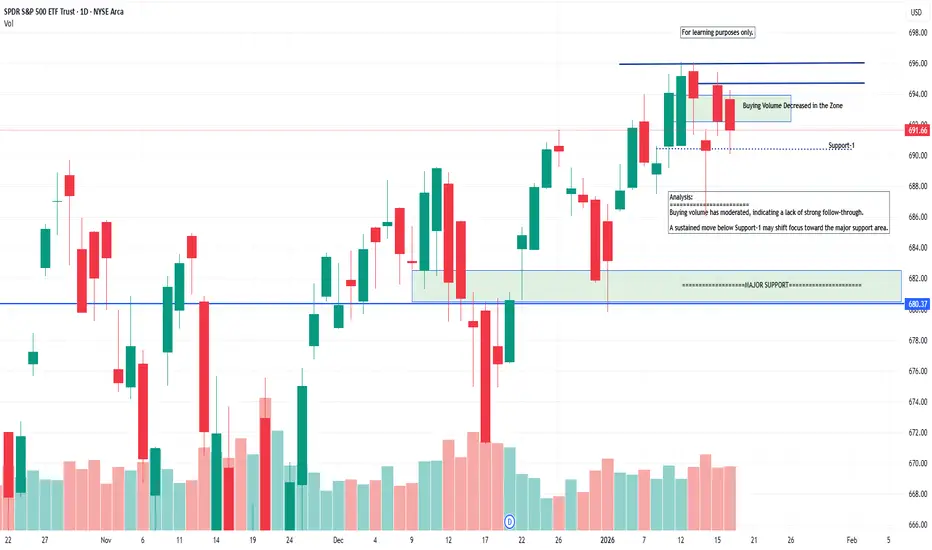
SPY | Daily: Buying Volume Moderates Near Resistance, Support-1 Description
Price has recently moved into a resistance zone, where buying volume appears to be moderating, indicating a lack of strong upside follow-through.
Price is currently hovering near Support-1, making this a key level to monitor in the near term.
Technical Observations
Buying volume has contracted in the recent advance, suggesting reduced participation.
Price remains below the recent supply zone.
Support-1 acts as the immediate reference level.
Major Support below remains the next
Part 4 Learn Institutional TradingPut Options (PE)
A Put Option Buyer expects the market to go down.
A Put Option Seller expects market to remain above the strike.
1. PE Buyer Example
Bank Nifty = 49,000
You buy 48,800 PE at ₹100.
If Bank Nifty falls to 48,500:
Intrinsic value = 48,800 - 48,500 = 300
Profit = 300 - 100 = 200
If Bank Nifty stays above 48,800:
PE buyer loses premium.
2. PE Seller Example
You sell 48,800 PE at ₹100
If Bank Nifty stays above 48,800 → Seller profits full premium.
If it falls → Seller loses
Part 3 Learn Institutional Trading Call Options (CE)
A Call Option Buyer expects the market to go up.
A Call Option Seller expects the market to stay below the strike or fall.
1. CE Buyer Example
Nifty = 22,000
You buy 22,100 CE at ₹50 premium.
If Nifty closes at 22,300 on expiry:
Intrinsic value = 22,300 - 22,100 = 200
Profit = (Intrinsic - Premium) = 200 - 50 = 150
Your profit is ₹150 × lot size.
If Nifty stays below 22,100:
Your loss = premium = ₹50
2. CE Seller Example
You sell 22,100 CE at ₹50
If Nifty stays below
SEBI Trading Regulations and Derivatives Curbs (F&O Clampdowns)1. Introduction: What Is SEBI and Why Regulate Derivatives?
The Securities and Exchange Board of India (SEBI) is India’s capital markets regulator. It’s tasked with protecting investors’ interests, developing markets, and regulating securities trading—including equities, bonds, and derivatives (futures and options). Derivatives are financial contracts whose value is linked to an underlying asset (e.g., stocks, indices). They offer benefits like risk management, price discovery, and market liqui
Retail investor behavior changes post-20251. Retail Markets Are Evolving — Not Repeating Old Patterns
The retail investor segment — once dismissed as undisciplined, speculative, or marginal — has matured into a structurally relevant market force. Retail participation now influences not only trading volumes but also broader asset flows and sentiment. Research in 2025 shows that retail investors are making more strategic decisions and timing markets better than stereotypes suggest, challenging conventional assumptions about “amateur” inv
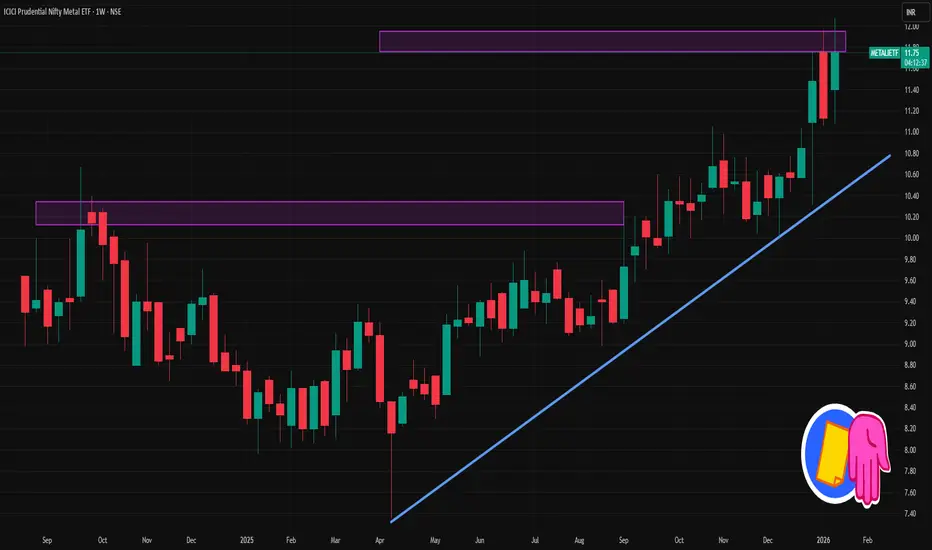
METALIETF 1 Week Time Frame 📊 Current Context (Latest Price)
• The ETF is trading around ₹11.6–₹11.8 (mid‑Jan 2026 data).
📈 Weekly Technical Levels (Pivot‑Based Support / Resistance)
From the weekly pivot point analysis:
Weekly Pivot Point (Center): ~ ₹11.38
This is a key level — above it suggests bullish bias on weekly charts.
Weekly Resistance Levels:
R1: ~ ₹11.71 — first upside target/resistance
R2: ~ ₹12.28 — secondary resistance zone
R3: ~ ₹12.61 — further supply zone if momentum continues
Weekly Support Levels
Option Trading Strategies Key Components of Option Trading
To understand option trading effectively, one must be familiar with its essential components:
Underlying Asset: The stock, index, or commodity on which the option is based
Strike Price: The price at which the asset can be bought or sold
Expiry Date: The date on which the option contract expires
Premium: The cost paid by the option buyer
Lot Size: The fixed quantity of the underlying asset per option contract
Open Interest: The total number of outstanding o
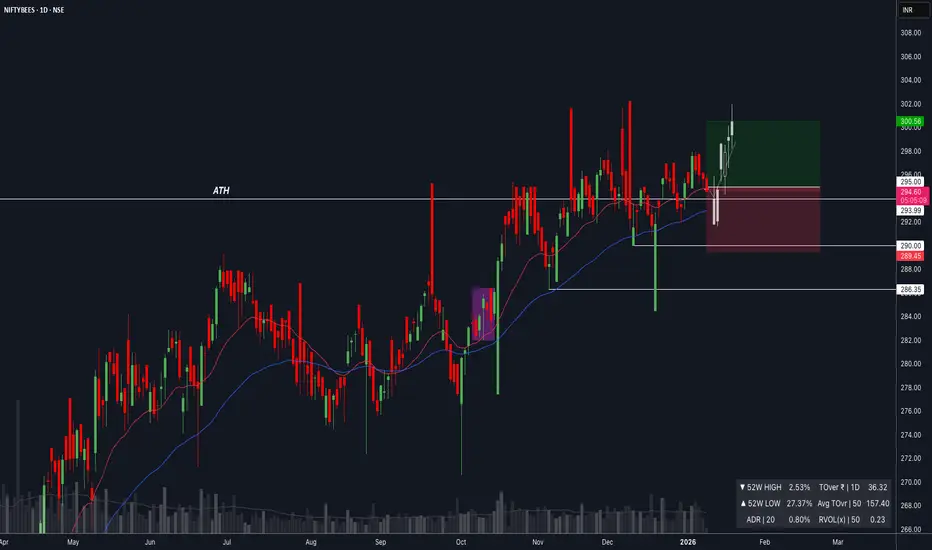
NIFTYBEES : Position to systematically de-risk BPCL tradeToday’s sharp correction in BPCL and the broader Oil & Gas space reflects a classic “geopolitical discount.” With the U.S. threatening a steep 500% tariff, uncertainty around OMC earnings has surged, triggering risk-off positioning across the sector.
In response, I’m de-risking the portfolio by initiating an allocation into Nifty BeES. The Nifty 50 is currently consolidating around its 20-day and 50-day EMAs, a zone that historically acts as a strong demand area. The probability of price findin
Divergence Secrets Pros of Option Trading
✔ Low capital requirement
✔ High leverage
✔ Risk-defined trades
✔ Can profit in any market condition
✔ Wide variety of strategies
✔ Best tool for hedging
✔ High return potential
Cons of Option Trading
✘ Complexity for beginners
✘ Time decay risk
✘ Requires knowledge of volatility
✘ High risk for option sellers
✘ Emotional pressure
✘ Requires active monitoring
Part 10 Trade Like Institutions Option Buyers vs Option Sellers
Understanding the difference is crucial.
Option Buyers
Pay premium.
Have limited risk.
Profit only when market moves strongly in expected direction.
Time works against them due to premium decay.
Option Sellers (Writers)
Receive premium upfront.
Take unlimited or high risk.
Profit when market stays sideways or moves slowly.
Time works in their favor due to time decay.
This structure creates a balanced market between buyers and sellers.
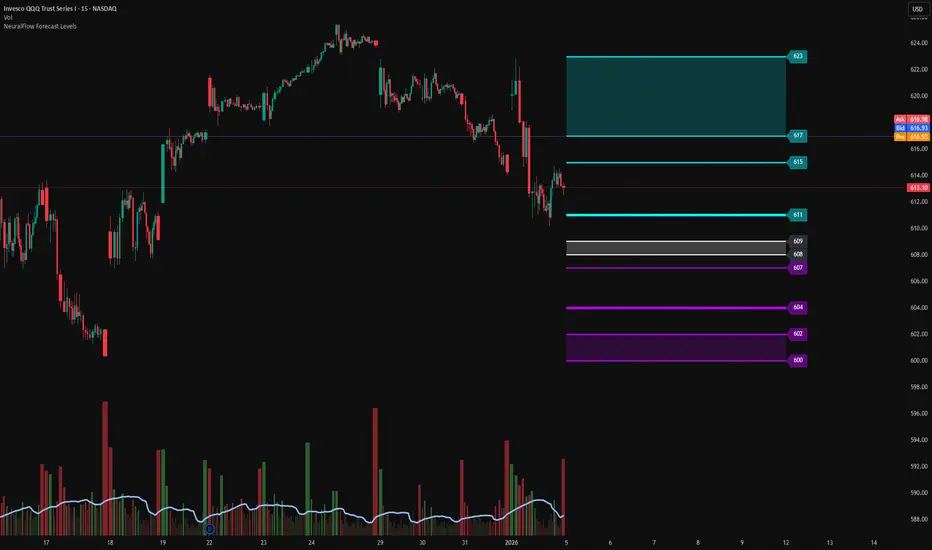
QQQ — Weekly Map (5–10 Jan)1) Bull Case — “Acceptance above equilibrium”
Trigger: Hold above 609 and reclaim 611
Targets: 615 → 617
Stretch (only if momentum persists): 623
2) Bear Case — “Rejection at equilibrium / Failed reclaim”
Trigger: Lose 609 (acceptance back below equilibrium) and lose 604
Targets: 607 → 602
Extension: 600 only in a true unwind
Invalidation
Long thesis weakens on acceptance back below 609
Short thesis weakens on acceptance above 611