ETF market
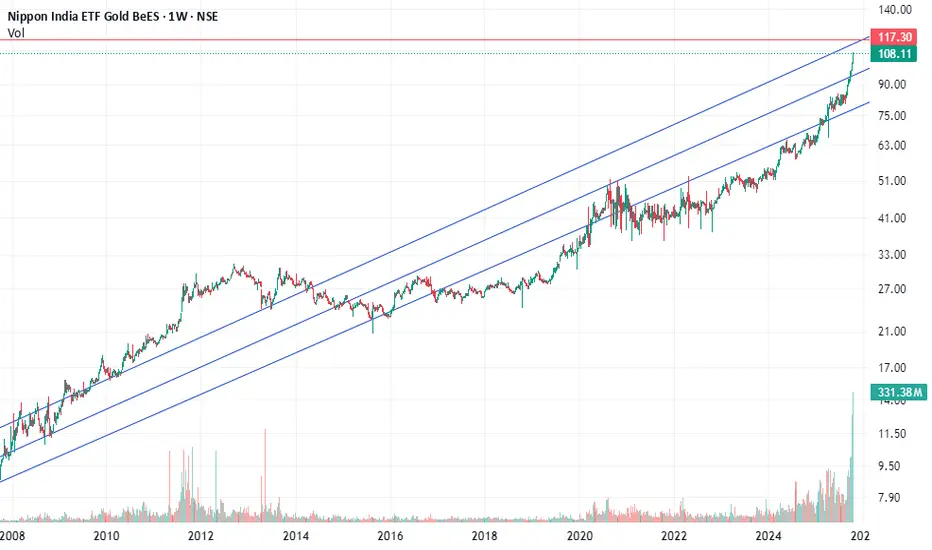
#SilverBees Doubled – Parabolic Move! #SilverBees
🚀 #SIP Strategy Delivers 💯%+ Returns 🥈🔥
On April 4, 2025 , suggested starting SIP in SilverBees at 89.72.
📉 The very next trading day , it dipped to 77.55 , a quick test of conviction.
📈 Since then, it’s been a parabolic rally to 180, with no looking back!
✅ Patience paid off
✅ SIP in commodities works, just like in stocks ( if started at the right time )
✅ Real assets like silver can be powerful wealth creators
⚠️ Going forward, be prepared for volatility.
After
Missed the PSU Bank Rally? #PSUBNKBEES Still Has 24% Upside!CMP: 85.83
PSUBNKBEES has confirmed a classic Inverse Head & Shoulders breakout on the weekly chart , with two consecutive weekly closes above the neckline , a strong technical validation of the pattern.
🔹 Key Levels:
📌 Breakout Level: 84
🔽 Support Zone: 83.45 – 79.50
🔼 Overhead Resistance: 90.30
🎯 Pattern Target: 104 ( ~24% upside from breakout)
This ETF gives broad exposure to PSU banks , making it a lower-risk, sector-wide play for positional investors.
💡 If you are
Commodities & MCX Gold-Silver Trading: A Complete Guide1. Introduction to Commodity Markets
Commodities have been the backbone of trade for centuries. They represent raw materials or primary agricultural products that can be bought, sold, and exchanged. Commodity markets are essential because they provide a platform for producers, consumers, and investors to manage price risks, discover prices transparently, and facilitate investment opportunities.
Globally, commodities are divided into two main types:
Hard Commodities – Naturally mined resources
India’s Growing Derivatives Market & Weekly Expiries1. Introduction
Financial markets act as the lifeblood of an economy, channelizing savings into productive investments. Within these markets, derivatives have emerged as a vital instrument for managing risk, enhancing liquidity, and providing opportunities for speculation and arbitrage. India, which once lagged behind developed economies in terms of derivatives trading, has today become one of the most vibrant derivative markets in the world.
A unique feature of India’s equity derivatives mark
Stock Market is in Risk OnThe US market, as well as some assets, is in a risk-on mode.
Most assets have their own seasonality.
The chart above shows one of them:
In recent years, in the period July-September, a correction began on the US market.
A number of macro indicators also speak in favor of a correction and that it is overdue.
Risk appetite according to Morgan Stanley research has reached a historical maximum
Although seasonality does not guarantee a correction right here and now, but at least it gives reaso
Part 1 Master Candlestick PatternIntroduction to Options (The Foundation)
Options are one of the most powerful financial instruments in modern markets. They provide flexibility, leverage, and protection. At their core, options are derivative contracts, meaning their value is derived from an underlying asset—like a stock, index, currency, or commodity.
Unlike buying stocks directly, which gives you ownership in a company, options give you the right (but not the obligation) to buy or sell an asset at a pre-decided price within
MCHI / IndyRelative Comparison Analysis: MCHI vs. INDY (CMP: 1084)
On the weekly chart, MCHI appears poised to outperform INDY if it sustains above the 1130–1230 zone. The 1330–1390 region may act as an initial supply zone.
Target 1: 1582–1617
(Estimated timeline: ~1 year or more)
Target 2 / Next Supply Zone: 2000–2080
A breakout above the supply zone (1330–1390) could materialize within the next 8 months if momentum builds.
Suggested Stop Loss: 940 (on a weekly closing basis)
This analysis is based
SMHSMH VanEck SemiConductor ETF
CMP: $293.64
In July 2024, SMH posted a high of $281.82, followed by a consolidation phase with a bottom at $170.11.
The recent rally to $302.98 marks a strong recovery from those lows, confirming a breakout above the key resistance zone of $234–262. A retest of this breakout zone is still pending, with the weekly support cluster
$224–235 being an area of concern as gap formed on 12th May 2025.
Until a decisive move emerges, the price action may remain sideways
Part 2 Support and ResistanceWhy Use Options?
Options provide traders with:
Leverage: Control a large position with a smaller investment.
Flexibility: Create strategies for any market scenario.
Risk Management: Hedge against adverse price movements.
Income Generation: Sell options to collect premium.
Simple Options Trading Strategies
These strategies are suitable for beginners. They involve limited positions and simple risk-reward profiles.
Long Call
Outlook: Bullish
How it works: Buy a call option when expecting
Part 2 Ride The Big MovesDisadvantages of Options
Complexity for beginners
Time decay risk (premium can vanish)
Unlimited risk for sellers of uncovered options
Requires active monitoring for effective trading
Tips for Successful Options Trading
Understand the underlying asset thoroughly.
Start with basic strategies like long calls, puts, and covered calls.
Use proper risk management and position sizing.
Keep track of Greeks to understand sensitivity.
Avoid over-leveraging.
Monitor market volatility; high vola
PCR Trading StrategyKey Terms in Options Trading
Before diving into strategies, let’s master some core concepts:
Underlying Asset: The stock/index/commodity on which the option is based.
Strike Price: The price at which the option can be exercised.
Expiration Date: The date on which the option contract ends.
Premium: The price paid by the option buyer to the seller (writer) for the contract.
In-the-Money (ITM): Option has intrinsic value (profitable if exercised).
At-the-Money (ATM): Underlying price = Strik
TEducation
Global Macro Factors in TradingIntroduction
Trading is not just about charts, patterns, or company earnings—it’s also about understanding the bigger picture. This bigger picture is shaped by global macroeconomic factors that influence the flow of money across countries, sectors, and asset classes.
A trader who ignores global macro factors risks missing the underlying forces driving market trends. On the other hand, traders who integrate macroeconomic analysis into their strategies can often anticipate market shifts before t
Part1 Ride The Big Moves Types of Option Traders
1. Speculators
They aim to profit from market direction using options. Their goal is capital gain.
2. Hedgers
They use options to protect investments from unfavorable price movements.
3. Income Traders
They sell options to earn premium income.
Option Trading Strategies
1. Basic Strategies
A. Buying Calls (Bullish)
Used when you expect the stock to rise.
B. Buying Puts (Bearish)
Used when expecting a stock to fall.
C. Covered Call (Neutral to Bullish)
Own the stock
TEducation
Part4 Institutional Trading Tools & Platforms for Trading Options
Popular Brokers in India:
Zerodha
Upstox
Angel One
Groww
ICICI Direct
Option Analysis Tools:
Sensibull
Opstra
QuantsApp
TradingView (for charting)
NSE Option Chain (for open interest and IV analysis)
Important Metrics in Option Trading
1. Open Interest (OI):
Indicates how many contracts are active. Rising OI with price = strength.
2. Implied Volatility (IV):
Represents market expectation of volatility. High IV = expensive options.
3. Option Chain
TEducation
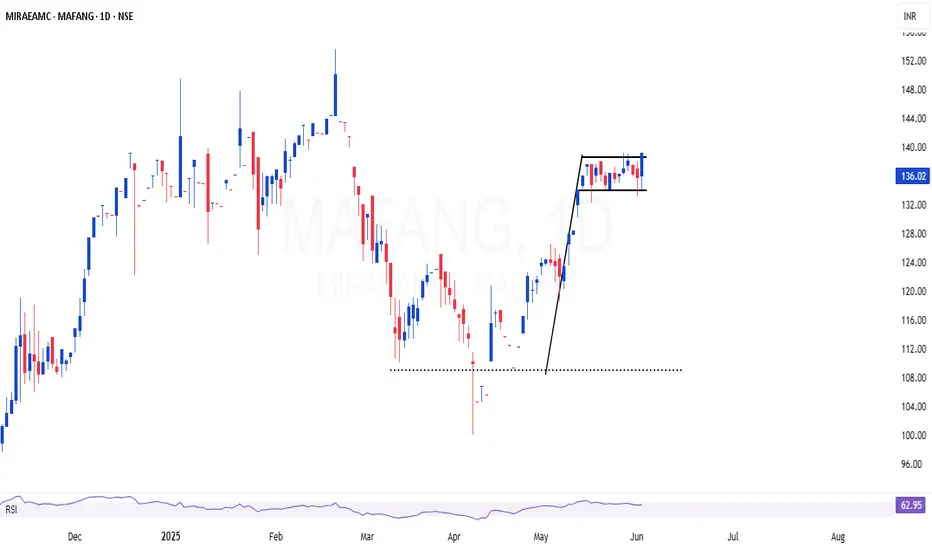
MAFANG | Excellent bull flag setup in top class index fundMAFANG 🏁| Strong buy in top class index fund 👌
-Strong uptrend supported by volume
-Consolidation near all-time highs — bullish structure
-Global tech dominance + AI tailwinds
MAFANG (Meta, Apple, Facebook, Amazon, Netflix, Google) is showing solid momentum and forming a strong technical base in a top-tier index fund.
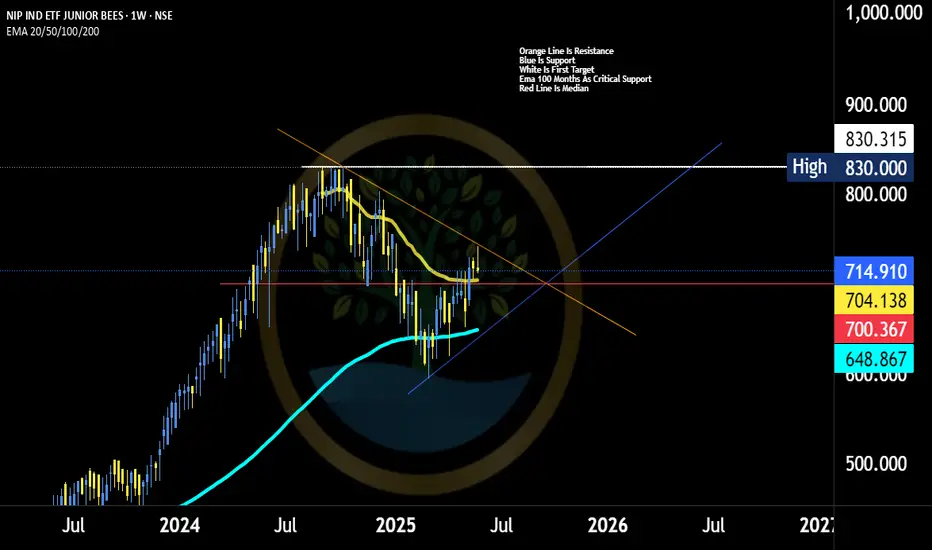
Nippon India Nifty Junior Bees ETF Charts AnalysisThe **Nippon India ETF Nifty Next 50 Junior BeES** is an open-ended exchange-traded fund (ETF) that aims to replicate the performance of the **Nifty Next 50 Index**, which comprises 50 large-cap companies ranked just below the Nifty 50. This ETF offers investors exposure to potential future Nifty 50 constituents, providing a diversified investment avenue in India's equity market.
---
### 🧾 Fund Overview
* **Fund Name:** Nippon India ETF Nifty Next 50 Junior BeES
* **Ticker Symbol:** JUNIORBEE
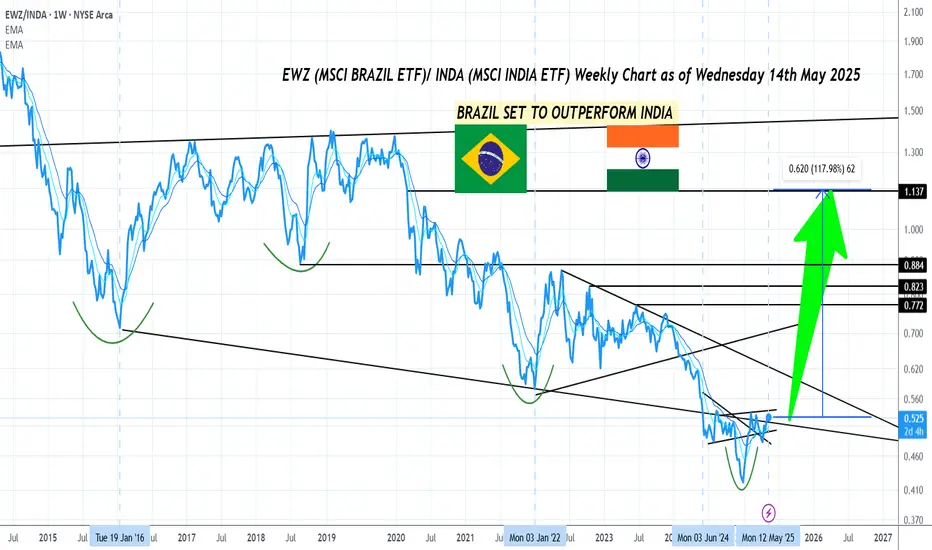
Brazil all set to Outperform India !Attached:
EWZ (MSCI Brazil ETF) vs. INDA (MSCI India ETF) Weekly Ratio Chart as of 14th May 2025
Technical Reasons:
- Brazilian Stock Market has been Underperforming Indian Stock Market since 2020 or roughly for 5 years
- Since last year June 2024 which was India's General Election year and also the same Month where Modi 3.0 won India's Election, since that date had you put money in both India and Brazil both countries have given on par returns
- However the entire period from June 2024 to May
MACD ( Moving Average Convergence Divergence)MACD, which stands for Moving Average Convergence Divergence, is a technical indicator used in financial markets to identify potential trading opportunities and analyze price trends. It measures the relationship between two moving averages of a security's price. The MACD indicator is particularly useful for assessing momentum and determining potential trend reversals.
PCR (Put and Call Ratio) TradingThe Put-Call Ratio (PCR) is a technical indicator that measures the relative volume of put options to call options in a specific timeframe. It's used to gauge overall market sentiment, with a higher PCR indicating more bearish sentiment and a lower PCR suggesting more bullish sentiment.