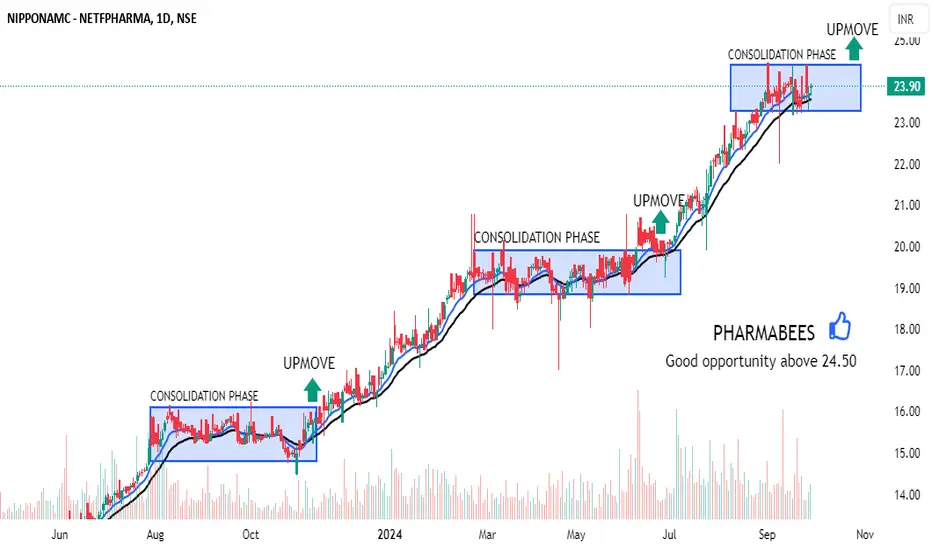
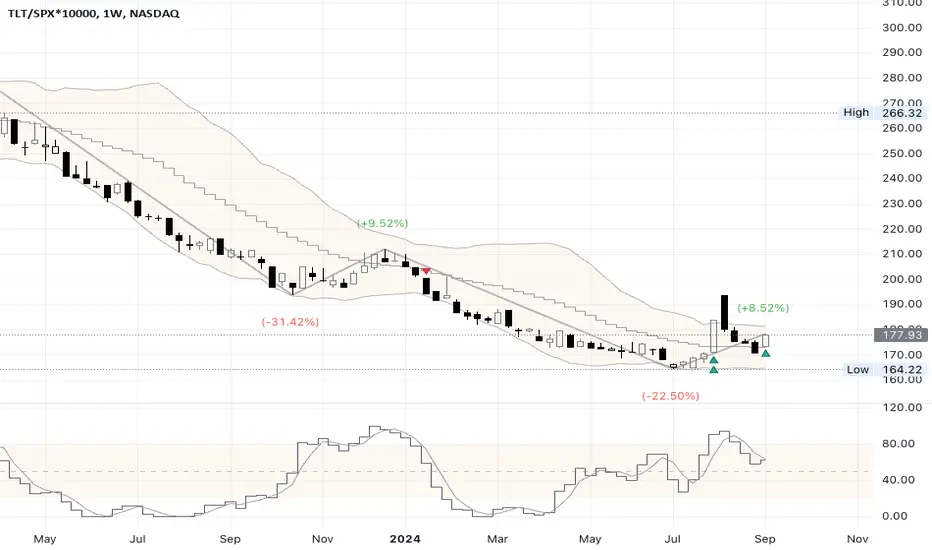
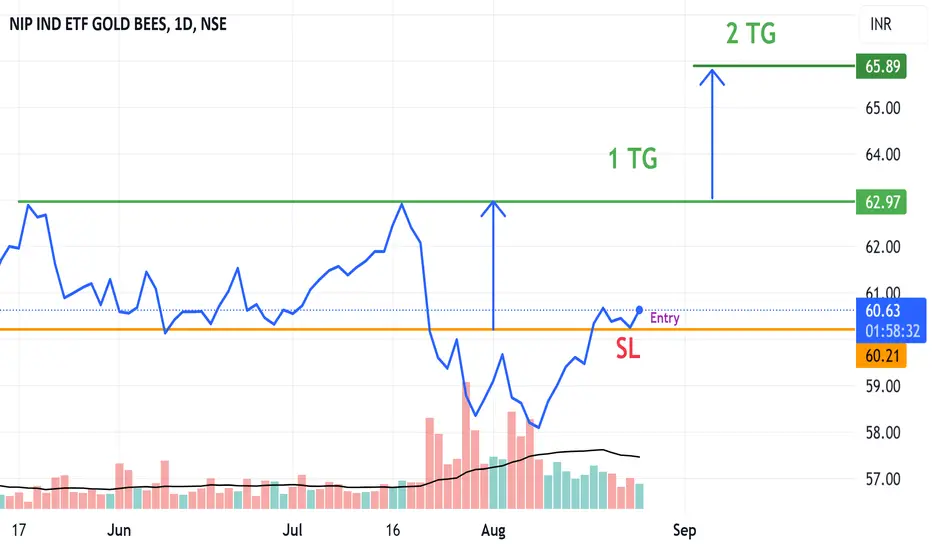
ETF market
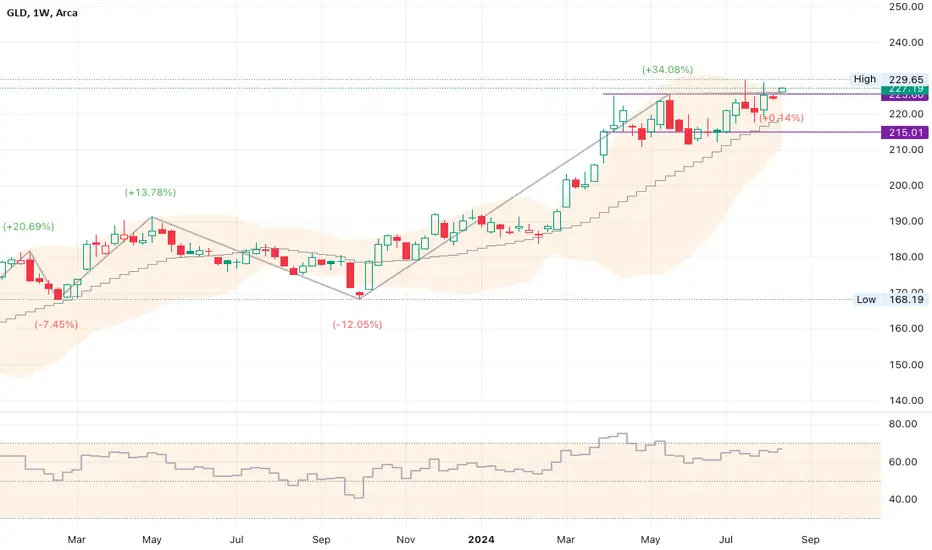
HDFC GOLD ETF If any weekly candle close or sustains below that Red line then chances are high it could move downward to the price marked on the chart ( 61.59 ) within November 2024
Disclaimer:
It's a personal view not a financial advice and I assume no responsibility and liability whatever outcome arises.
Take NIftyBees for Regular profitTake entry at cmp 240
at 220 invest same amount
at 200 invest double amount
at 180 invest double amount
Exit: Get 10 to 15 % profit within 6 month and make exit.
In this ETF you can invest any major amount following by our average making method.
Niftybees Etf provides returns according to NIfty 50
Be invested!
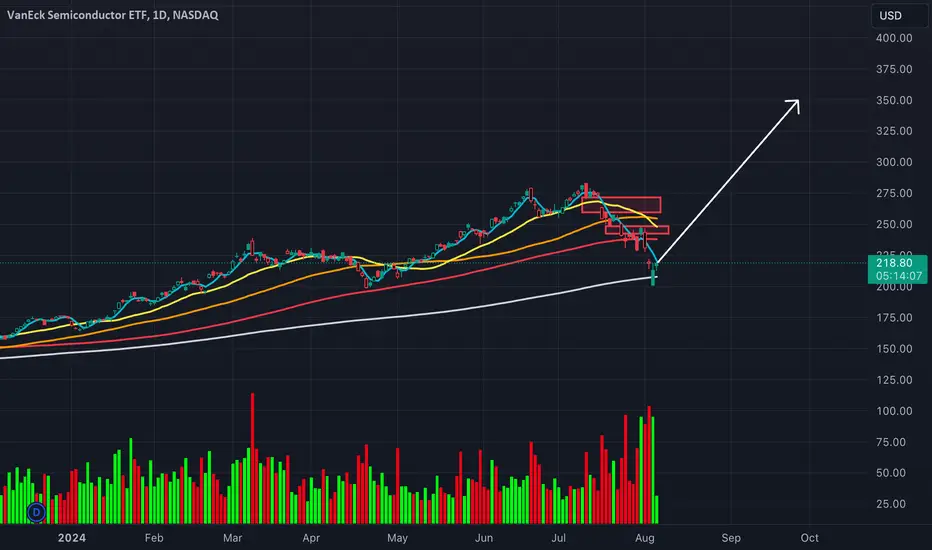
SMH is at Buy levels IMOTechnical analysis shows volume bottoms where needed. Bullish
Here are some other reasons that I feel SMH can go up with NVDA:
-Chip Demand Surge: Global demand for semiconductors across AI, 5G, and automotive sectors is driving growth.
-Top Holdings Perform: Key stocks like NVDA and AMD provide solid fundamentals.
-Bounces on 50-Week MA: ETF has shown resilience with recent bounces off the 50-week moving average.
NFA
BankBees ETFHello,
For the conservatives and portfolio holders this is a BANKBEES technical chart analysis.
Pressure in the banks and take it to the channel bottom. More pressure can lower it to the yellow channel.
Upside looks excellent based on global cues and market sentiments.
Buying:
Closer to the channel bottom.
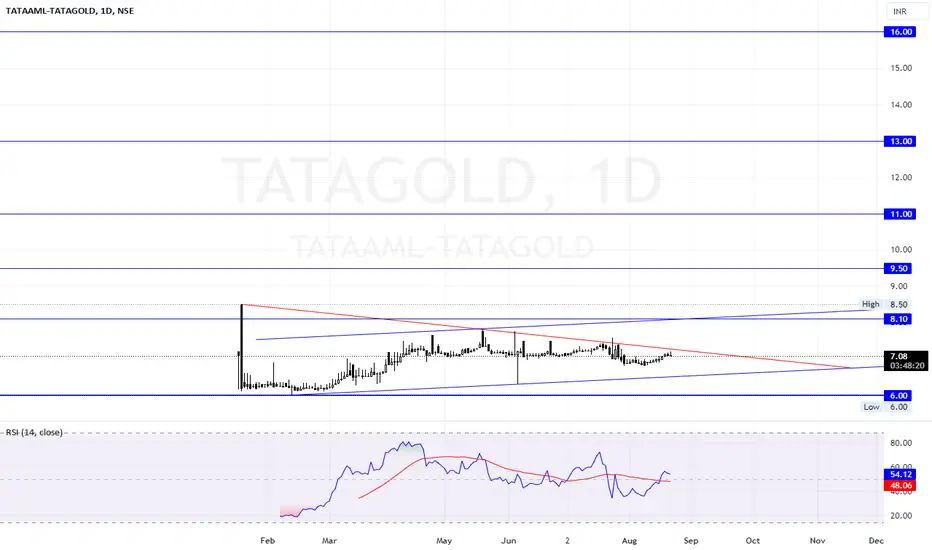
TATAGOLD Ltd. @ 7.08Sector: Miscellaneous
The investment objective of the fund is to generate returns that are in line with the performance of physical gold in domestic prices, subject to tracking err. However, there is no assurance or guarantee that the investment objective of the Scheme will be achieved.
52 Week High 7.80
52 Week Low 0.00
All Time High 7.80
All Time Low 6.00
Book Value Per Share 0.00
Dividend Yield: --
Sector PE 0.00
Face Value 0
Beta 0.02
Mkt Cap (Rs. Cr.) 0
RESISTANCE: 7.8
SUPPORTS: 6
Upside
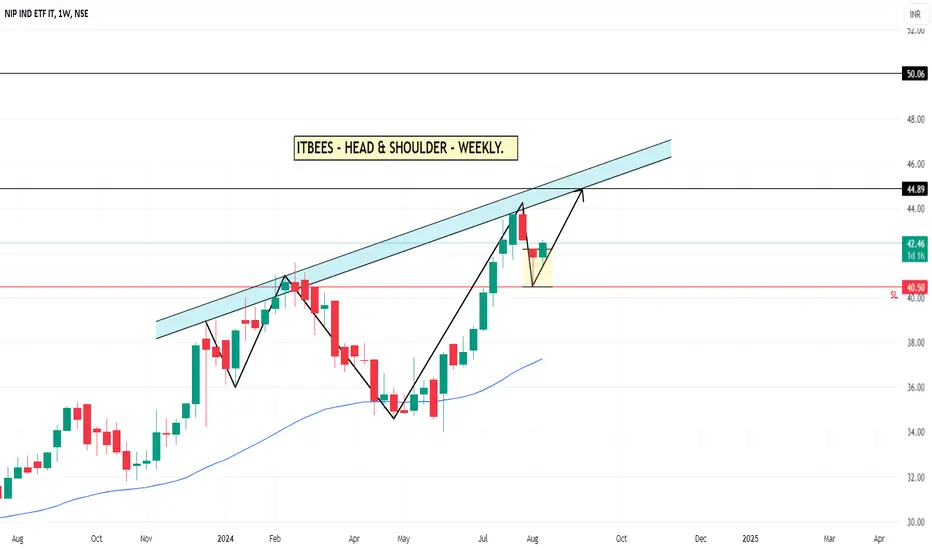
ITBEES - INVERTED HEAD & SHOULDERThe ITBEES ETF is forming a Inverted Head & Shoulders pattern on the weekly chart and is currently developing the second shoulder. Given the potential in the Indian IT sector, there is a strong likelihood that ITBEES will move upward. After breaking the neckline, a retest is expected, followed by positive performance.
ITBEES ETF is closely linked to the Nifty IT Index, which is also displaying a Inverted Head & Shoulders pattern on the weekly chart. I'll share the details of the IT Index chart
FintechZoom QQQ Stock Price AnalysisThe QQQ stock has surged more than 8% from last Monday's lows, which were marred by panic selling due to the collapse of the Japanese stock market and fears of a U.S. recession. Does this rally signal that the fears have dissipated? Not necessarily.
Currently, the price is hovering near a resistance zone formed by the median line of the channel (indicated in yellow) and the descending fan line. It's no surprise that the market is showing signs of uncertainty—it's not just about the release of