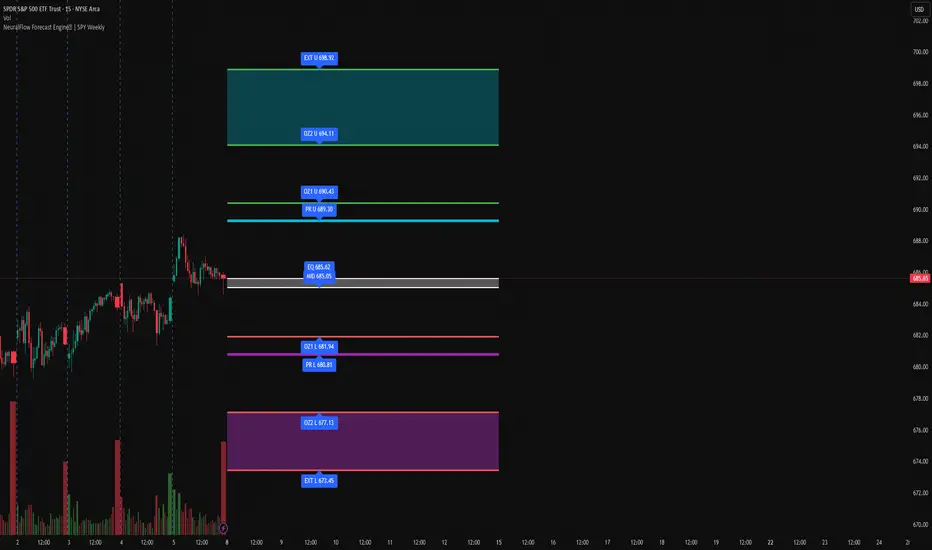
SPY — Weekly Map (5–10 Jan)Here's this week's levels for SPY -
1) Bull Case — “Acceptance above equilibrium”
Trigger: Hold above 681 and reclaim 685
Targets: 687 → 690
Stretch (only if momentum persists): 696
2) Bear Case — “Rejection at equilibrium / Failed reclaim”
Trigger: Lose 681 (acceptance back below equilibrium) and lose 676
Targets: 678 → 672
Extension: 669 only in a true unwind
Invalidation
Long thesis weakens on acceptance back below 681
Short thesis weakens on acceptance above 685
ETF market
qqqQQQ Technical Analysis
QQQ is currently respecting key technical levels. Price action shows a clear reaction around support and resistance zones, with structure remaining intact.
As long as price holds above support, bullish continuation toward the next resistance is possible. A breakdown below support may lead to a deeper pullback.
This analysis is based purely on price action and technical structure.
Always wait for confirmation and manage risk properly.
📌 Not financial advice.
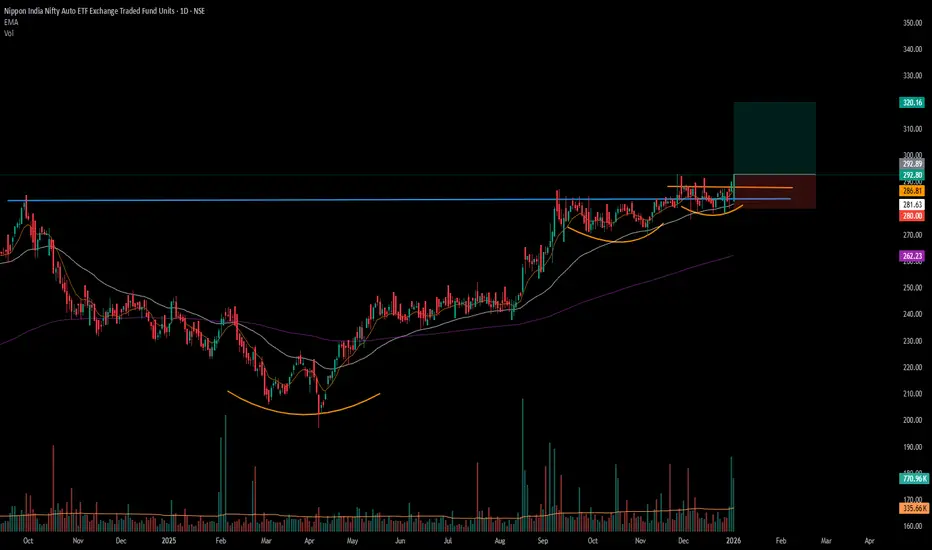
#AUTOBEES - VCP BO in DTFScript: AUTOBEES
Key highlights: 💡⚡
📈 VCP BO in DTF
📈 Volume spike seen during Breakout
📈 MACD Bounce
📈 RS Line making 52WH
📈 Sector is strong
If you have any doubts about the setup, drop a comment and I’ll reply.
✅Boost and follow to never miss a new idea! ✅
⚠️ Important: Always Exit the trade before any Event.
⚠️ Important: Always maintain your Risk:Reward Ratio as 1:2, with this RR, you only need a 33% win rate to Breakeven.
⚠️Disclaimer: I am not SEBI Registered Advisor. My posts are p
Emerging Trends in the Indian Trading Market1. Rise of Retail Participation
One of the most defining trends in the Indian trading market is the massive increase in retail investor participation. Easy access to smartphones, low-cost internet, and user-friendly trading platforms have democratized market access. Millions of first-time traders have entered equities, derivatives, and commodities, especially after the pandemic period. Discount brokerages offering zero or low brokerage fees have further accelerated this shift. Retail traders ar
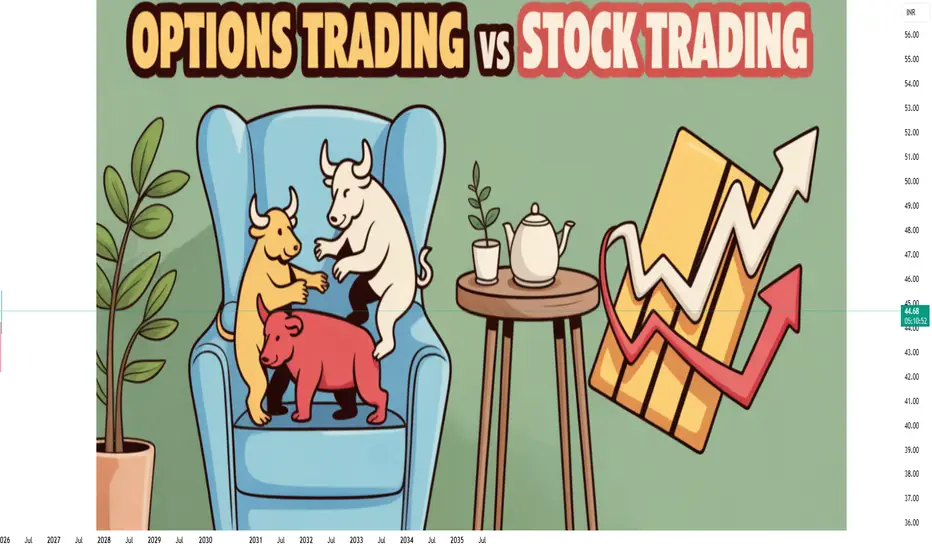
Option Trading vs. Stock TradingUnderstanding Stock Trading
Stock trading involves buying and selling shares of publicly listed companies. When an investor buys a stock, they gain partial ownership in the company along with associated rights such as voting and dividends (if declared). Stock trading can be done for short-term gains (intraday, swing trading) or long-term wealth creation (investing).
The primary driver of stock prices is the company’s fundamentals—earnings, growth prospects, management quality, and industry tre
Essential Infrastructure Investments: Foundation for SustainableIntroduction
Essential infrastructure investments form the backbone of economic development, social well-being, and long-term national competitiveness. Infrastructure is not limited to roads and bridges; it includes power systems, water supply, digital networks, transport corridors, healthcare facilities, and urban services that enable societies and economies to function efficiently. In an era of rapid urbanization, climate change, technological disruption, and rising population demands—especia
Blockchain and Tokenized AssetsRedefining Ownership, Finance, and the Global Economy
Blockchain technology and tokenized assets represent one of the most transformative shifts in the modern financial and economic landscape. What began as the underlying infrastructure for cryptocurrencies has evolved into a powerful system capable of redefining ownership, trust, and value exchange across industries. At its core, blockchain introduces a decentralized, transparent, and immutable ledger, while tokenization converts real-world an
Part 12 Trading Master Class In-the-Money (ITM), At-the-Money (ATM), Out-of-the-Money (OTM)
These terms describe the relation between strike price and market price.
Call options:
ITM: market price > strike
ATM: market price = strike
OTM: market price < strike
Put options:
ITM: market price < strike
ATM: market price = strike
OTM: market price > strike
ITM options cost more because they already hold intrinsic value.
SPY Weekly AI Levels — Holiday Week (Dec 22)This is a holiday-shortened, low-liquidity week. Expect rotation over trend unless price shows clear acceptance beyond key structural levels. These are contextual AI levels, not trade signals.
Core Structure (Balance Zone)
Equilibrium (EQ): 678.45
Mid-Equilibrium: 677.38
As long as price rotates around this zone, mean-reversion dominates and directional conviction remains limited.
Predictive Rails (Decision Zone)
Upper Rail: 683.48
Lower Rail: 671.27
Acceptance outside the rails shifts the
Is Friday Rally over for SPY?This move looks exhaustive, not a breakout.
Price is stalling into upper supply with no acceptance.
Key Levels (Trade Map)
Immediate Resistance (Upside Reclaim)
680.83 → first reclaim / flip level
684.06 → rail resistance (only after reclaim)
686.98 → equilibrium check
690.60 → value ceiling
Downside Targets (From 679)
675.91 → next support / demand pocket
667.76 → extreme flush zone
Friday Bias (Simple Rules)
Below 680.83 → downside continuation favored
Targets: 675.91 → 667.76
Reclaim 68
SPY Weekly Balance Map | Dec 15–19SPY enters the week with a stable higher - time frame structure. Last week’s equilibrium framework held with precision, as price remained bracketed between predictive rails and rotational behavior dominated (see my previous article for last week's bands and how market played out). This week opens with updated bands while balance conditions remain intact.
The focus remains on acceptance versus rejection at clearly defined decision boundaries rather than directional assumption.
Market Structure
Part 12 Trading Master Class Buyers vs Sellers
Every option contract has two sides:
Option Buyer
Pays a premium.
Has limited risk (only premium loss).
Has unlimited profit potential.
Needs significant price movement to make money.
Option Seller/Writer
Receives the premium.
Has limited profit (premium received).
Has high or unlimited risk.
Benefits when price stays stable or moves slightly.
Most professional traders prefer selling options because time works in their favour.
Investing in Shares: A Comprehensive Overview1. Understanding Shares
Shares, also called stocks or equities, are financial instruments that represent ownership in a corporation. Each share entitles the holder to a fraction of the company's profits, typically distributed as dividends, and gives them voting rights in certain corporate decisions, depending on the type of share held. Shares are issued by companies to raise capital for business expansion, research, or debt repayment. In return, investors hope to earn returns through price appr
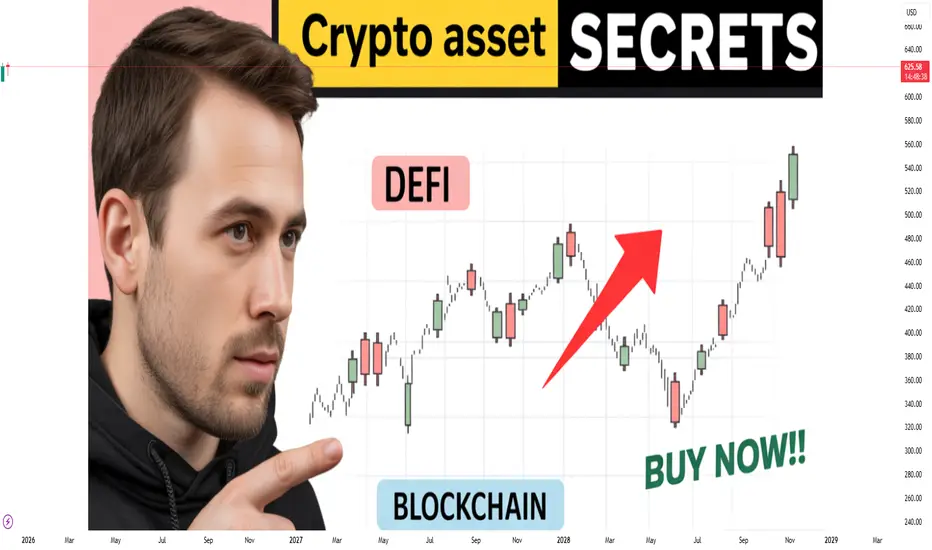
Introduction: Understanding Crypto Assets1. Blockchain Fundamentals: The Hidden Architecture
At the heart of crypto assets is blockchain technology—a distributed ledger system. The “secret” here is its simplicity combined with complexity:
Decentralization: Unlike traditional finance, no single entity controls the ledger. Control is distributed across a network of nodes, enhancing security.
Immutability: Once a transaction is recorded, it cannot be altered. This provides transparency and reduces fraud.
Consensus Mechanisms: Proof of
TATAGOLD What next do1. Over the last 3 months, the NAV of Tata Gold ETF rose from roughly ₹ ~10.20–10.90 (around early September 2025) to around ₹ 12.50 by early December 2025.
2. That implies a 3-month return of roughly +20–23%, which matches published data showing ~23-24% 3-month return.
3. The 52-week low was ~₹ 7.11 and high ~₹ 14.00 (or near that) — showing that the price nearly doubled from the low earlier in the 12-month period.
4. Recent momentum looks strong: after rising steadily from September to N
SPY Weekly Levels Forecast : Week of Dec 9–13, 2025SPY enters the week inside a narrow equilibrium coil, with predictive rails compressed and value clustering around 685 (See chart for all levels marked in labels). The response at these levels will determine whether price continues to rotate or transitions into directional expansion.
Market Structure and Balance
Price currently remains bracketed between the upper predictive rail at 689.30 and the lower predictive rail at 680.81. Until either boundary is accepted on volume, the dominant expe
SPY — NeuralFlow Forecast Bands | Friday Market MapWhat NeuralFlow™ Is?
NeuralFlow operates on proprietary, institution-grade Artificial Intelligence models trained specifically to map where price is statistically inclined to rebalance — independent of trader sentiment or bias.
No volatility envelopes. No moving-average derivatives. No pattern recognition overlays. Just market-native balance architecture, revealed.
NeuralFlow does not chase breakout logic — it isolates post-expansion gravity zones where price is mathematically pulled back into b
NIFTY: HOW RETAILERS CAN CAPTURE A BULL RUN guys, best way we recommend for retailers to capture big moves is to invest in NIFTY BEES"
this is an etf which has very less volatality as compared to nifty but gives moves in accordance with nifty. retailers can use MTF in this fund...they can get leverage 3x of their capital
NASDAQ QQQ vs Global Liquidity IndexIts a chart showing NASDAQ QQQ vs Global Liquidity Index (GLI). When ever the GLI increases the assets(Stocks, Gold, BTC) increases, but when there is liquidity crunch then the assets falls quickly.
You can get the GLI from the financial Indicator from Quantitively Adapt (User)
ITBEES Long The chart shows a simple story of how price and RSI are behaving together. The shaded boxes mark two past trade setups. In the first setup, price formed a bottom, RSI started rising from oversold levels, and after that the price moved up strongly. The second shaded box on the right shows a similar type of setup forming again. Price has bounced from the recent low and is now trying to move above the previous small consolidation.
The arrows on the RSI highlight two important points. Both arrows s
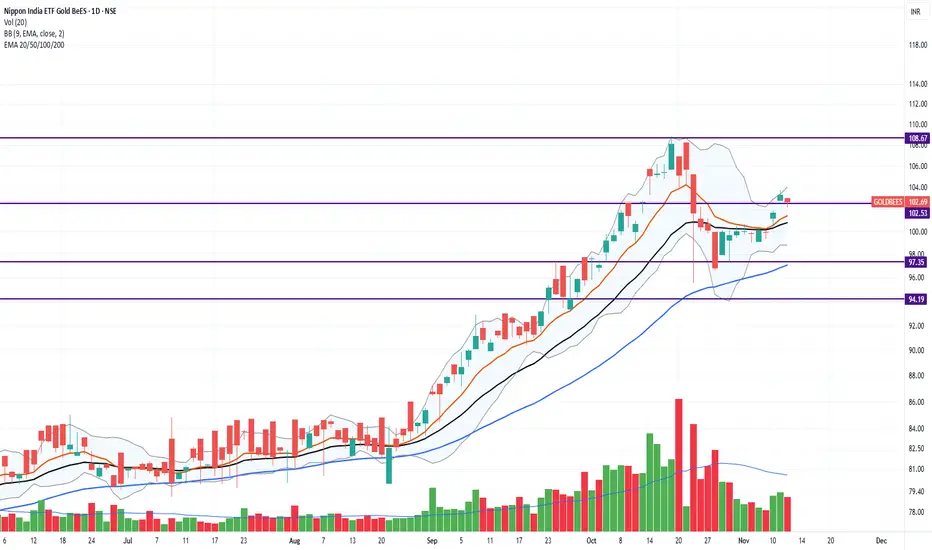
Gold ETfs Vs Digital GoldNippon India ETF Gold BeES
GOLDBEES is trading near the important resistance level of 102.
Current price level is above all the key EMAs like 9 EMA(Orange Line), 21 EMA (Black Line) and 50 EMA (Blue Line).
There is an increased interest among investors toward Gold products like ETFs and Digital Gold.
However, there is a lot of misconception surrounding the difference between the two products.
Digital gold allows you to buy and sell physical gold online through digital platforms, while
How to Understand Candlestick Patterns1. The Structure of a Candlestick
A single candlestick consists of four main components:
Open: The price at which the asset began trading during that time period.
Close: The price at which the asset finished trading during that period.
High: The highest price reached within that timeframe.
Low: The lowest price reached within that timeframe.
The body of the candlestick represents the range between the open and close prices.
The wicks or shadows (thin lines above and below the body) show th
Carbon Credit and ESG Trading: A New Era of Sustainable Finance1. Understanding Carbon Credits
A carbon credit represents a permit that allows a company or organization to emit a certain amount of carbon dioxide (CO₂) or other greenhouse gases (GHGs). Typically, one carbon credit equals one metric ton of CO₂ equivalent (CO₂e). The concept emerged from the Kyoto Protocol (1997) and was further refined under the Paris Agreement (2015), both of which aimed to create global mechanisms to reduce emissions.
There are two primary carbon markets:
Compliance Mark