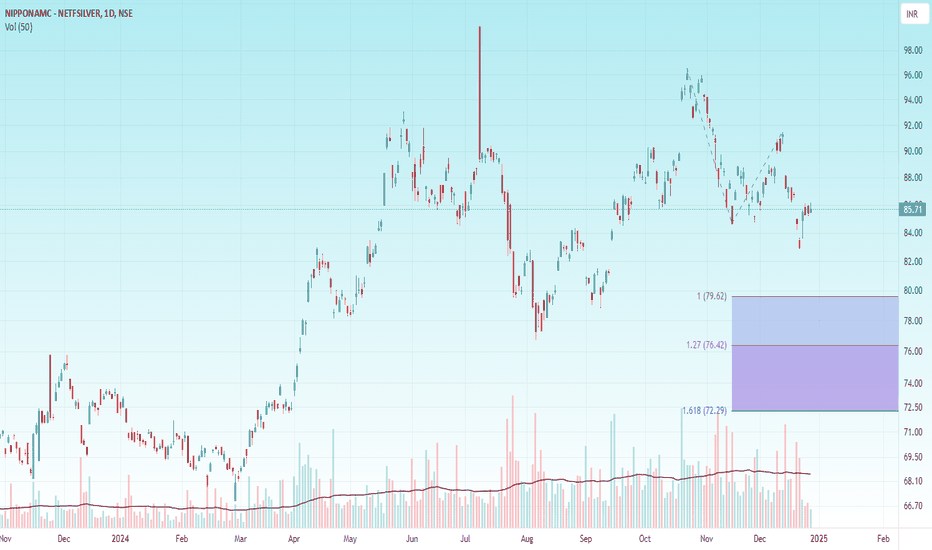
SILVERHello & welcome to this analysis
In the short term it appears to be under pressure mainly due to the strength seen in DXY.
In the medium to long term its in the completion of a very large breakout, we might not see the current price level for decades after 1-2 quarters of 2025
All the best for your Investing and Trading
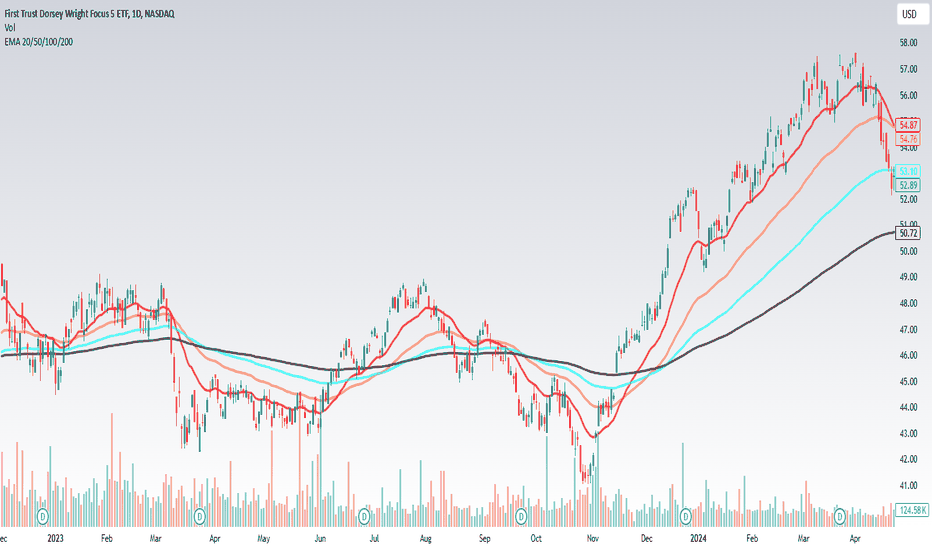
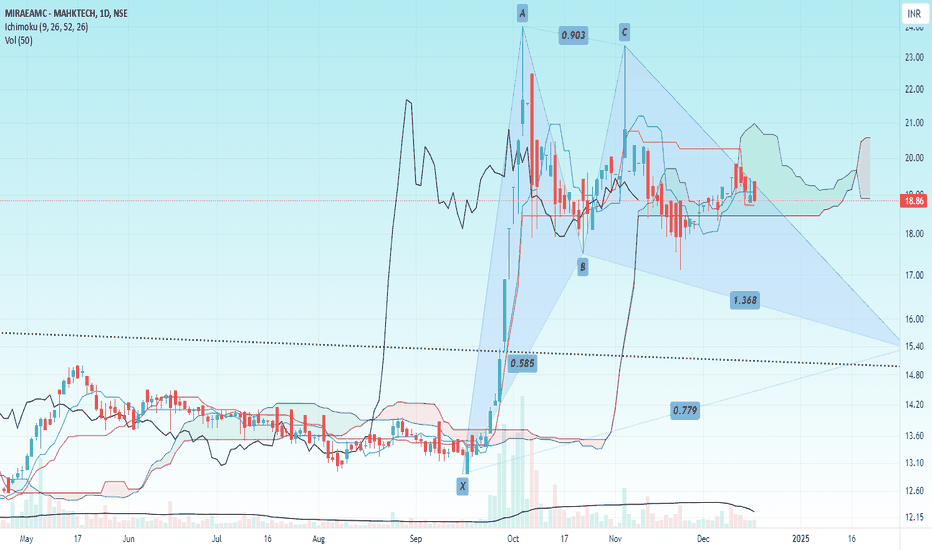
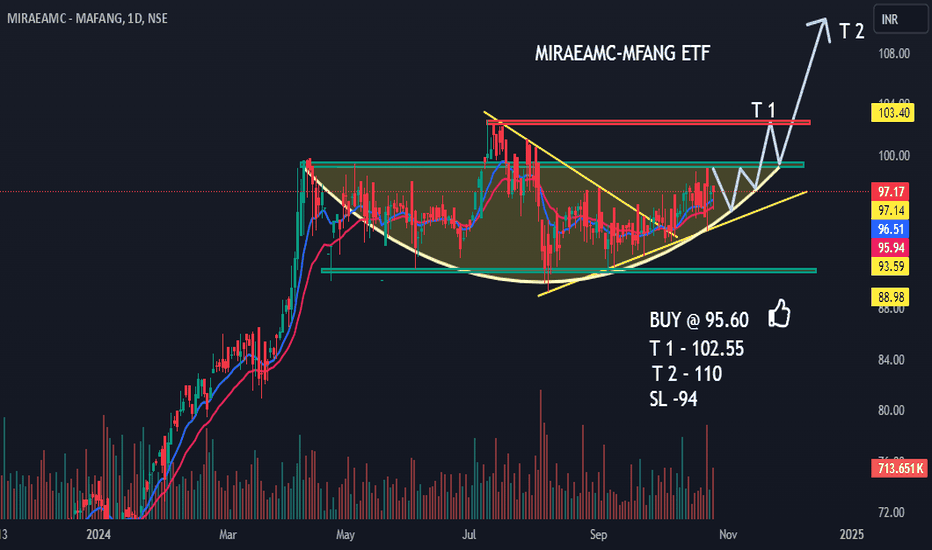
ETF market
Technical Trading Technical analysis is a trading strategy used by investors to identify new investment possibilities. To anticipate future price movements of stocks or other assets, for example, past price and volume data is studied and shown on graphic charts, where trends, patterns, and technical indicators can be identified.
There is virtually no limit to the profit potential of technical analysis. Profitability within the discipline largely depends on the trader's expertise, adherence to tried and tested strategies, and the amount of risk undertaken and capital employed by the trader.
IT Bees looks good for a positional medium-term play.#tradeideas #ITbees.
Looks good for a positional medium-term play.
-Nifty IT along with BN is supporting Nifty.
-IT sector shows resilience in this market fall.
- Positivity in US market (NASDAQ)
- Easy to get in and out. Good liquidity.
What could go wrong?
- Overall bearish sentiments in our market. If NIFTY were to fall further, IT would follow suit.
- Dependent on NASDAQ move, so pay close attention
to US markets.
Overall this is a low-risk setup. Risk is only 6.5-7%. Build positions sensibly. Risk management is key. Do not put all your money at once. And respect the SL. Building this position early because if we were to get a reversal soon then the rewards will be good. If the reversal is not sustained then our risk is still less.
This is just a view and chart shared for educational purposes only.
Midcap Momentum: Will Resistance Break or Bears Take Control?This chart depicts a technical analysis of the NIP IND ETF MIDCAP 150, likely with daily candlesticks. Here's a detailed breakdown:
### Key Observations:
1. **Support and Resistance Levels**:
- **R3 (Blue)**: Significant resistance near 220.82.
- **R2 (Green)**: Intermediate resistance around 215.99.
- **R1 (Orange)**: Support at 209.87.
- **S1 and S2 (Yellow and Purple)**: Further support levels at 204.00 and 199.79, respectively.
2. **200-Day SMA**:
- The blue line represents the 200-day Simple Moving Average (SMA) at 206.18, a crucial long-term trend indicator. The price is currently above the SMA, suggesting bullish momentum in the longer term.
3. **Price Action**:
- The price recently rebounded from a support zone near 204 and is now testing intermediate resistance levels.
- The formation of red candles near resistance (R2) indicates selling pressure, but a break above could indicate further upside potential.
4. **RSI Indicator**:
- The RSI (Relative Strength Index) at 39.20 is in the lower neutral zone, suggesting slight bearish momentum. However, it is rising, indicating potential recovery.
### Potential Outlook:
- **Bullish Scenario**:
- A close above 215.99 (R2) could lead to a retest of 220.82 (R3). Sustained momentum above R3 could indicate further upside.
- **Bearish Scenario**:
- Failure to hold above 209.87 (R1) might see the price revisit 204.00 (S1) or even 199.79 (S2).
### Recommendation:
- Monitor RSI and the price reaction near resistance levels.
- For a long trade, consider entering on a breakout above 215.99
- For a short trade, watch for a rejection at current levels and target supports near 204.00 or 200.
Would you like further analysis or specific trade setups based on this chart? Comment down
Buying Opportunity in NIFTY50 ETFsNippon India ETF Nifty Bees is in a downtrend for a long time
It has broken the important support level of 264.
It has corrected 10% from the peak value of 294.
Important support levels: 257, 251, 242, 235
How to trade NIFTYBEES?
Buy 25% of the total investment at the current level.
Buy another 25% if the Nifty slides further and settles on the next support level 251.
The remaining buying should happen on the subsequent support levels.
The target may be 30 points (294 level).
HDFC GOLD ETF If any weekly candle close or sustains below that Red line then chances are high it could move downward to the price marked on the chart ( 61.59 ) within November 2024
Disclaimer:
It's a personal view not a financial advice and I assume no responsibility and liability whatever outcome arises.
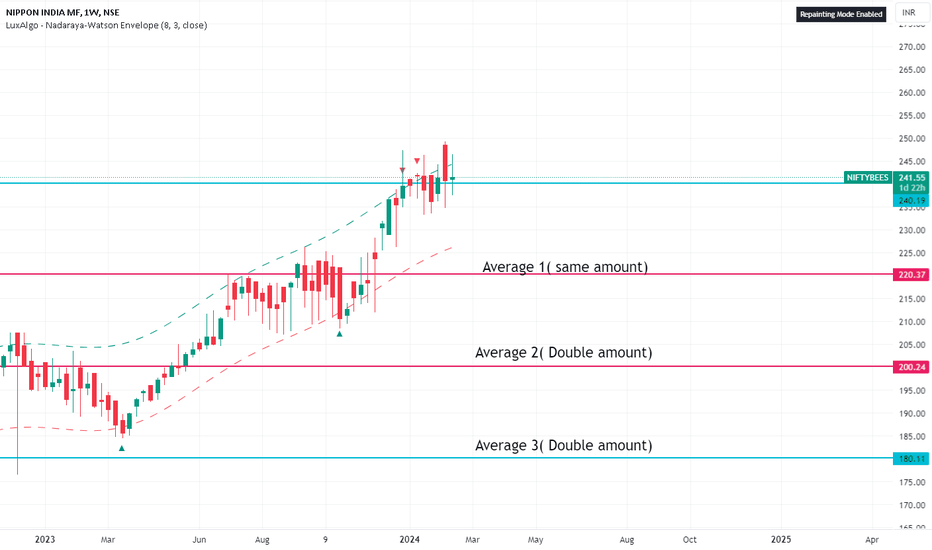
Take NIftyBees for Regular profitTake entry at cmp 240
at 220 invest same amount
at 200 invest double amount
at 180 invest double amount
Exit: Get 10 to 15 % profit within 6 month and make exit.
In this ETF you can invest any major amount following by our average making method.
Niftybees Etf provides returns according to NIfty 50
Be invested!