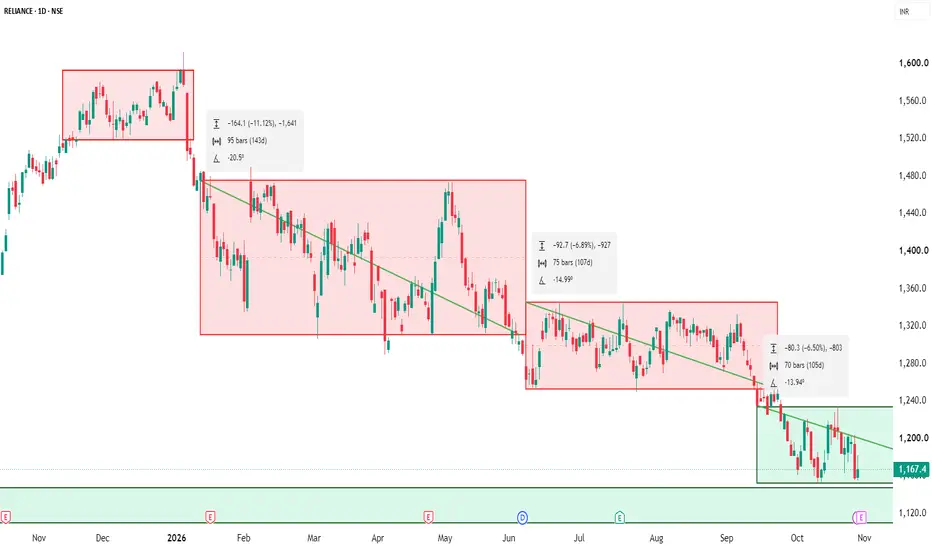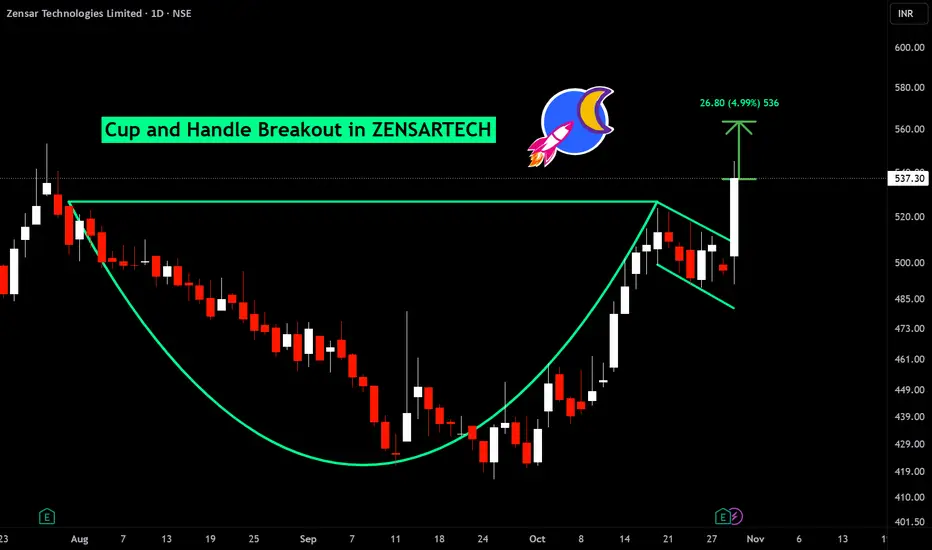
RELIANCE - Range cum Box TheoryMarket Structure: Reliance remains in a bearish structure, forming successive lower trading ranges and breakdowns.
Key Levels
Current Support Box: ₹1,120–₹1,150
Immediate Resistance: ₹1,230
Trading Scenarios
📈 Bullish Setup: A sustained daily close above ₹1,230, followed by a successful retest, ma
Where the world does markets
Join 100 million traders and investors taking the future into their own hands.
Get started for free$0 forever, no credit card needed

Supercharged
Supercharts

BUY TODAY SELL TOMORROW for 5%DON’T HAVE TIME TO MANAGE YOUR TRADES?
- Take BTST trades at 3:25 pm every day
- Try to exit by taking 4-7% profit of each trade
- SL can also be maintained as closing below the low of the breakout candle
Now, why do I prefer BTST over swing trades? The primary reason is that I have observed that
Voltas Ltd (NSE: VOLTAS) | Technical & Fundamental OutlookTechnical View
Voltas is attempting a recovery after a prolonged weekly downtrend. A sustained weekly close above ₹1,012 could initiate a relief rally, but ₹1,050 remains the first major resistance zone. The descending trendline is still a hurdle.
Key Levels
Support: ₹968 → ₹930 → ₹850
Res
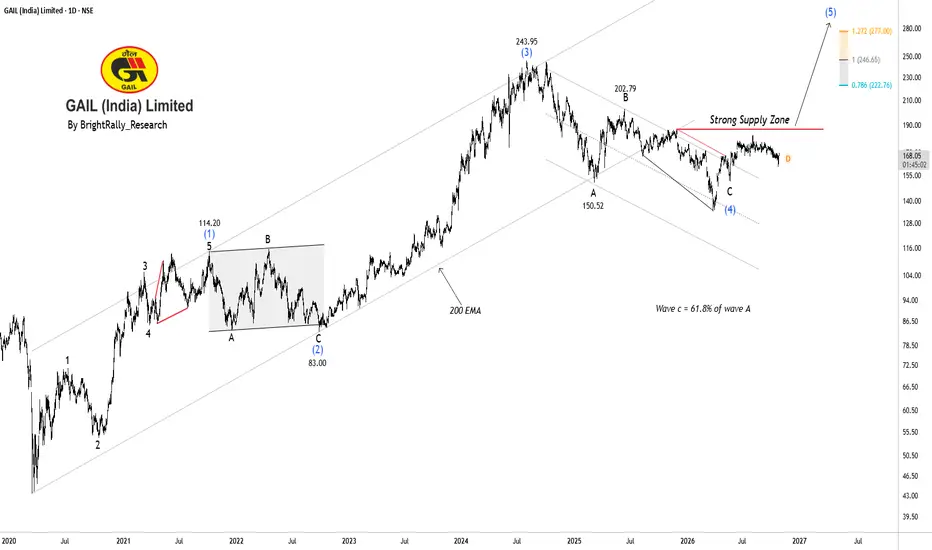
GAIL India: Bullish Breakout Ahead?GAIL (India) Limited is currently trading around ₹168 and appears to be in a correction after a strong rally to ₹244. The stock is showing signs of a possible recovery, but buying momentum remains weak. As per the Elliott Wave pattern, the correction may be nearing completion, opening the possibilit
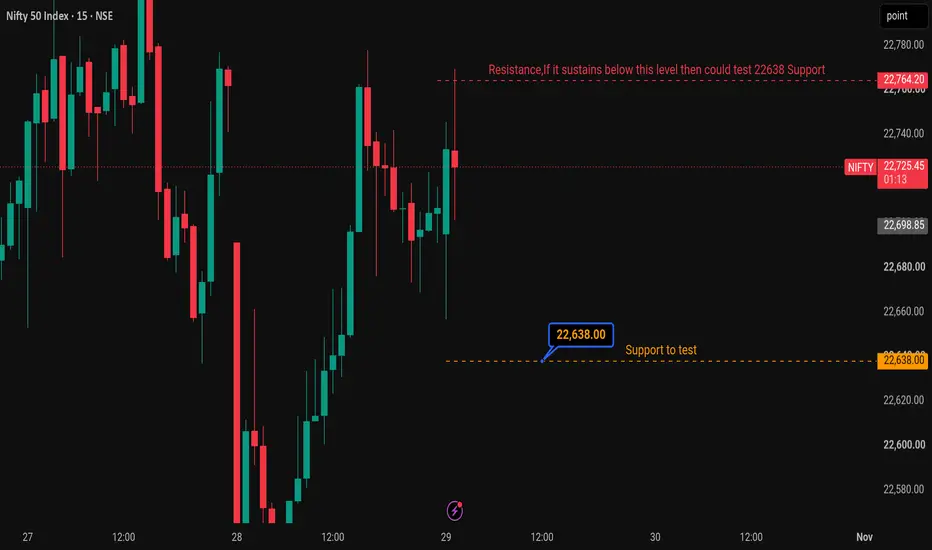
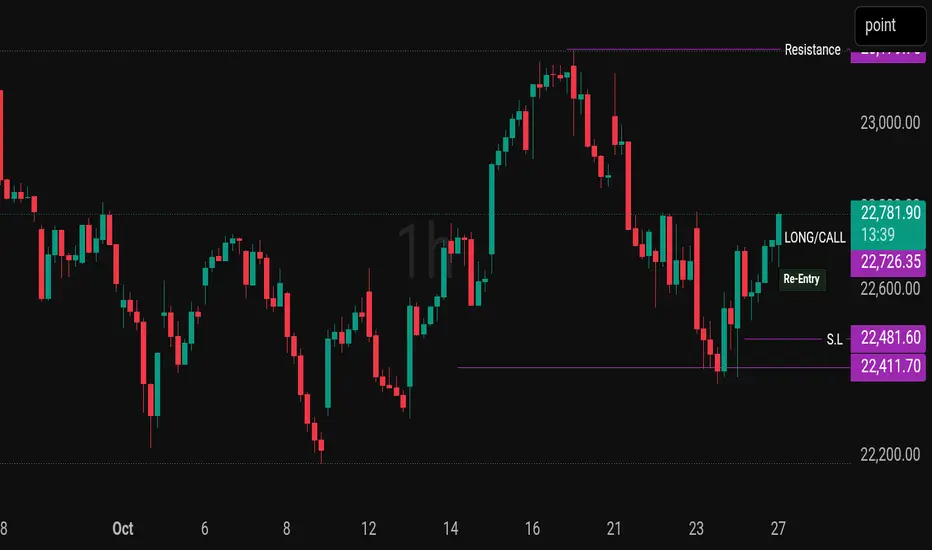
NIFTY Setup — Market SummaryNIFTY has recovered strongly from the 22,411 support area and is now trading around 22,743. The 15M chart shows bullish momentum, with price forming a recovery structure after the recent downside move.
I'm watching whether NIFTY can sustain this momentum and continue toward the marked resistance an
Nifty - Monthly expiry day analysis...What can you expect in this video?
1. Important support/resistance
2. How the trend direction is changing
3. Where to buy and sell
4. Descending channel and ascending triangle pattern movement.
Buy above 22800 with the stop loss of 22720 for the targets 22860, 22920, 22980, 23040 and 23120.
Sell bel
Ideal Pattern of Wave Theory , Corrective PatternMarkets tend to move in high rate of change in the price then pause ,
In Wave theory its refered as Impulse behaviour , when Price move makes significant move
relative to time they enter an price & time correction ,
which are refered as Corrective Patterns as ideally accepted by Traders
He
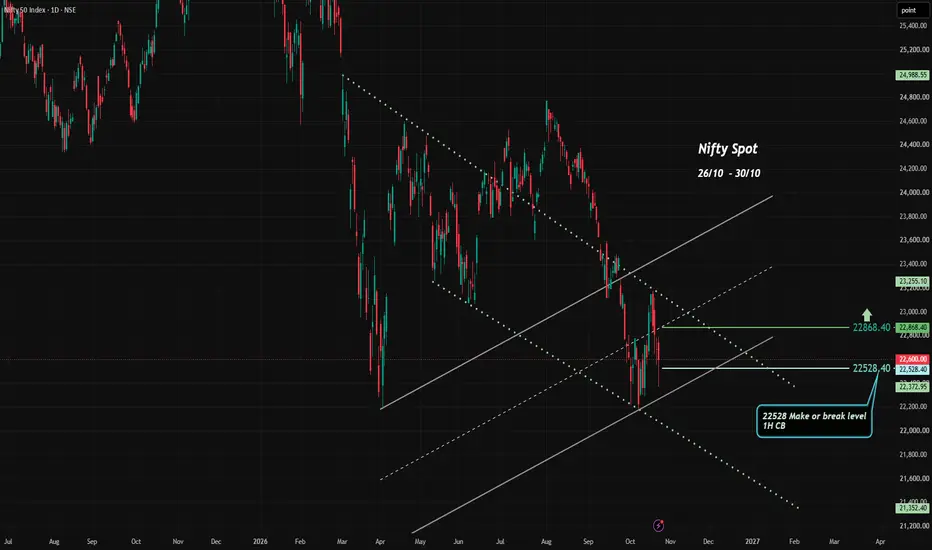
Descending Channel vs. Macro Support: Who Blinks First? NIftyCurrent Price & Trend Context: Last Traded Price (LTP): 22,600.00 (-87.05 / -0.39%).
Market Structure: Nifty is currently oscillating within a well-defined descending parallel channel (dotted downward trend lines) formed after failing to sustain higher levels. Concurrently, the index has pulled b
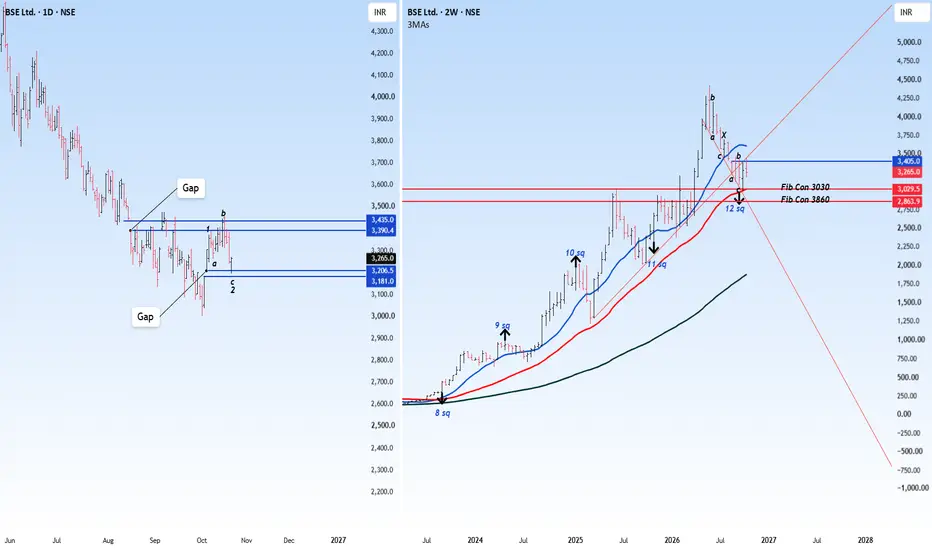
Is it still a good buy??BSE CMP 3265
Fib- the stock made lows at the fib con at 3030. The MA in red cutting the confluence zone at 3030 is further supporting the strength of the zone.
Elliott- A complex correction ended at 3030.
Gann Cycle- where the second c wave finished it also marked the 12th Gann square cycle.
See all editors' picks ideas
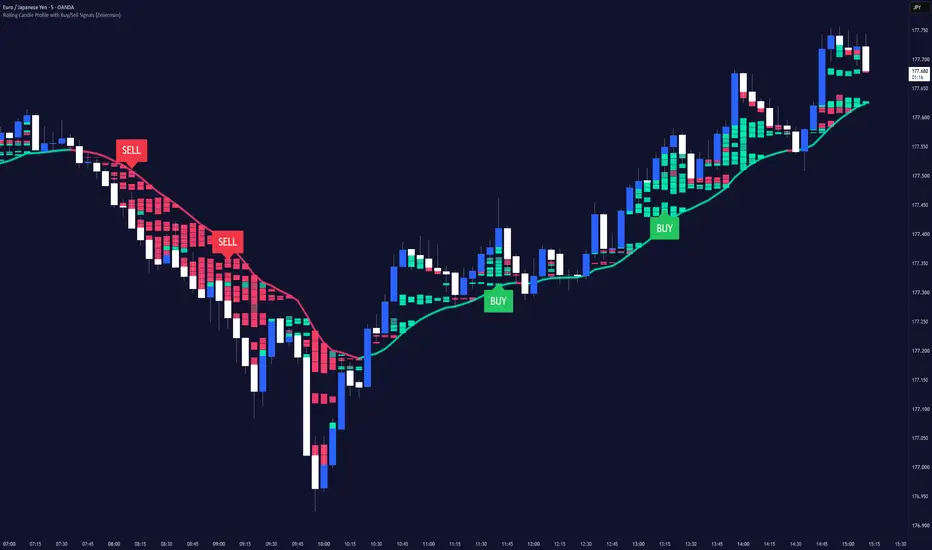
Rolling Candle Profile with Buy/Sell Signals (Zeiierman)█ Overview
Rolling Candle Profile with Buy/Sell Signals (Zeiierman) is a dynamic price-pressure indicator that visualizes buying and selling dominance, directional pressure concentrations, and weak-pressure regions directly on the chart.
The indicator constructs a 12-layer Rolling Pressure Prof
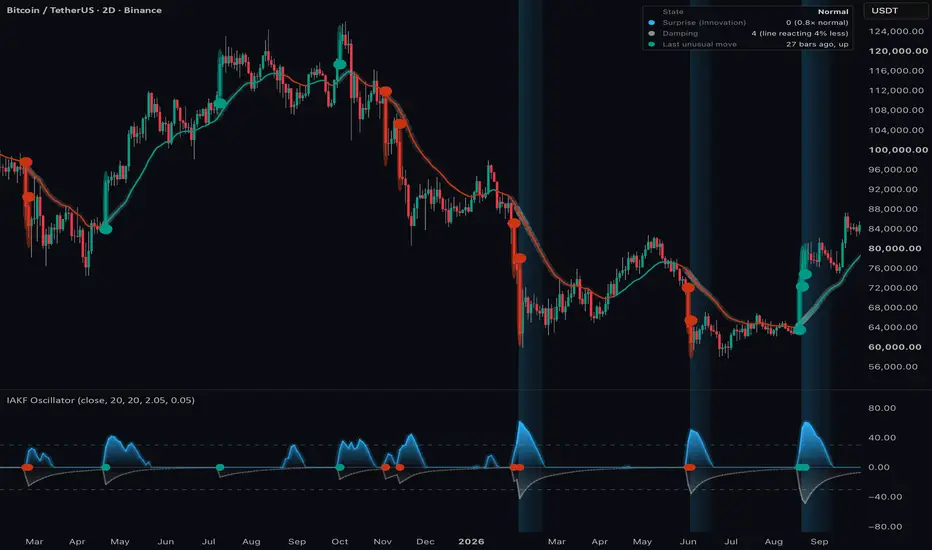
Innovation Adaptive Kalman Filter Oscillator█ OVERVIEW
The Innovation Adaptive Kalman Filter (IAKF) is a modern implementation of the Kalman filter that uses its own prediction errors to detect abnormal measurements and adapt its measurement-noise estimate.
This indicator is an oscillator that adapts recent research in GPS and inertial nav
Market Matrix (Zeiierman)█ Overview
Market Matrix (Zeiierman) is a multi-timeframe market analysis dashboard that brings together price structure, trend, momentum, and market strength into six compact indicator panels.
Instead of switching between multiple indicators and timeframes, Market Matrix displays higher-timefr
RedK Indicator Amplifier (RedK i-Amp)🟩 What is RedK i-Amp?
-------------------------------
RedK i-Amp is not an indicator in itself - it's a "wrapper" utility that "amplifies" another "source" indicator by improving its visual and alerting capabilities.
RedK i-Amp hooks to another indicator's plot and enables the addition of the fol
TASC 2026.10 A Low-Risk ETF-Trading Strategy█ OVERVIEW
This script implements concepts from a short-term ETF investment strategy outlined by Markos Katsanos in the article "Selecting Strong ETFs While Avoiding Sharp Overbought Reversals" from the October 2026 edition of TASC Traders' Tips . The strategy analyzes Katsanos' custom relative s
Buyers & Sellers Profile + Dynamic S/R (Zeiierman)█ Overview
Buyers & Sellers Profile + Dynamic S/R (Zeiierman) is a volume-profile and market-structure indicator designed to combine a large rolling Buyers/Sellers Volume Profile with dynamically generated support and resistance levels.
Instead of treating the volume profile and swing structure
Vol-Control Fund PositioningThe investors who sell because nothing happened
In 2017 the American stock market was so calm that a whole class of institutional portfolios held more equities than their own capital, simply because the rules they follow told them to. Reconstructed with the model behind this indicator, their estim
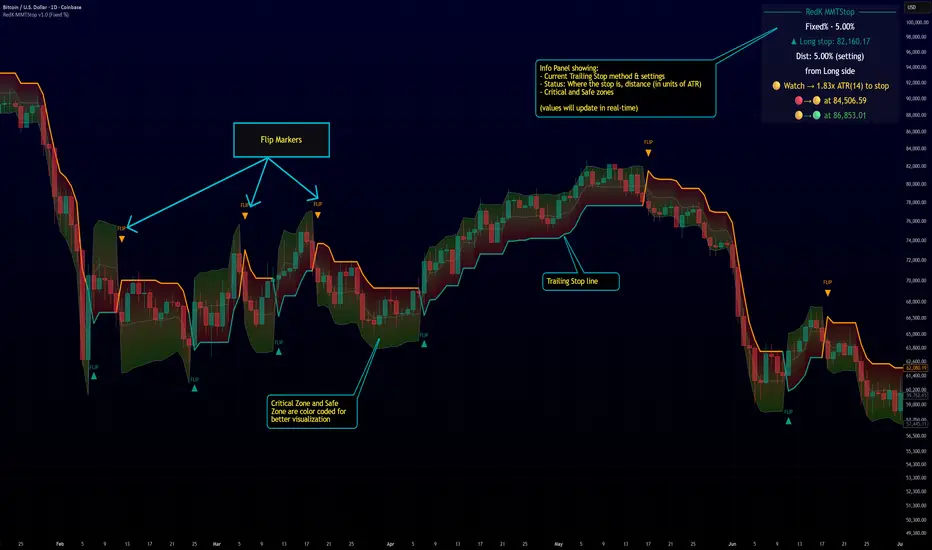
RedK Multi-Modal TrailingStop (RedK MMTStop)█ RedK MMTStop - Release Notes
Introduction & background
RedK MMTStop is a Multi-Modal Trailing Stop indicator - Let's quickly explore the "trailing stop" concept first as a refresher - then explain what a multi-modal trailing stop indicator does.
A "Trailing Stop" is what helps traders avoi
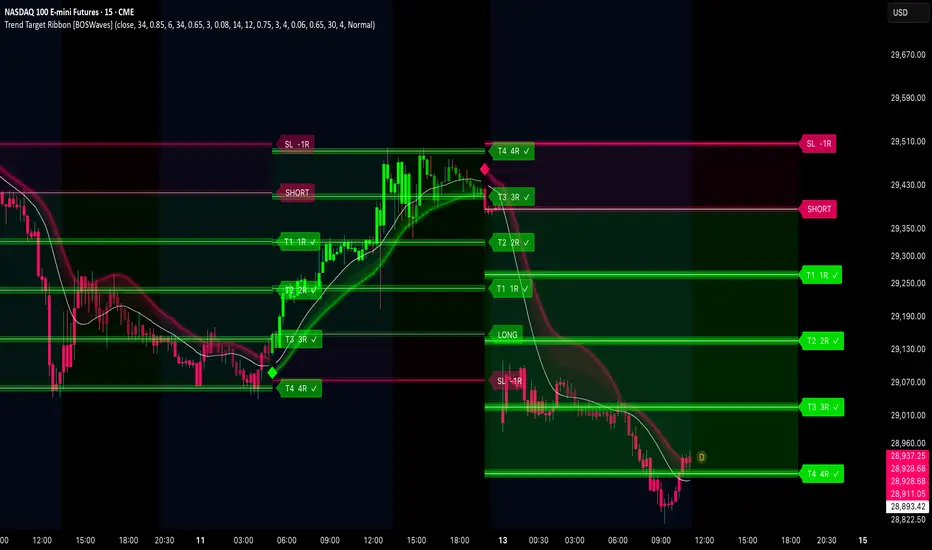
Trend Target Ribbon [BOSWaves]Trend Target Ribbon - ALMA Conviction Trend Detection with Integrated Structure-Based Position Planning and R-Multiple Target Tracking
Overview
Trend Target Ribbon is an ALMA-based trend identification system that combines slope-normalized momentum confirmation with standard deviation band
Wyckoff [theUltimator5]This indicator was designed to be a comprehensive, intuitive, overly engineered algorithm that plots Wyckoff accumulation and distribution patterns on the chart as they arise. It shows the current status of the regime on a side panel, while also overlaying the accumulation or distribution schematic
See all indicators and strategies
Community trends
BUY TODAY SELL TOMORROW for 5%DON’T HAVE TIME TO MANAGE YOUR TRADES?
- Take BTST trades at 3:25 pm every day
- Try to exit by taking 4-7% profit of each trade
- SL can also be maintained as closing below the low of the breakout candle
Now, why do I prefer BTST over swing trades? The primary reason is that I have observed that
RELIANCE - Range cum Box TheoryMarket Structure: Reliance remains in a bearish structure, forming successive lower trading ranges and breakdowns.
Key Levels
Current Support Box: ₹1,120–₹1,150
Immediate Resistance: ₹1,230
Trading Scenarios
📈 Bullish Setup: A sustained daily close above ₹1,230, followed by a successful retest, ma
Voltas Ltd (NSE: VOLTAS) | Technical & Fundamental OutlookTechnical View
Voltas is attempting a recovery after a prolonged weekly downtrend. A sustained weekly close above ₹1,012 could initiate a relief rally, but ₹1,050 remains the first major resistance zone. The descending trendline is still a hurdle.
Key Levels
Support: ₹968 → ₹930 → ₹850
Res
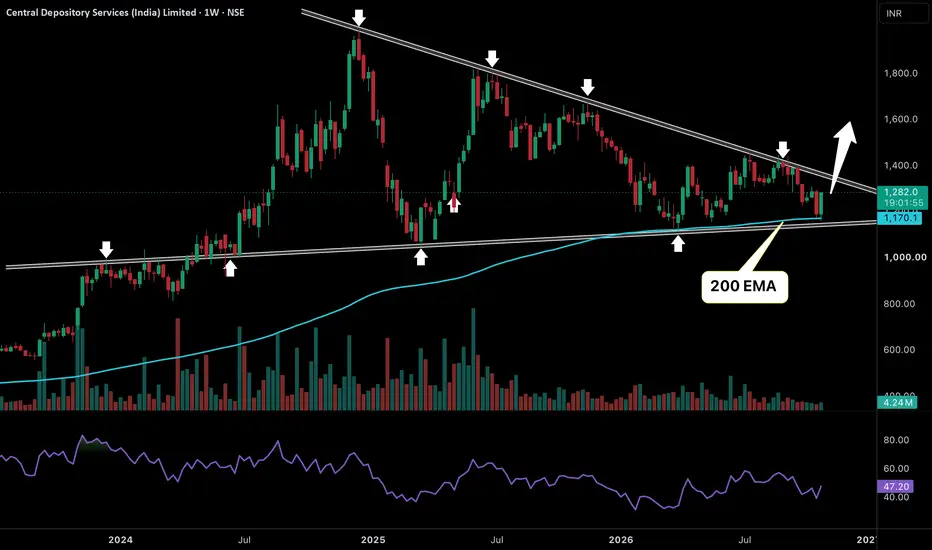
CDSL: Sellers Are Losing Control Near Key SupportCDSL is forming an interesting bullish setup on the weekly chart. Price has been facing repeated rejection from a long-term falling trendline, but sellers are struggling to break the strong support around 1170, where the rising trendline and 200 EMA are providing support. Every correction towards th
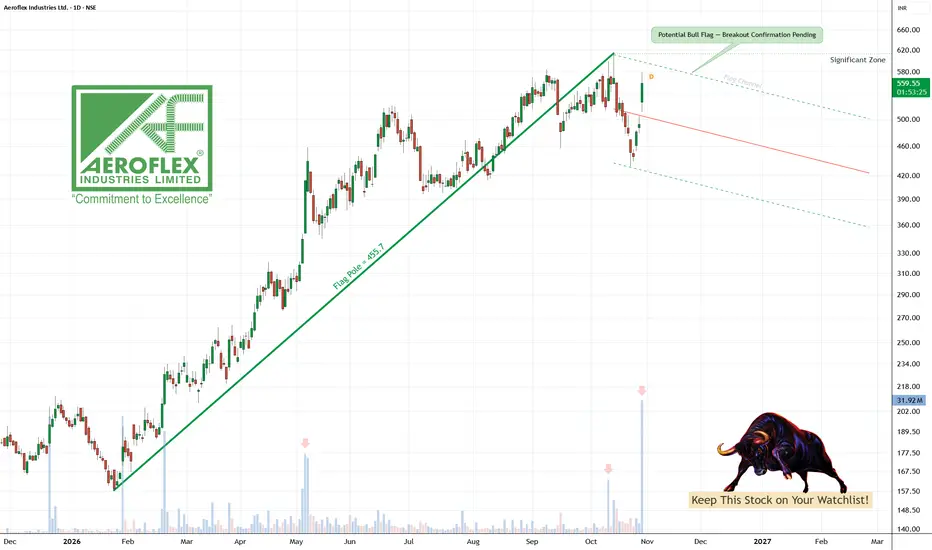
NSE AEROFLEX: Potential Bull Flag SetupAeroflex Industries: Potential Bull Flag — Breakout Watch 🚀
NSE:AEROFLEX is showing a potential bullish continuation pattern following a strong uptrend. Price is consolidating below a significant resistance zone around 600 – 615. A decisive breakout, supported by strong volume, could strengthen
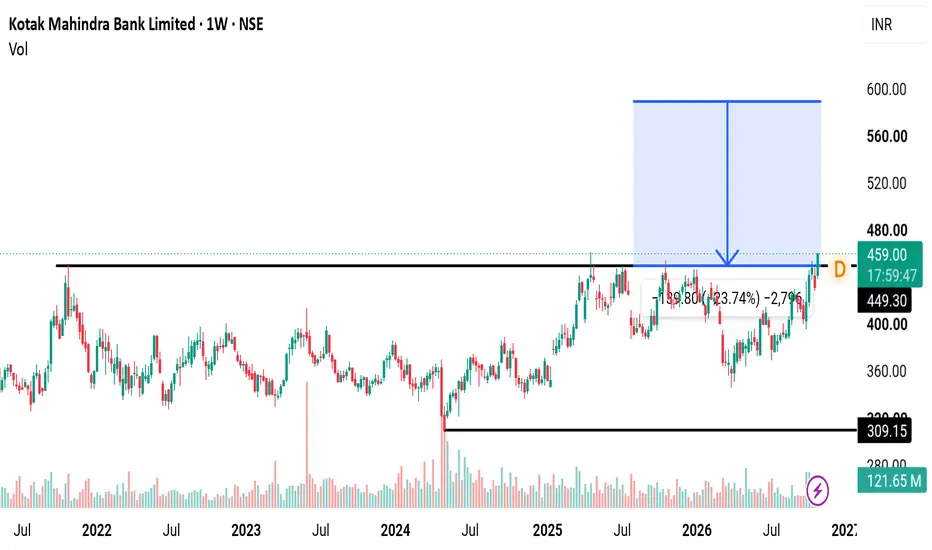
KOTAKBANK*KOTAK MAHINDRA BANK (NSE: KOTAKBANK) | Weekly | Breakout Watch, Measured Move to ~589**
**Setup**
Kotak has been consolidating for years between a floor near **309.15** (the 2024 low) and a ceiling near **449.30**. That ceiling has capped price repeatedly since late 2021: the 2021 high, the 2025 r
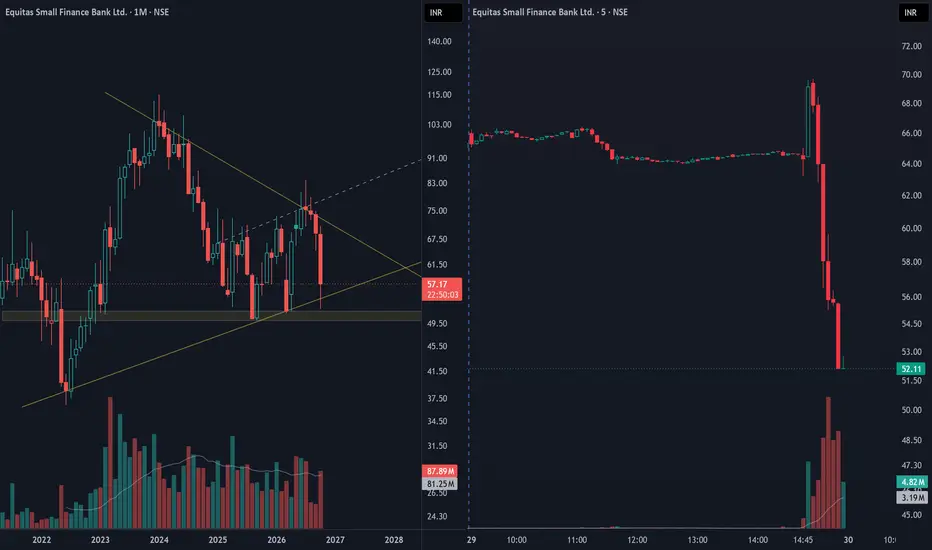
Bear Trap or Baseline? Decoding the Monthly Support Test.Freefall at Support: Panic Selling or Primed for Reversal?
Equitas reported a massive jump in Q2 net profit to roughly 218 crore, a sharp increase from the previous year.
Despite that stellar performance, the stock plunged to the lower circuit when CEO P.N. Vasudevan announced his resignation.
T
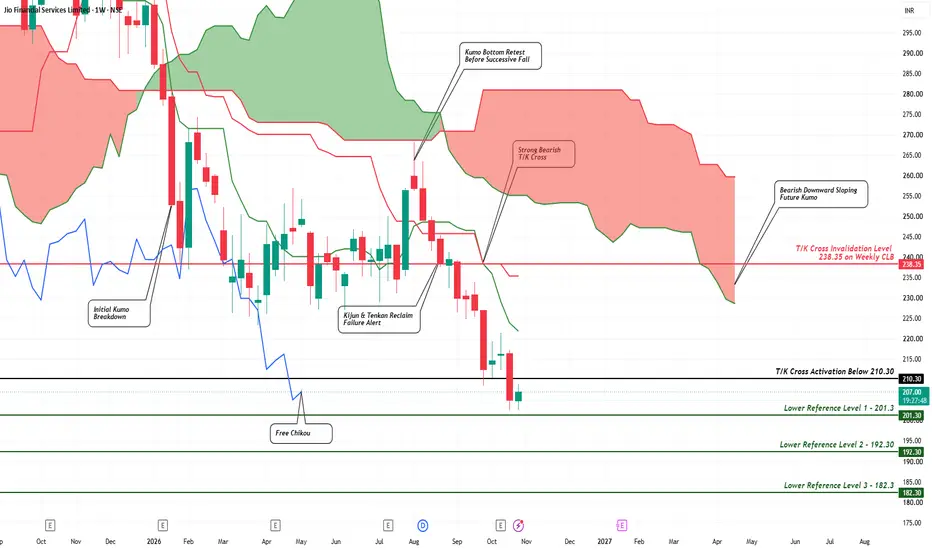
JIOFIN: Eyeing Uncharted Bearish Territory?JIOFIN’s weekly chart is clearly depicting a progressive bearish breakdown structure .
• Initial Kumo breakdown → throwback to retest the Kumo bottom → rejection.
• Kijun & Tenkan reclaim failure followed by a strong bearish T/K cross below the Kumo -> Further deterioration in the chart s
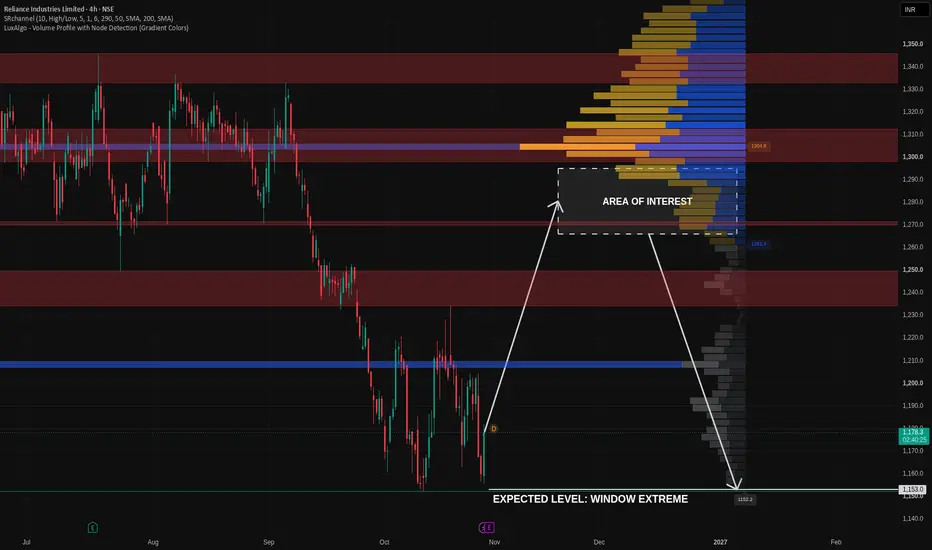
NSE:RELIANCE: Rejection at 1266-1295 Defines Downside RiskThesis: If NSE:RELIANCE retests the 1266-1295 zone and shows rejection, the chart structure supports a conditional downside scenario towards 1153, followed by 1082 and 969.
Evidence: The 1266-1295 area is the largest volume-profile shelf, covering 16% of the profile and aligning with chart extremes
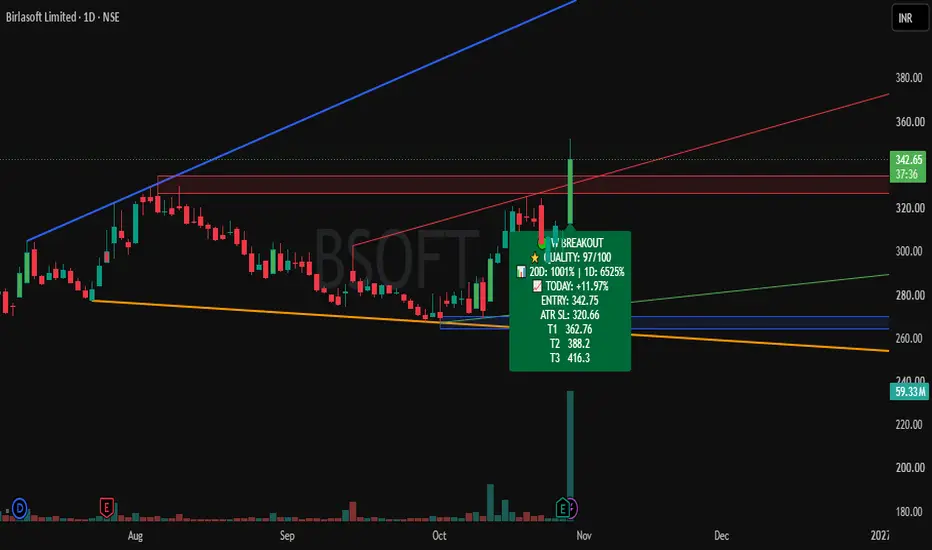
Buy Today, Sell Tomorrow for 3-5% - Daily Breakout SetupBIRLASOFT — BTST BREAKOUT SETUP
Entry, Stop Loss & Targets Are Clearly Defined — Helping You Plan Your Trade With Confidence.
📊 Stock Strength: 97/100
(Note: Higher score indicates stronger stock conditions, not guaranteed returns.)
A bullish breakout has appeared on the 1D timeframe with positiv
See all stocks ideas
Oct 29
ASIANPAINTAsian Paints Ltd.
Actual
11.14
INR
Estimate
11.88
INR
Today
VOLTAMPVoltamp Transformers Limited
Actual
—
Estimate
93.90
INR
Today
RATNAVEERRatnaveer Precision Engineering Limited
Actual
—
Estimate
—
Today
PRIVISCLPrivi Speciality Chemicals Limited
Actual
—
Estimate
—
Today
MANINFRAMan Infraconstruction Limited
Actual
—
Estimate
—
Today
HEIDELBERGHeidelbergcement India Limited.
Actual
—
Estimate
0.83
INR
Today
AFFLEAffle 3i Limited
Actual
—
Estimate
9.38
INR
Today
SPANDANASpandana Sphoorty Financial Limited
Actual
—
Estimate
—
See more events
Community trends
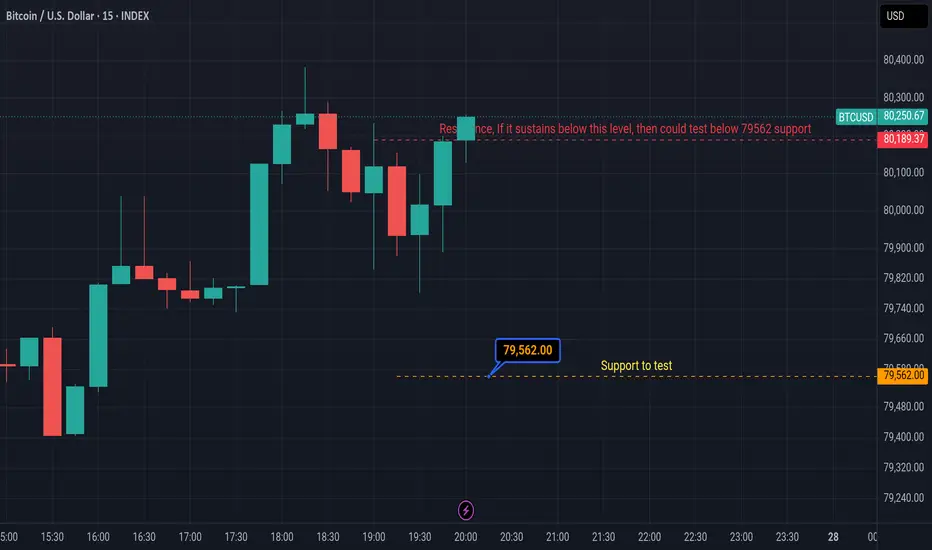
BTCUSD — A Potential Bottom and Bullish Retracement SetupI believe BTC may have established its monthly bottom around the $79.2K–$79.3K support zone, opening the door for a strong bullish retracement toward $82.5K–$83K.
We've already seen significant buying pressure emerge around the $80K–$80.1K support zone. My current view is that the recent move below
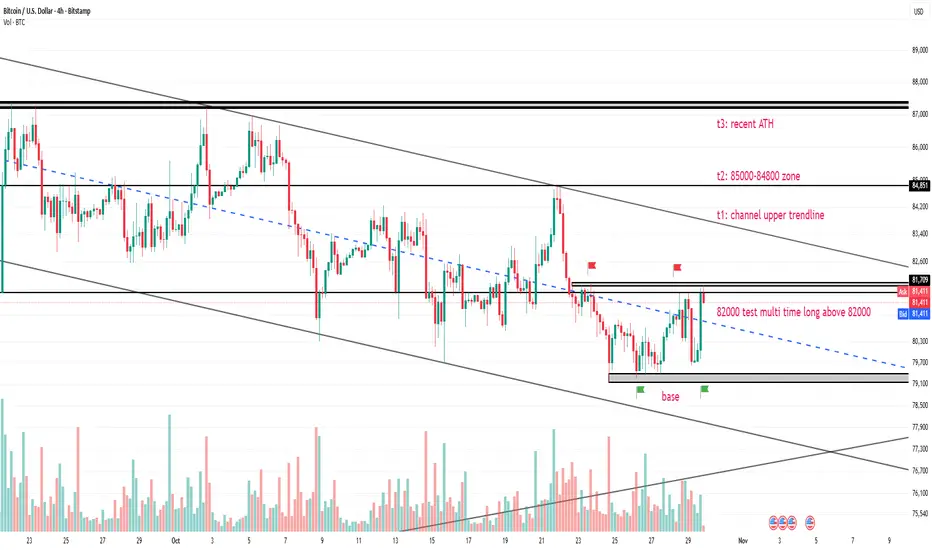
Base Holding, 82,000 Tested Multiple Times. Breakout or Fake-outStructure
BTC has been in a descending channel on the 4H chart. Price made repeated tests of the 79,100-79,400 base, and sellers failed to push below it each time. Price is now back at 82,000-82,300, which has rejected it multiple times (the red flags on the chart). The higher lows near 79,500 hint
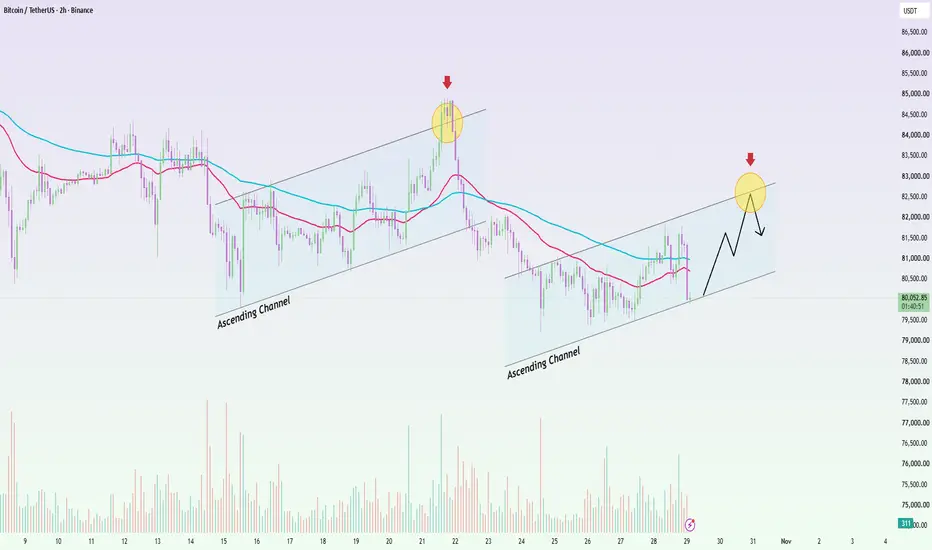
BTCUSDT: Bouncing Within ChannelBTC is reacting from the lower boundary of the ascending channel around 79.8K–80K, leaving room for a short-term recovery.
If buyers hold this area, price could rebound toward 81.5K, followed by the upper-channel resistance around 82.3K–82.7K. That zone is likely to be the real test. A rejection th
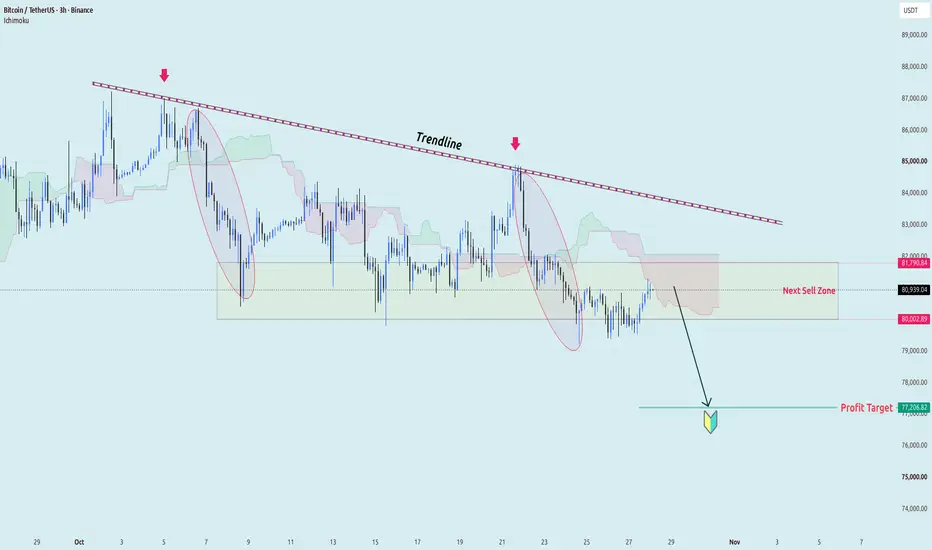
BTC/USDT – Weak Rebound, Sellers Take Wave🟠 BINANCE:BTCUSDT remains bearish on the H3 chart, trading below the Ichimoku cloud while the descending trendline continues to cap the broader structure.
I’m watching the 80,003–81,791 sell zone. A weak rebound into this area followed by rejection would keep the downside structure intact.
🎯 T
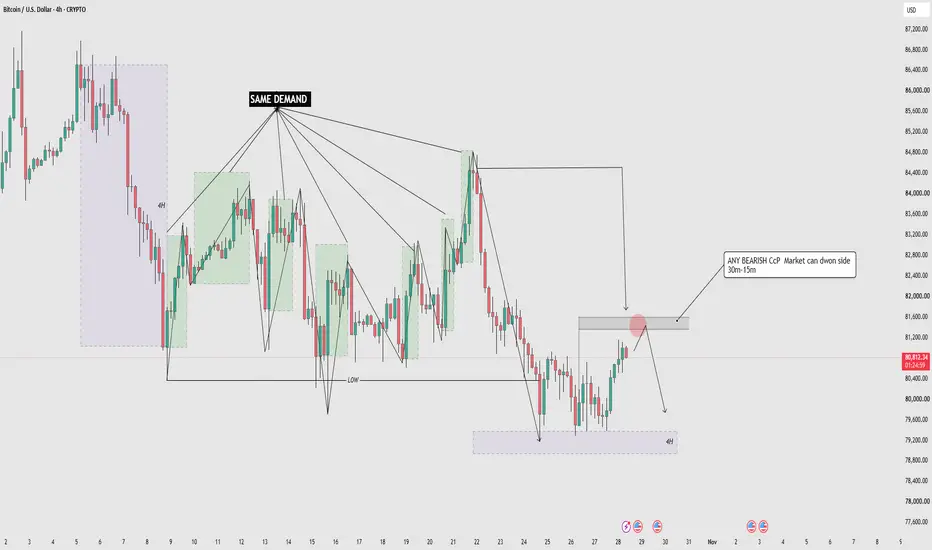
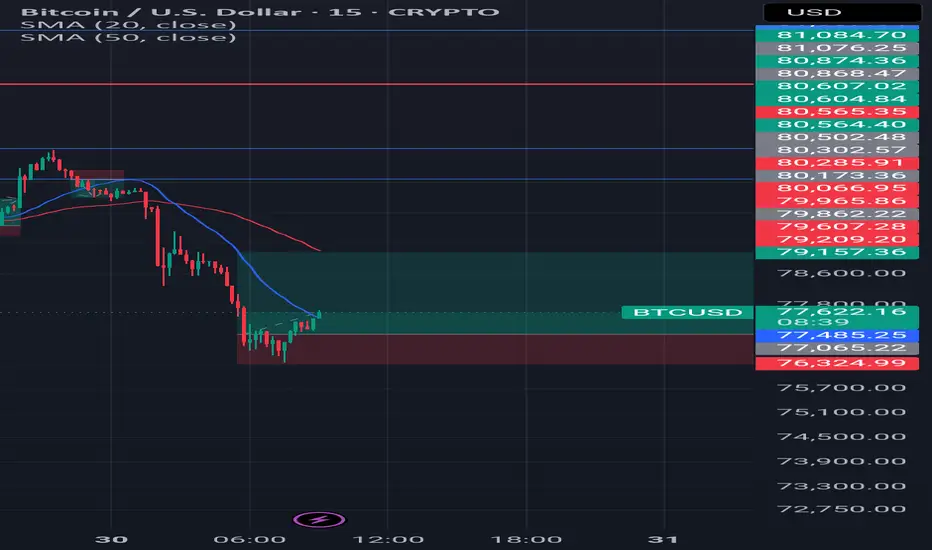
BTCUSD 4H – Same Demand RepeatingMarket is repeating the same demand, but supply is fast, so we will follow the supply side for now.
The 4H low has already broken, and supply has done its work. Now we will wait for price to reach our reversal zone and look for confirmation on the 15m–30m timeframe.
If we get a bearish CCP there,
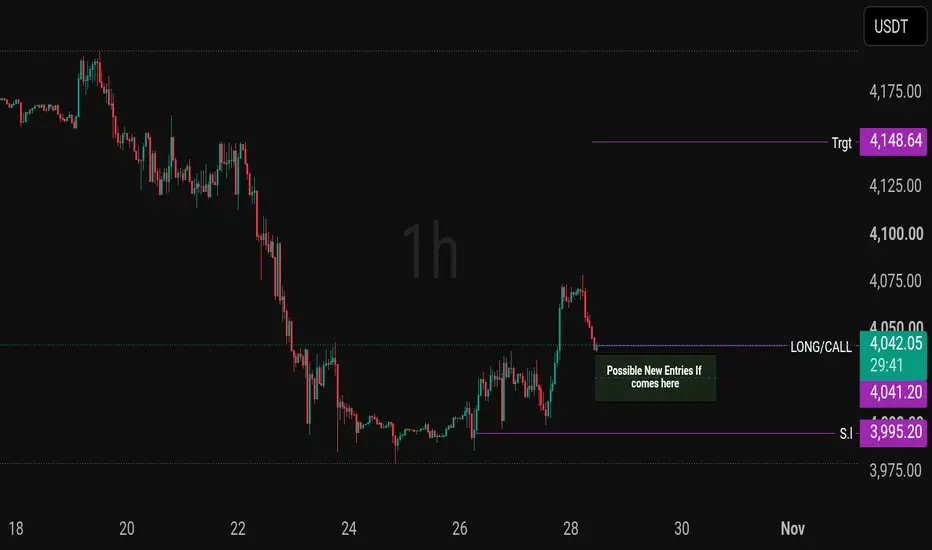
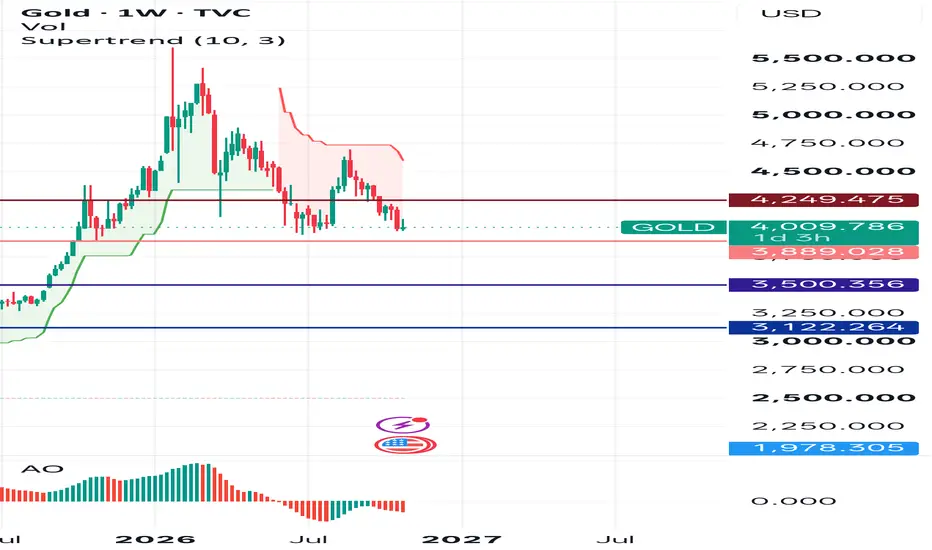
XAU— Setup SummaryGold is showing a short-term bullish recovery after finding support around the 4,000 area. Price pushed toward 4,072 before facing selling pressure and pulling back toward the 4,041–4,043 zone.
I'm watching this pullback for a potential LONG/CALL re-entry, provided price holds the marked support ar
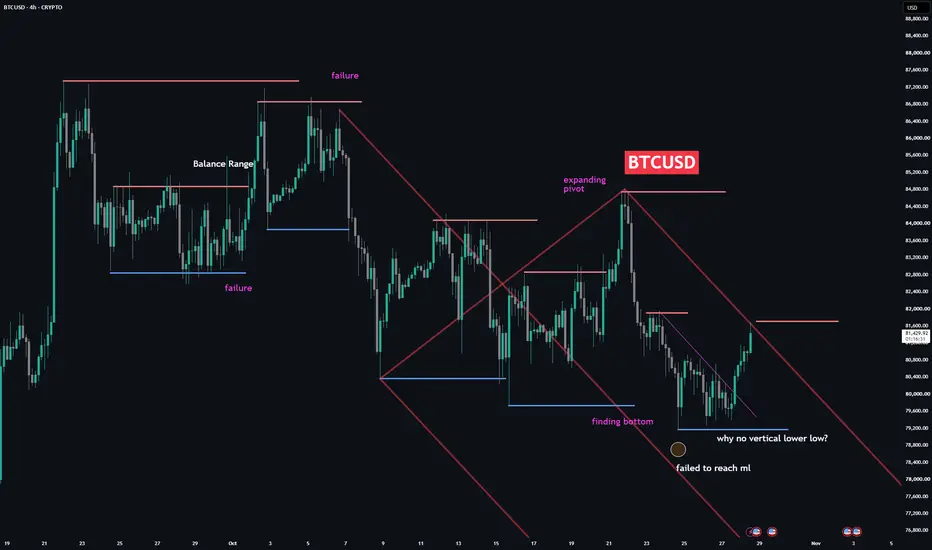
BTCUSD 4H | Bears Lose Momentum at the LowsHello traders,
BTC failed twice at the highs near $87,000, and the balance range below it also failed to hold. From the October 9 low, price developed an expanding structure inside a falling channel. The $84,800 pivot on October 21 swept the previous highs and was rejected hard, which confirmed sel
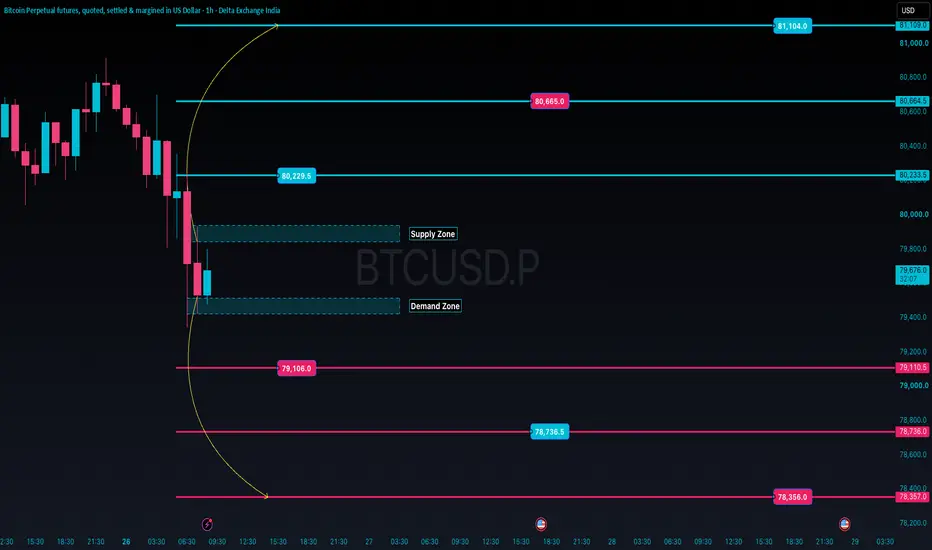
₿ | Bitcoin Price Analysis | Breakdown Or Recovery?⚡ Bitcoin is at a critical decision zone!
Bitcoin has faced strong selling pressure on the 1-hour chart, moving from the $80,000 region toward the $79,400–$79,600 demand area.
The latest candle shows a modest bounce, but is this the beginning of a recovery—or just a temporary pause before anothe
See all crypto ideas
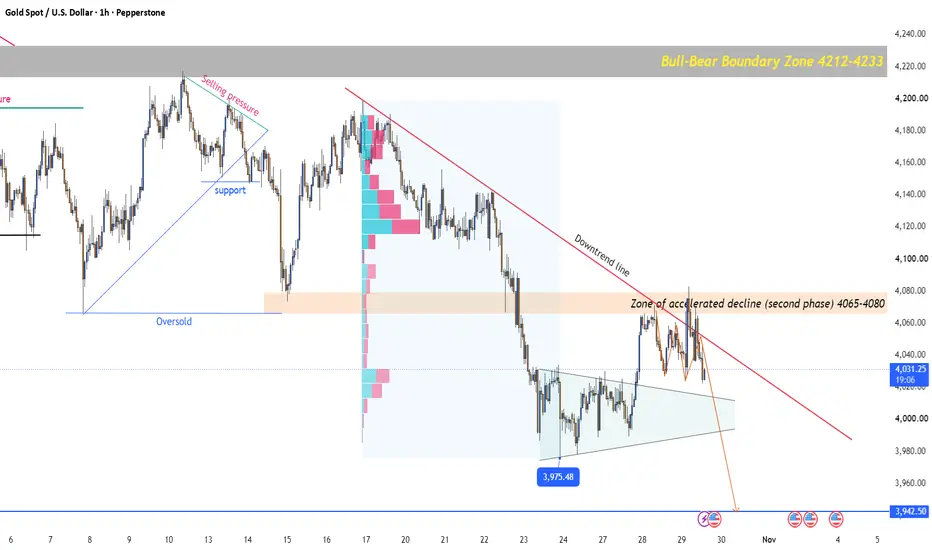
GOLD HEADING TOWARDS 3942GOLD (XAUUSD) | BEARISH OUTLOOK
Price rejection near 4,080 confirms selling pressure, with momentum favouring sellers.
Bearish continuation expected below 4,000, opening the path towards 3,979 and 3,942.
A decisive breakdown of 3,915 could extend the move to TARGET: 3,942.
STOP LOSS: 4,090 | Inval
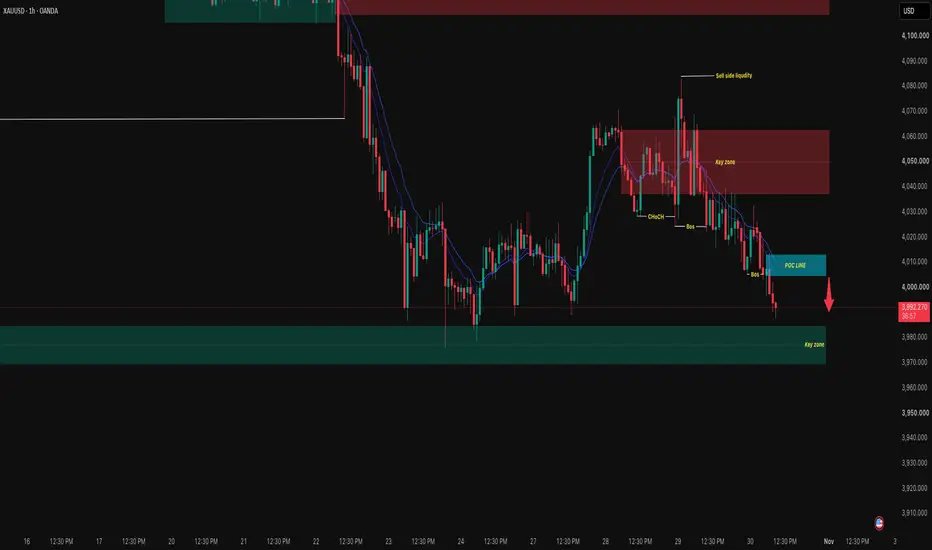
DISCIPLE FX | DAILY GOLD ANALYSIS 30 October 2026DISCIPLE FX | DAILY GOLD ANALYSIS
Date: Friday, 30 October 2026 | Pair: XAUUSD (1H)
📈 TODAY’S GOLD OUTLOOK
Direction: Bearish bias. Gold is trading around 3,991. Price made a CHoCH and then two BOS to the downside, and it is moving lower under the moving averages. The sell-side liquidity above 4,
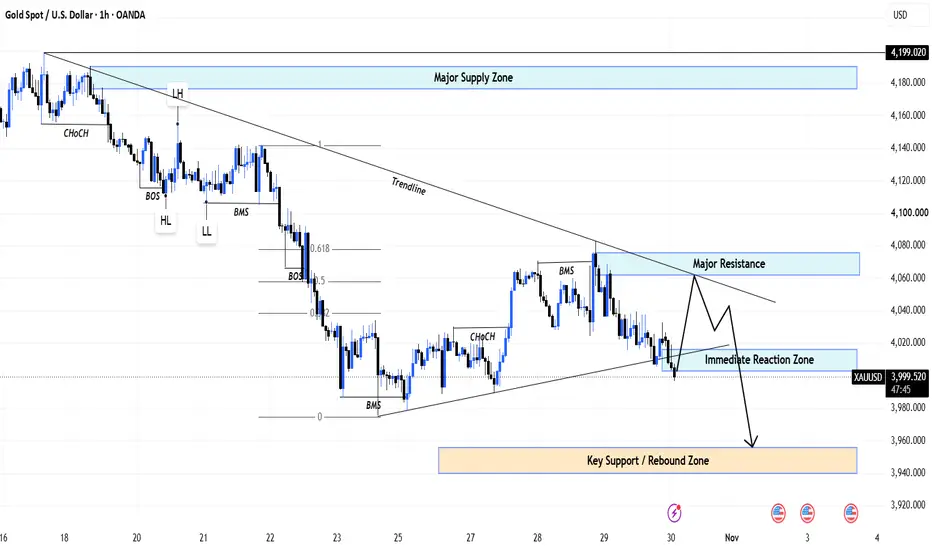
H1 Corrective Rally Into Major ResistanceGold is trading around 4,010, consolidating near the lower H1 reaction area after renewed selling pressure following the latest U.S. inflation data.
September PCE inflation accelerated to 3.6% year-on-year, reinforcing expectations that the Fed may need to tighten again in December. That keeps the
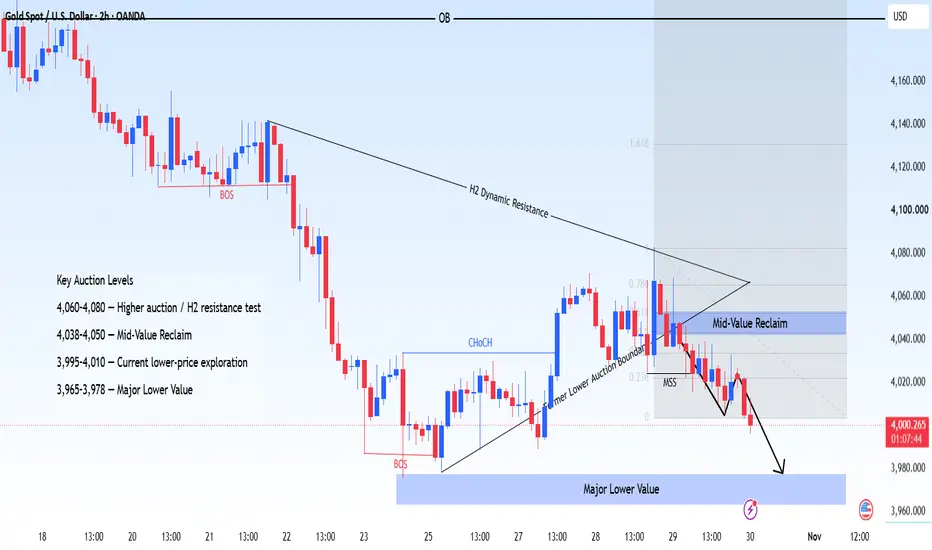
XAUUSD — Value Acceptance Around 4,000
Auction State
XAUUSD on H2 remains in a directional lower auction, with price now testing the 4,000 area after failing to sustain the recovery above the mid-4,040s. The market remains below the broader H2 dynamic resistance, and the latest rotation suggests sellers are still finding acceptance at p
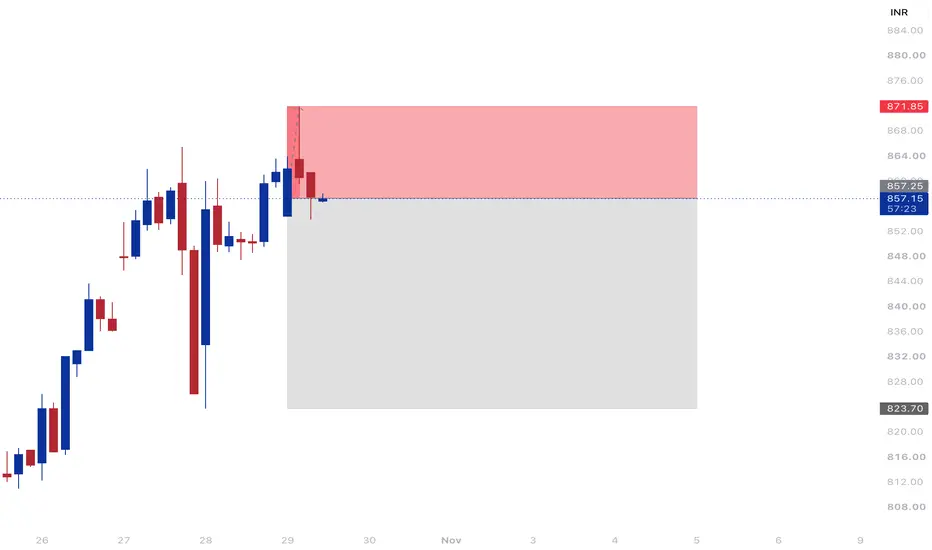
MAXHEALTH (Max Healthcare) | Bearish Setup – 1H ChartMAXHEALTH has been moving higher on the hourly chart, but the recent move towards ₹864 has faced selling pressure.
Price is now pulling back towards ₹857–₹858. Watching for a possible bearish reversal if buyers fail to regain momentum.
Entry: ₹857.25
Target: ₹823.70
Stop Loss: ₹871.85
Risk-to-Rewa
Gold Technical Analysis Strategy: Hawkish Pressure Aligns with DGold Technical Analysis Strategy: Hawkish Pressure Aligns with Downward Trend—Prioritize Selling into Rallies
Fundamentals: The Fed’s Hawkish Stance Persists, Capping Gold’s Rebound
At its October meeting, the Federal Reserve kept interest rates unchanged at 3.75%–4.00%; however, the vote revealed
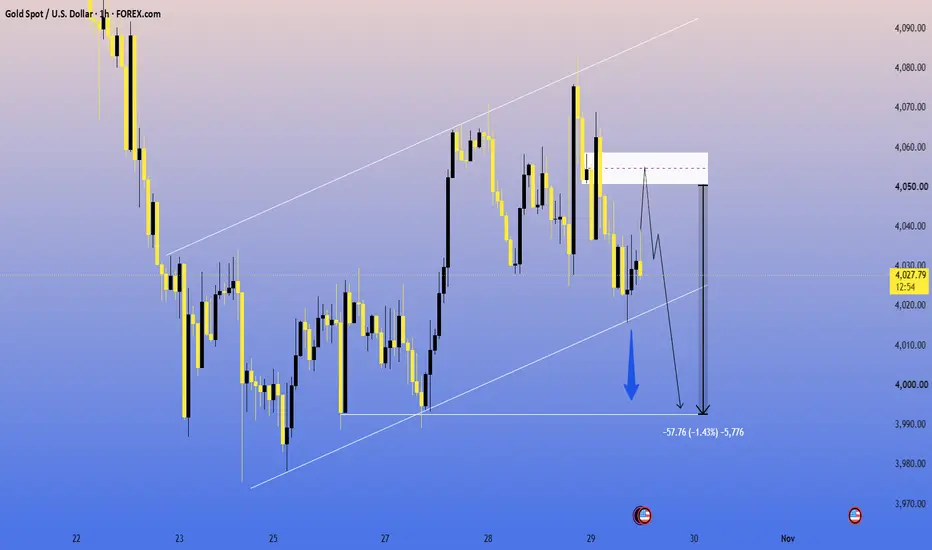
XAU/USD GOLD BEARISH SELL SETUP | 1H CHARTXAU/USD GOLD — SELL SETUP 🔴
⏱️ Timeframe: 1H
📉 Bias: Bearish — Sell on Rally
📊 Technical Analysis:
Market Structure: Bearish momentum after rejection near 4,075.
Resistance Zone: 4,050–4,058
Support Zone: 4,020–4,025
Trendline: Price is testing rising trendline support; a confirmed breakdown cou
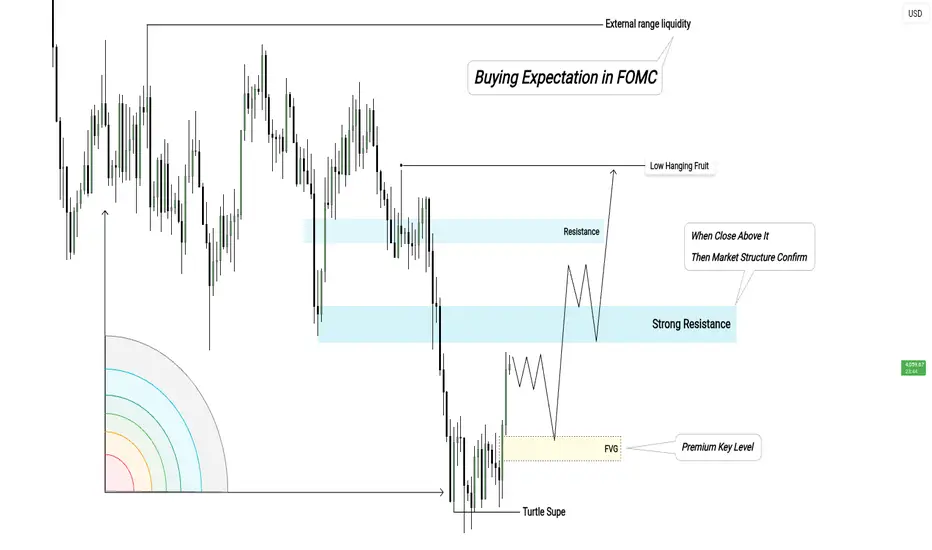
FOMC Buy Plan: FVG & Market StructureWelcome to this detailed technical breakdown focusing on advanced smart money concepts, institutional market dynamics, and a high-probability buying perspective based on the attached visual chart. This educational guide explains how major financial operators engineer liquidity, interact with specifi
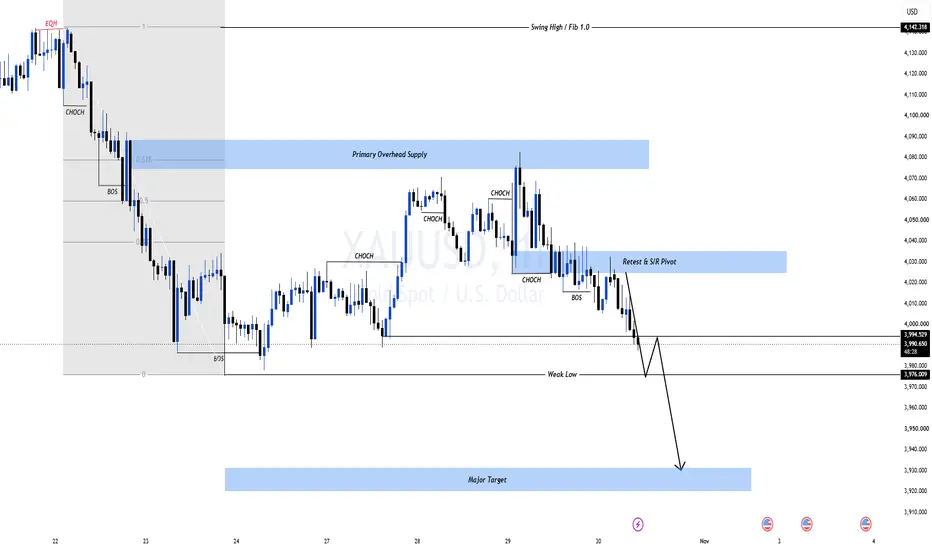
XAUUSD: Has Gold's Recovery Run Out of Support?Gold's recovery has lost its pivot. A bearish CHoCH followed by BOS now puts the recent low back in focus.
The next test is whether buyers can defend 3,976.009 or whether the decline extends toward the chart's major target.
MARKET OVERVIEW
The latest PCE release reinforced concern about persisten
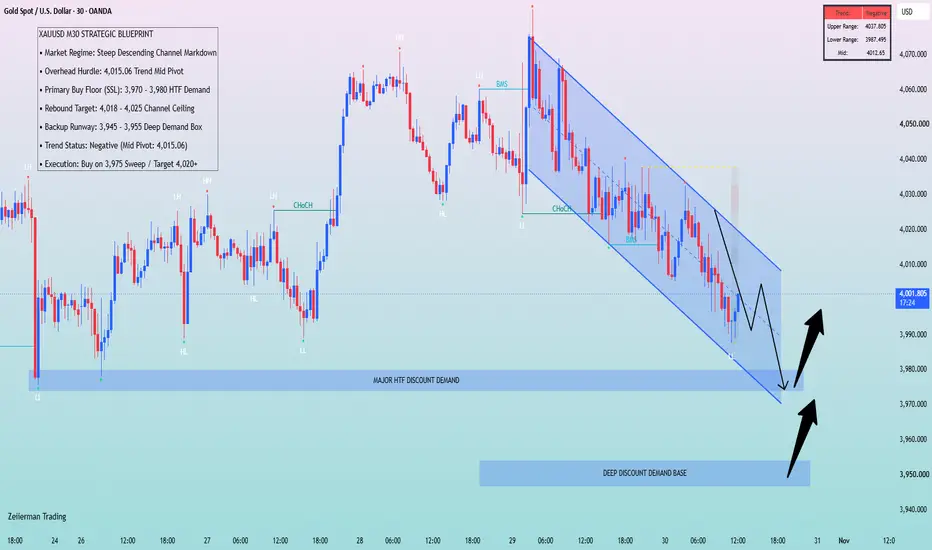
[XAUUSD] M30: A 3,975 Sweep Before a 4,020 Rebound?Gold is descending toward a familiar demand floor.
A rebound remains possible, but buyers must first demonstrate that demand can interrupt the sequence of lower highs and lower lows.
⚖️ MACRO BACKDROP
Higher oil prices and persistent inflation are keeping future Fed tightening in focus.
Dollar m
See all futures ideas
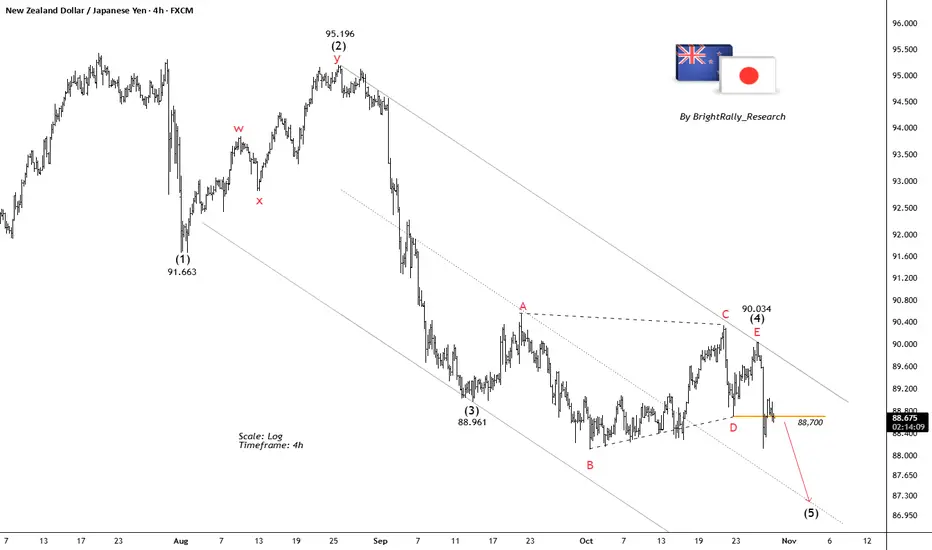
NZDJPY: Bearish Wave (5) Could Target Lower LevelsNZDJPY is showing a potential bearish Elliott Wave structure on the 4H chart, with price facing rejection near the descending trendline. Wave (4) may be complete, suggesting a possible continuation into bearish Wave (5).
Key support is at 88.70. A confirmed break below this level could open the way
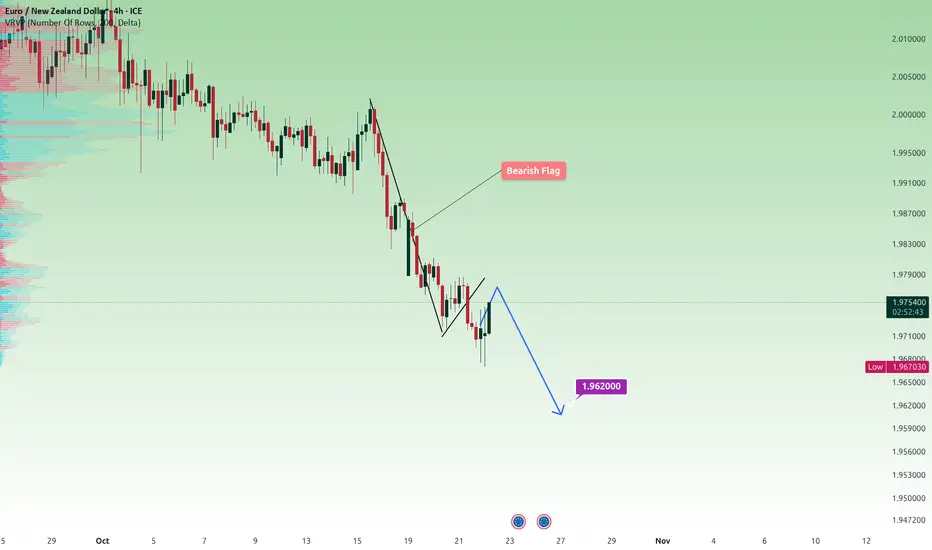
AUDNZD buy opportunity Bullish Outlook | Key Support Level
Technical Analysis
Price Action: Price has reached a major support level.
4H RSI: 21, indicating oversold conditions and potential buying pressure.
Daily RSI: 42, indicating neutral momentum.
Current Trend: Bullish.
Overall Bias: Technical confluences favor a po
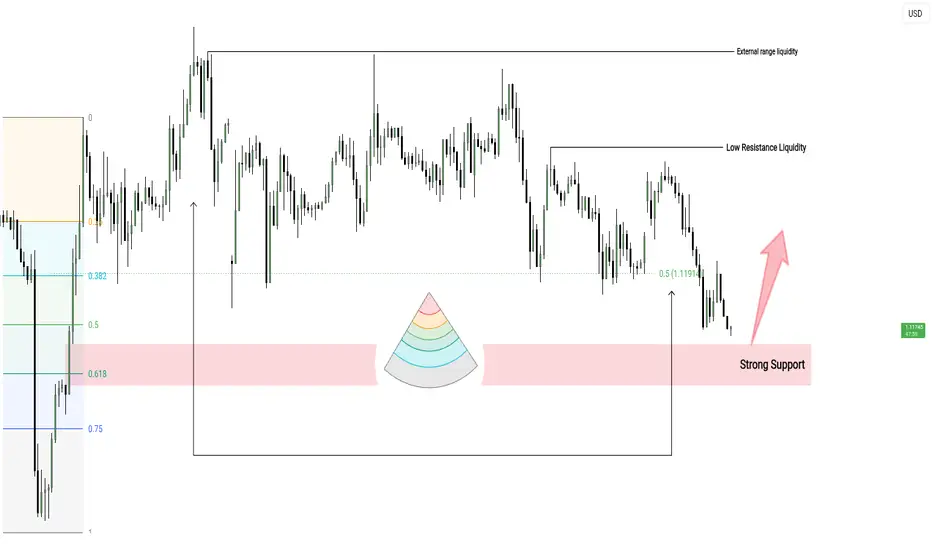
EUR/USD Setup: External Liquidity & Support AnalysisWelcome to this comprehensive technical analysis breakdown for the EUR/USD chart, exploring advanced smart money concepts, liquidity pools, and institutional price delivery mechanics based on the provided image. This educational guide examines how major financial institutions define structural range
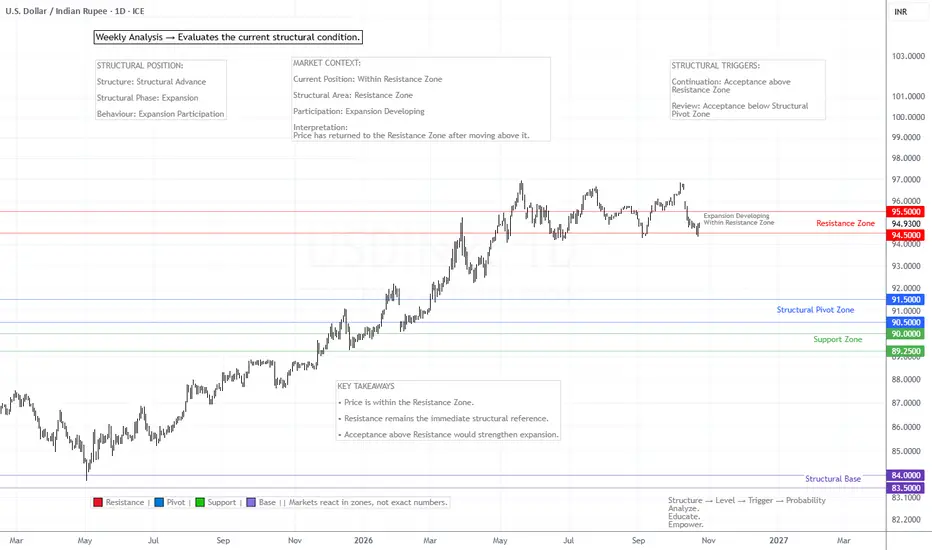
USDINR — Weekly Structural Observation | Week 4325 October 2026
Introduction
USDINR has returned within its established Resistance Zone. In Week 41, price was positioned above Resistance; the Week 43 observation places it back inside the same zone.
The primary structural levels remain unchanged. The current focus is on price behaviour and acc
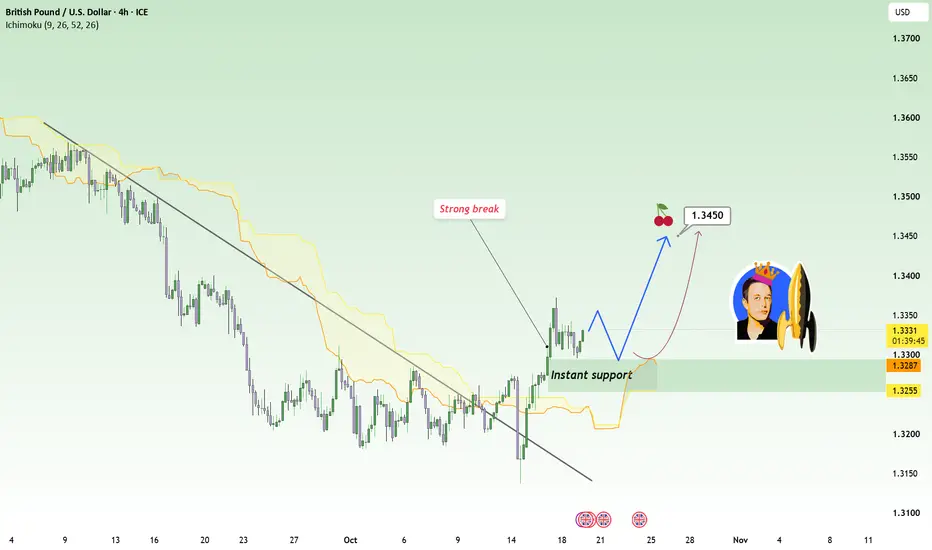
GBPUSD – The Breakout Is Starting to MatterGBPUSD is showing a clear change in structure. After spending weeks under a descending trendline, buyers have finally forced a strong breakout, suggesting that the previous bearish cycle is losing control.
The important area now is 1.3255–1.3287. Rather than seeing a pullback toward this zone as im
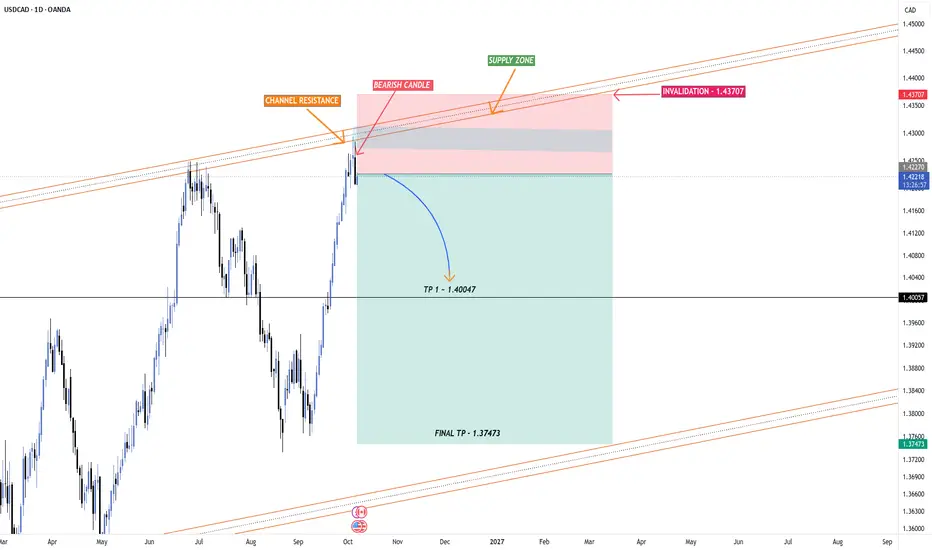
USDCAD 1D — Supply + Channel Resistance RejectionUSDCAD has rallied strongly into a higher-timeframe supply zone, while simultaneously reaching the upper boundary of the ascending channel.
Price has now shown a clear bearish reaction from this area, creating a potential downside scenario.
Why this setup is interesting:
1️⃣ Daily Supply Zone
Pri
See all forex ideas
Trade directly on Supercharts through our supported, fully-verified, and user-reviewed brokers.