Adidas — Bearish Selling Setup | Downside PotentialAdidas is currently developing a bearish structure, with price action showing increasing signs of weakness and selling pressure.
The present setup is positioned toward the sell side, with the focus on a potential continuation into lower price territory. 📉🔥
The current market behaviour suggests that buyers are struggling to maintain sustained upside momentum, while sellers are becoming increasingly influential. This imbalance creates a favourable environment for a bearish scenario if the existing structure continues to deteriorate.
The analysis is based on the broader price formation, momentum and signals generated through my trading methodology rather than reacting to a single candle or isolated market movement.
From a technical perspective, the key consideration is whether the current weakness can develop into a sustained downward phase. If sellers maintain control and bearish momentum expands, adidas could continue progressing toward lower levels.
📊 Setup Overview
- Instrument: adidas
- Bias: Bearish 📉
- Direction: Sell
- Focus: Downside continuation
- Structure: Weakening
- Momentum: Selling pressure increasing
- Approach: Technical market-structure analysis
Short-term rebounds remain possible within any declining market, but the primary scenario remains focused on the downside while the prevailing conditions continue to support sellers.
The objective is to remain aligned with the broader structure, follow the established methodology and allow price action to determine the development of the move.
🔥 Bearish Outlook
The current formation indicates that upside attempts are losing effectiveness, while the selling side is gaining greater influence over price behaviour.
If this imbalance persists, adidas could enter a deeper corrective phase and explore progressively lower territory. The setup therefore offers a clear bearish framework built around structure, momentum and directional pressure.
Weakness developing. Sellers gaining control. Downside remains the focus. 🎯📉  Short
Short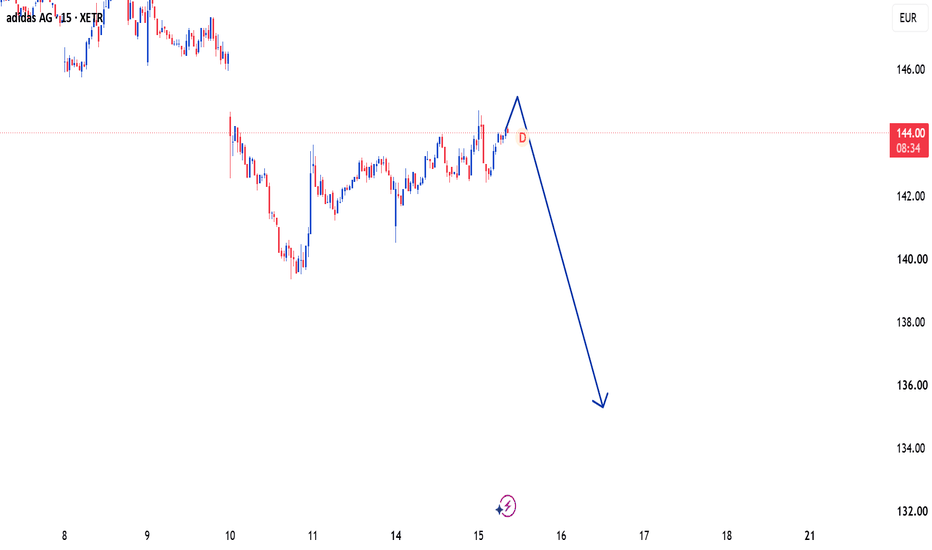
 Short
Short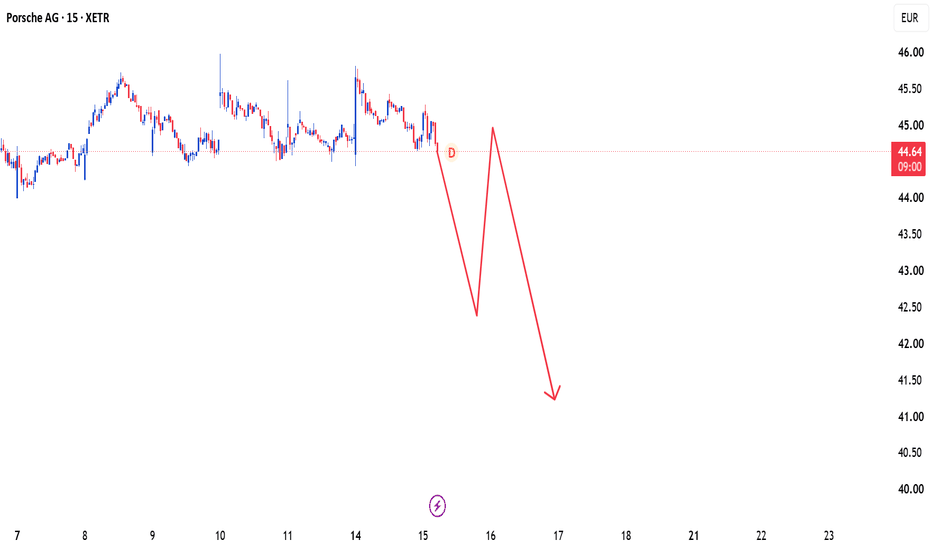
Volkswagen — Bullish Buying Setup | Upside MomentumVolkswagen is currently presenting a constructive buy-side opportunity, with the broader price structure showing signs of improving bullish momentum. The setup is focused on a potential continuation toward higher levels as buyers attempt to strengthen their control over the current market direction. 📈🔥
The analysis is based on the overall behaviour of price rather than a single candle or isolated level. The current structure suggests that downside pressure is losing influence, while the buying side is gradually becoming more prominent.
From a technical perspective, Volkswagen is developing within a structure that supports a bullish scenario. If buyers continue to maintain their influence and upward momentum expands, price could progress toward higher resistance areas and potentially establish a broader upward leg.
The key element of this setup is the relationship between price structure and momentum. Instead of reacting to short-term fluctuations, the focus remains on whether the market continues to respect the conditions generated by the trading methodology.
📊 Setup Overview
- Instrument: Volkswagen
- Bias: Bullish 📈
- Direction: Buy
- Market View: Upside continuation
- Structure: Constructive
- Momentum: Buyers gaining influence
- Approach: Technical market-structure analysis
The current environment provides an opportunity to participate in the potential upside while keeping the analysis centred around a clearly defined framework. Markets rarely move in a perfectly straight line, so short-term retracements should be viewed within the context of the larger structure rather than interpreted independently.
If the prevailing conditions remain supportive, Volkswagen could continue building upward momentum and move toward higher price territory.
🔥 Why the Setup Stands Out
The attraction of this trade comes from the developing relationship between price action, directional structure and buying pressure.
The market is showing characteristics that can support further appreciation, and the buy-side scenario remains the primary focus while those conditions remain valid.
The objective is not to predict every individual candle. It is to identify the broader opportunity, follow the established framework and allow price to reveal whether the anticipated continuation develops.
Bullish structure.
Buy-side pressure building.
Higher levels in focus. 🎯📈  Long
Long
 Long
Long
Mercedes-Benz — Bullish SetupMercedes-Benz is currently presenting a positive market outlook, with the recent price behavior indicating that the buy side is gaining importance. The stock is developing within a constructive environment where upward progress remains the preferred scenario.
The latest market movement suggests that buyers are showing increasing confidence, allowing price to maintain a favorable position and potentially continue advancing. While short-term fluctuations are always possible, the broader analytical view remains focused on the potential for further appreciation.
This trade idea is based on the developing relationship between market direction and price behavior rather than relying solely on one specific level. The aim is to remain positioned with the prevailing positive structure and allow the market to reveal the next phase of its upward movement.
Mercedes-Benz operates within an industry where investor sentiment can be influenced by vehicle demand, luxury-car sales, global economic conditions, supply-chain developments, electric-vehicle competition, currency movements, and broader European market performance. These factors may affect volatility, but the current technical picture continues to support a buy-side perspective.
The projected scenario can be viewed as:
Current positive formation → sustained buying interest → continued market progress → potential higher valuations.
📍 Market Bias: Bullish
📈 Trade Direction: Buy
🚀 Market Outlook: Positive
⚡ Focus: Upward continuation
🎯 Approach: Following the developing bullish structure
The key focus remains on the strength of the broader market picture. As long as the positive conditions continue to develop, Mercedes-Benz has the potential to extend its movement toward higher territory.
A defined outlook, a disciplined approach, and a market structure that continues to keep the buying side in focus. 📈🔥  Long
Long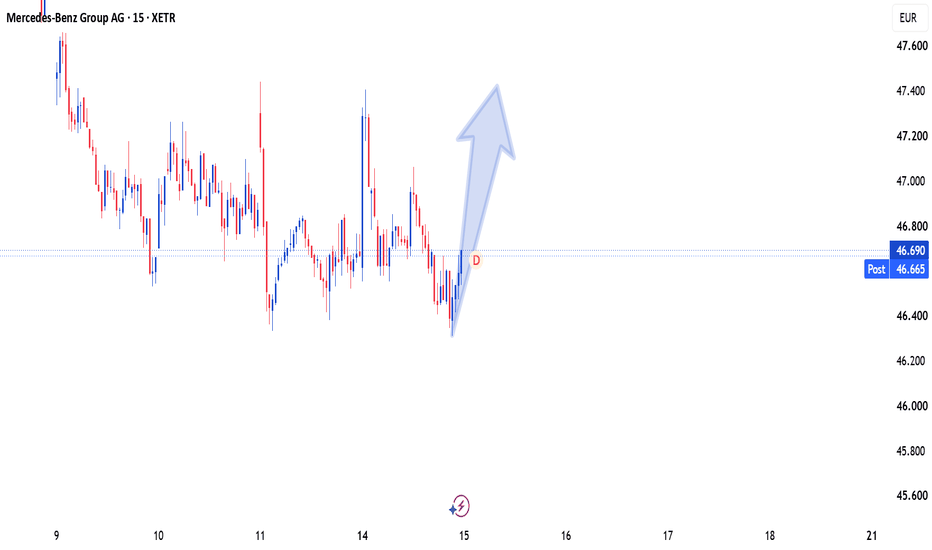
Deutsche Bank Aktiengesellschaft — Buy-Side Opportunity Deutsche Bank Aktiengesellschaft is currently presenting a promising bullish picture, with recent market behavior suggesting that the balance is gradually shifting in favor of buyers. The stock is showing encouraging signs of upward potential, and the broader outlook supports the possibility of further appreciation.
The current formation indicates that buying interest is becoming increasingly important within the market. Price has been holding its ground while the underlying structure continues to create opportunities for an upward extension. If this positive behavior remains in place, the stock could develop a stronger advance through the next phase of trading.
This setup is focused on the developing market environment rather than relying on a single price level. The objective is to follow the broader direction and remain aligned with the conditions supporting the buy-side scenario.
From a technical perspective, the current price action is beginning to favor higher valuations. Buyers appear to be gaining greater influence, while selling pressure has not shown enough strength to establish a meaningful shift toward the downside. This creates a constructive environment for the bullish thesis to continue developing.
Deutsche Bank's movement can also be affected by European banking-sector performance, interest-rate expectations, economic data from the Eurozone, credit-market developments, currency fluctuations, and wider investor sentiment. These factors may create volatility, but the present technical outlook remains focused on potential upside.
Projected scenario:
Current market formation → growing buyer participation → sustained upward development → further appreciation.
📍 Market Bias: Bullish
📈 Trade Direction: Buy
⚡ Market Condition: Constructive
🚀 Outlook: Potential for further upside
🎯 Focus: Buy-side continuation
The market is gradually creating a stronger case for the buyers, and Deutsche Bank Aktiengesellschaft remains positioned within a structure that could support further progress toward higher levels.  Long
Long
Volkswagen - One of The Greatest Value PlaysXETR:VOW
Volkswagen - 7.77x Earnings, A Falling Wedge, And A Monthly MACD Divergence. The Setup Is Building.
Volkswagen is one of the most unloved stocks in Europe right now and that is precisely what makes it interesting. Revenue for the twelve months ending June 2026 reached $375 billion, up 6.26% year-over-year. Against a consensus analyst price target of approximately €115, implying over 30% upside from current levels, the stock trades at just 7.77x TTM earnings. At a P/E TTM of just 7.77x, against a DAX average of 18-20x, you are paying less than half the price for every euro of earnings relative to the broader index. We are not dismissing the headwinds, Chinese market volume has fallen sharply, and management has flagged that planned cost cuts alone are not enough. But when a business of this scale trades at these multiples, a lot of bad news is already priced in. If margins merely stabilise, today's valuation is too low.
The Setup
VW is developing a textbook falling wedge, converging downward-sloping trendlines with six successful touches and bounces between support and resistance. Falling wedges resolve to the upside more often than not. If it breaks down instead, we are not interested, that is a falling knife and we will not be catching it.
What makes this setup particularly compelling is what is happening on the monthly timeframe simultaneously. While price has been falling, the MACD has completed a bullish crossover, a classic bullish divergence where momentum is turning before price does. On a monthly chart, where noise is significantly reduced, this signal carries real weight. It signals momentum is building while price is quietly consolidating at the end of the very tight wedge boundaries, the exact recipe for a breakout.
We are waiting for confirmation here. Despite the six-touch structure and the monthly divergence we are waiting for weekly close above wedge resistance.
Levels to Watch
Resistance 1 - horizontal price level respected multiple times
Resistance 2 - 200-day EMA, closely watched by institutions
Resistance 3 - long-term trend channel support now turned resistance
A clean break and hold above all three would confirm the full reversal of the downtrend and open the path toward a significant re-rating.
Long 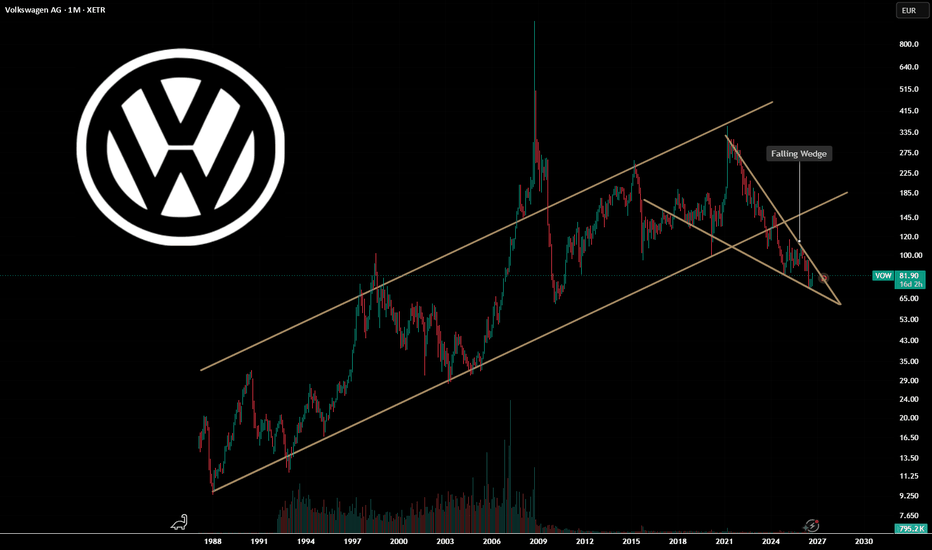
Siemens — Retracement First, Then Upside Toward 276Siemens is presenting a bullish opportunity with a two-stage price path. The immediate expectation is for the stock to experience a temporary decline toward the 242 area, followed by a renewed upward move toward the 276 target.
The projected dip should be viewed as an intermediate phase within the broader bullish scenario. Price may initially lose ground as the current movement develops, but the larger structure continues to leave room for a subsequent recovery and stronger appreciation.
The 242 region is therefore an important reference point in the setup. A reaction from this area could provide the transition required for the next upward phase, shifting attention toward the 276 objective.
Rather than expecting a straight climb from the current level, this analysis accounts for the possibility of a deeper retracement before the broader advance resumes. That makes the sequence particularly clear:
Current price action → decline toward 242 → bullish recovery → expansion toward 276.
The wider outlook for Siemens can also be influenced by industrial demand, infrastructure investment, manufacturing activity, global economic conditions, currency movements, and developments across European equities. These elements may affect timing and volatility, while the technical roadmap remains centered on the projected 242-to-276 progression.
The key distinction is between the short-term move and the broader directional idea. The anticipated weakness toward 242 does not automatically invalidate the bullish thesis; instead, it forms part of the planned route toward the higher objective.
📍 Initial Downside Area: 242
🔄 Expected Intermediate Move: Pullback
📈 Overall Bias: Bullish
🎯 Upside Objective: 276
🚀 Projected Route: 242 → 276
The market may take a step back before moving forward, but the larger setup remains focused on a potential bullish expansion toward 276 after the projected 242 retracement.  Long
Long
 Long
Long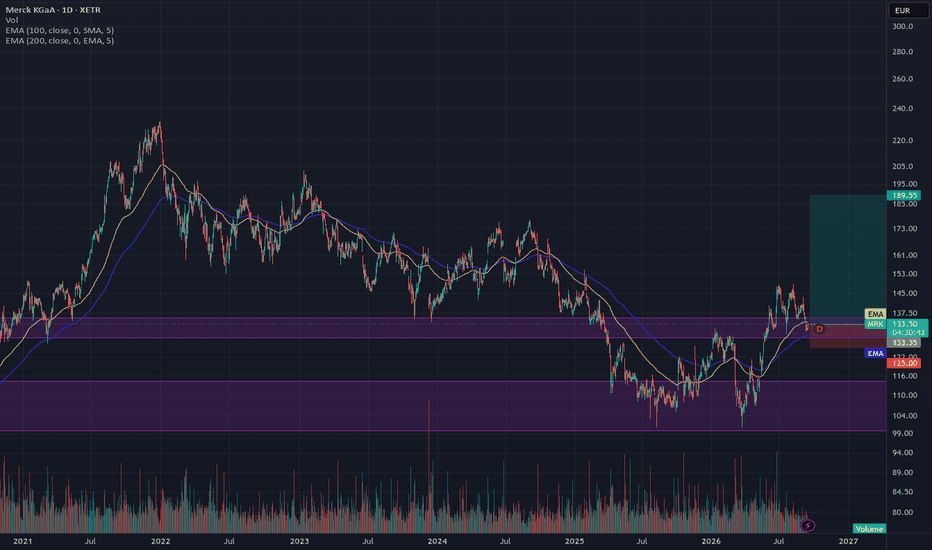
Schaeffler: Is the Market Still Pricing a Humanoid Robotics SuppI started looking at Schaeffler ( XETR:SHA0 ) as a traditional German automotive supplier. The deeper I went into the company’s humanoid robotics strategy, the more interesting the valuation disconnect became.
This is not a “humanoid robots will change the world, buy everything” thesis. The company still has real problems: high debt, weak free cash flow and a difficult automotive/e-mobility transformation.
But there is another business developing inside Schaeffler that appears to receive relatively little attention.
1. Humanoid robotics is already moving from R&D to contracts
Schaeffler says it is working with roughly 45 humanoid robotics developers globally and had already signed five contracts by May 2026. Management expects humanoid-related orders to reach the hundreds of millions of euros by 2030.
Its partnership with Humanoid is particularly interesting. Schaeffler became a preferred supplier for more than half of Humanoid’s joint-actuator demand, with the agreement covering at least one million actuators through 2031.
Schaeffler also plans to deploy Humanoid robots inside its own factories, effectively becoming both supplier and customer of the ecosystem.
2. The ecosystem is expanding
Schaeffler has announced humanoid partnerships with:
• Humanoid
• Hexagon Robotics
• Leju Robotics in China
• VinDynamics in Vietnam
The Hexagon agreement includes high-precision strain-wave and planetary actuators, while Schaeffler intends to deploy roughly 1,000 AEON humanoids across its manufacturing network over the coming years.
This is important because Schaeffler is not trying to pick which humanoid OEM wins. It is positioning itself as a motion-component supplier to multiple competing platforms.
3. Management has been buying shares
Several management transactions occurred around current price levels.
Astrid Fontaine, a member of the Management Board, reported acquisitions at approximately €7.30–€7.50, including one transaction of about €219k.
Jens Willem Schüler acquired approximately €659k of Schaeffler shares on Xetra in December 2025 at an average price of roughly €7.58.
Insider buying does not guarantee future returns, but I find it interesting that some management capital has been deployed around the same valuation area where the shares currently trade.
4. Why might the market be discounting it?
There are good reasons.
H1 2026 revenue was about €11.7bn and adjusted EBIT margin improved to 4.7%, but free cash flow was -€300m.
Net financial debt reached approximately €5.55bn, or about 2.4× EBITDA.
In other words, this is not a clean robotics growth stock. The legacy business and balance sheet matter.
And that may be exactly where the potential asymmetry comes from.
Today the market can reasonably view Schaeffler as a leveraged automotive/industrial supplier.
My question is:
What happens to the valuation if humanoid robotics becomes a meaningful high-growth portion of earnings over the next 3–5 years while debt and e-mobility losses decline?
The thesis does NOT require Schaeffler to become the next Nvidia or Micron.
It only requires the market to eventually assign a different multiple to a company increasingly exposed to robotics, automation and precision motion systems.
What I am watching:
• humanoid order growth
• conversion of prototypes into series-production contracts
• robotics revenue becoming visible in segment results
• EBIT margin improvement
• net debt reduction
• additional management purchases
Bear case: humanoid adoption develops slower than expected, automotive weakness continues, debt remains elevated and robotics never becomes large enough to materially move group earnings.
Bull case: Schaeffler becomes one of the major “picks and shovels” suppliers of the humanoid ecosystem while the market continues to value it primarily as an automotive supplier.
I currently own Schaeffler shares. This is my personal research and not investment advice. I am sharing the thesis because I would genuinely like to hear arguments against it.
What am I missing?  Long
Long
 Long
Long
 Short
Short
 Long
Long
BMW - TECHNICAL ANALYSIS MONTHLY TF EWP FIB TCBMW – Long-Term Monthly Structure Approaching a Critical Decision Zone
BMW’s monthly chart shows a remarkably well-defined long-term ascending structure extending back to the late 1980s. Despite several major corrections over nearly four decades, price has repeatedly respected the broader rising channel and its internal parallel trend lines.
The most important feature of the current setup is the convergence of long-term support around the €56–57 area.
Below the present price, the larger Fibonacci structure places the 0.382 retracement at €56.64, almost exactly at the major horizontal level marked at €56.40. That creates a very clear technical confluence rather than an arbitrary support assumption. This makes the area around €56.40–€56.64 the key level I am watching.
From an Elliott Wave perspective, the current decline can still be interpreted as a corrective movement within the larger secular advance, provided the long-term channel structure remains intact.
If that zone holds, the long-term bullish channel remains structurally intact and BMW would have the possibility of beginning another advance within the broader secular trend. The major resistance above remains the €123.75 zone marked by the previous long-term top.
A break above that level would be technically significant because it would represent a breakout from the major resistance that has capped BMW for more than a decade. The larger Fibonacci projection shown on the chart then places the next major extension around €200.50.
The downside is equally important. If BMW loses the €56 area decisively on a monthly basis, the next major Fibonacci levels on the chart are approximately €44.60 at the HWB, followed by €34.95 at the GZ. The separate horizontal support marked at €36.60 creates another important support cluster within that region.
That means the chart essentially presents two major long-term decision areas:
€56.50 is the first and currently most important support zone.
If that fails, the broader €35 region becomes the next major technical area.
The monthly RSI is currently in the lower half of its range, reflecting the weakness of the latest decline, but it is not yet deeply oversold. In other words, RSI by itself does not provide evidence that the correction has necessarily finished. Price behaviour at the support levels therefore matters more than trying to call an exact bottom from momentum alone.
What makes this setup particularly interesting is the scale of the chart. This is not a short-term trade based on a few candles. It is a test of a price structure that has developed over several decades. As long as the secular ascending channel survives, the long-term bullish structure remains valid. For me, therefore, the decisive question is not whether BMW looks “cheap” at €60 or whether the next candle is green or red.
The question is: Does BMW defend €56.40–€56.64 and remain inside its almost four-decade-long ascending structure? If the answer is yes, the risk/reward profile begins to become increasingly interesting. If the answer is no, the chart already identifies the next major long-term support area: roughly €33–€37.
Not financial advice. Like and follow for more Elliott Wave and macro technical analysis. Long 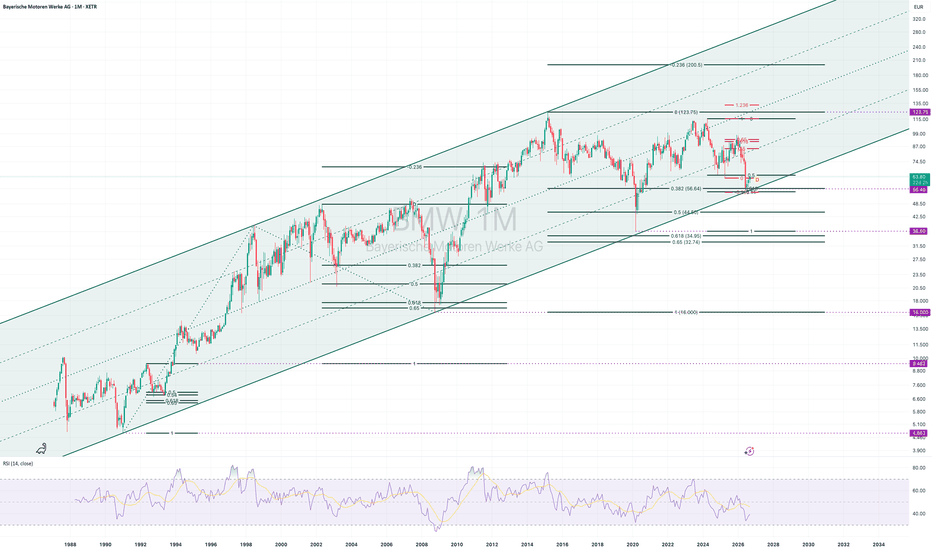
The German Auto DiscountLast Thursday evening, Volkswagen's supervisory board unanimously approved Zukunftsplan 2030 — the Future Plan. On Friday the shares closed up about 6.5% at €81.30, the strongest name in the Stoxx 600 that day.
Nothing about the company's earnings changed in those 24 hours. What changed was that a room full of people who had been unable to agree, agreed.
What was approved
Around 50,000 further positions go, management included, on top of roughly 50,000 already agreed since late 2024. The model portfolio gets cut by about half by 2035 and offering complexity by around 75% — fewer nameplates, higher volume per model, shared platforms and electronics. Capital tightens, with the 2027–2031 capex and R&D budget set below the previous planning round, and the portfolio of shareholdings slimmed by roughly a third.
The target is nine million vehicles and a nine percent operating margin by 2030. VW's operating margin in the first half of 2026 was 3.8%.
Two things were deferred, and they were the two that would have been hardest politically: a possible spin-off of the core Volkswagen brand, and immediate plant closures. Europe carries more than 500,000 units of excess capacity. Four German plants — Emden, Zwickau, Hanover and Neckarsulm — have no secured follow-on product from 2031 to 2034. The full European production concept is due by the end of June 2027.
So the plants are not closing. They are scheduled for a decision about closing, in twenty-one months.
Worth noting that closure isn't the only option for a plant. Rheinmetall's CEO publicly identified a Volkswagen site as suitable for armoured vehicle production, and another German defence manufacturer has already converted a railcar factory to build tank components. Nothing has been agreed at any of the four plants named here, but it does mean the excess capacity line has a possible buyer attached to it.
Deutsche Bank's note afterwards put it plainly: the approval removed the concern about whether the company was still capable of making hard decisions at all.
That is a repricing of decision-making capacity, not of profit. A company that cannot decide has no path to any outcome. But the plan and the result are separated by four and a half years.
Four companies, one label
German autos get discussed as a single trade. Up close, they don't behave like one.
Every German carmaker is dealing with the same headline problems. China turned from profit engine into a shrinking, hostile market. US tariffs on European-built cars have been moved, negotiated, litigated and threatened repeatedly. The EV transition arrived slower and more expensively than planned. German cost and energy stayed high while European volumes stayed below pre-Covid levels.
Same weather, four boats. But the market has not priced them anywhere close to alike, and the gap between the valuations is far wider than the gap between the businesses.
Volkswagen
The volume problem in its purest form. An operating margin around 4% and a return on equity under 3%. Nine million vehicles a year produced by a company that struggles to make money on any of them.
The market's verdict is the most extreme in the sector: roughly a fifth of book value. When a company trades there, the market is not saying "bargain." It is saying that a large share of those assets — the plants, some of the brands, the Chinese joint ventures — will not earn their cost of capital. The bad outcome is already assumed.
BMW
This is the one quietly working, and it gets much less attention than the others.
More profit than Volkswagen on 40% of the revenue, on double the operating margin and more than double the return on equity.
Here is the cleanest way to see what that's worth. The two companies earn almost exactly the same amount per share: €10.46 at Volkswagen against €10.38 at BMW. Volkswagen's shares cost €81.30. BMW's cost €62.64.
Same earnings per share, and Volkswagen costs 30% more. Because the per-share figures are near-identical, the price gap is the valuation gap.
BMW also pays a higher dividend, posted the only earnings beat in the group last quarter, and is down more this year — roughly a third against Volkswagen's fifth.
BMW's China deliveries fell about 20% in the first half. It is not immune. It has simply been hit less hard, and it went into the downturn with a stronger mix and a more flexible plant structure.
Mercedes-Benz
The China luxury story, in full. First-half China sales fell roughly 28%.
Operating margin sits between VW and BMW, and the dividend yield is the highest of the four. But it is not the cheap one — Mercedes trades at a higher multiple of earnings than Volkswagen and considerably higher than BMW, and its payout ratio is the most stretched of the group at roughly two-thirds of earnings, against under 40% at the other two.
Mercedes carries a specific structural exposure the others don't share equally: a large share of what it sells in the US is built in Europe, which makes it more sensitive than most to whatever the tariff rate turns out to be.
Porsche AG
And then there's this one.
Porsche's China deliveries fell about a third in the first half — the worst of the four. The dividend has been cut. The most recent quarter was a loss.
It trades at roughly 1.9x book, against Volkswagen's 0.2x.
There is something that partly explains the premium. Porsche's EBITDA margin is about 23.6%, comfortably the highest of the four and well ahead of Volkswagen's 15%. The business is more profitable than the loss suggests — depreciation and charges are doing the damage. The market isn't only paying for the badge.
The comparison
Trailing P/E — Volkswagen ~7.8x, BMW ~6.0x, Mercedes ~9.0x, Porsche ~40x
Price to book — Volkswagen ~0.20x, BMW ~0.5x, Mercedes ~0.5x, Porsche ~1.9x
Dividend yield — Volkswagen 6.5%, BMW 7.0%, Mercedes 7.6%, Porsche 2.4%
H1 China deliveries — Volkswagen −26%, BMW −20%, Mercedes −28%, Porsche −32%
All four reported recently, into the same conditions. Volkswagen missed expectations by about 46%. BMW beat by roughly 9%. Mercedes missed by around 10%. Porsche lost money. One quarter is noisy and auto earnings are lumpy with provisions and charges — but four companies, one set of headwinds, four different results is the argument of this whole piece in a single row.
Now look at Volkswagen and Porsche together.
Volkswagen's entire market capitalisation is about €40.8 billion. Volkswagen owns roughly 75% of Porsche AG, which the market values at about €38.7 billion — so that stake alone is worth somewhere near €29 billion.
Which implies the market values everything else inside Volkswagen — nine million vehicles a year, Audi, Škoda, SEAT, Cupra, Bentley, Lamborghini, Ducati, the Traton truck group, PowerCo, financial services — at something like €12 billion.
Caution here, because this is the kind of observation that looks like free money and isn't. VW carries a large net debt position, most of it inside captive finance. Holding-company and conglomerate discounts are completely normal and usually permanent. A stake you cannot sell is not worth the same as cash.
What the charts say
I've marked the zones where price reacted on each one
What they share: Volkswagen, BMW and Mercedes sit near the bottom of multi-year ranges.
Volkswagen has been in a trading range for about 4 years. It has bounced off a band near 69 that has now held twice. The zone above, around 101–109, is where the stock has been sold and price turned down again.
Four years of going nowhere is its own kind of information. A stock repeatedly sold at the top of its range and bought at the bottom is a stock the market has made up its mind about, and a fifth of book value is what that verdict looks like on the balance sheet. This is roughly where value investors do their shopping — after the damage, not during it.
BMW ranged widely between the high 50s and the mid 90s for four years and only arrived at the bottom of that range this summer - which puts the best numbers of the four at their lows for the first time in years.
Mercedes is also in a wide trading range. The line near 44 has held four times. In spring 2025 price fell through it and touched a lower support zone that had held since 2022. But price quickly reversed and moved up to the upper zone.
Porsche has spent more than a year inside a band roughly between 34 and 48. Its downtrend line broke over a year ago and it has been building a base since.
It's tempting to say the market has simply refused to reprice Porsche. It hasn't. Porsche fell about 65% from its 2023 peak — the worst of the four — and sits only a few percent above its all-time low. The repricing happened. It started from a level extravagant enough that losing two-thirds of the price didn't make it cheap.
What's actually shared, and what only looks shared
The headwinds are shared. The exposure isn't.
China hit all four, and hit the most expensive brands hardest — which is the opposite of what the valuations imply. Tariffs hit whoever builds in Europe and sells in America, which is Mercedes and Porsche far more than the others. Overcapacity and the German cost base are Volkswagen's problem far more than BMW's, because scale that can't be filled is only expensive when you have a lot of it. The EV transition is everyone's problem, but the money already sunk into it is very unevenly distributed.
So what it comes down to is this: the market has applied one discount to a sector containing four quite different companies, and then applied a completely separate rule to the one whose brand still commands a premium its reported earnings don't.
Whether that is a mistake or good judgement is the actual question here.
What I'd watch rather than predict
A few things that will tell you which way this goes before the 2030 targets do.
VW's June 2027 European production concept. That is the real test of whether capacity comes out or the deadline moves again.
Margin progression rather than margin targets. The gap from 3.8% to nine percent is enormous. Mid-single digits by 2028 would be a completely different story than flat.
Chinese relative share rather than absolute volume, since the whole market is shrinking and absolute numbers currently tell you as much about China as about any German carmaker.
Whether Volkswagen's next quarter looks anything like the last one. A 46% miss is one data point. Two in a row is a pattern.
And whether Porsche's premium survives another year of the numbers it has been printing. That gap closes eventually — the open question is from which direction.
Where I land personally
I might add some of these to my European dividend portfolio. Real assets that hold something in an inflationary environment. These carmakers will never move like the hot US tech and AI names, and that's fine, because that's not the job they're doing. As a European I also like holding assets in my home currency. Different portfolios, different logic, different risk profile.
And to be clear about what I'd be buying it for: two things, not one. The dividend is the part that pays for waiting. The re-rating is the part that pays if the turnaround is real. Neither alone would probably interest me much — a high yield on a business that keeps shrinking is just a slower way to lose money, and a turnaround with no income attached would mean paying to wait. Together they're a reasonable shape for me.
So this sector is naturally on my list. If I buy here, the bet is simple: that the turnaround is real, and that the market is currently paying me to wait while it happens.
Do I think the Germans can do it? On the manufacturing side, probably. This is a country that has spent a century being extremely good at building things, and Volkswagen's plan attacks the right variables — model sprawl, headcount, capital discipline, decision speed. Those are problems German industry has solved before.
What gives me more pause is the layer above the companies. Energy costs in Germany are among the highest in Europe, and that is a structural input none of these four control. They can fix their model portfolios. They cannot fix what it costs to run a factory in Lower Saxony. Some of what's weighing on these businesses is not a company problem at all.
Porsche I'd leave out either way because whatever discount I'd be buying, it isn't there. That doesn't mean the price can't go higher.
Beyond that I haven't yet decided, and the deciding is a decent mental exercise in itself. A few versions of the same idea:
Equal weight across Volkswagen, BMW and Mercedes. The lowest-conviction version — it takes the sector view without needing to be right about which company. The cost of not choosing is that you put the same money into the best-run one, and the cheapest on earnings, as into the most expensive one.
Tilted toward Volkswagen. Something like half in VW, a quarter each in the others. This is the restructuring bet: VW is by far the cheapest on assets, so it has the most to re-rate if the plan works. What you're accepting is that you're paying more per euro of current earnings than BMW asks, for a company with half the margin — and one that just missed expectations by 46%.
Tilted toward BMW. The mirror image, and the one the numbers point at more directly. Cheaper on earnings, double the margin, higher dividend, the only beat in the group last quarter. This isn't a bet on a turnaround at all — it's a bet that a company already working has been marked down with the sector and gets re-rated when the sector does.
Volkswagen alone. The highest-conviction version, and a different bet entirely — one company and timing, since it assumes the plan was the turn rather than just an event on the way. Both can be wrong independently, and the last quarter is a reminder that the operating business hasn't turned yet even if the governance has.
Or nothing yet. Wait for more data and monitor price action. After all, sidelines are a position, and there's no rule saying this has to be decided now.
Five versions, and they don't even agree on what cheap means. Volkswagen is cheapest on what it owns. BMW is cheapest on what it earns. Which of those you find more convincing decides most of the answer before you get to the weightings.
Three German carmakers is company diversification, not diversification. They share a sector, a country, a currency, a labour system and a tariff exposure. In the scenario that actually hurts — Chinese brands take another ten points of European share, or the trade situation goes the wrong way — all three go down together. It removes the risk of picking the wrong one. It does nothing about the risk of being wrong on the whole thesis.
The dividend makes the waiting bearable, not free. A 7% yield covers a 7% decline. It does not cover a 40% one. And it's calculated on earnings that have already fallen a long way — a payout that looks safe against depressed profits looks different again if profits fall further. It softens the wait. It is not a floor.
One thing before I finish
Everything above is dated 4 September 2026 and half of it will be wrong within a year. Auto data is genuinely messy — captive finance, equity-accounted joint ventures and one-off items land differently on different screens. Just check the date on anything that matters to a position.
Which of the four looks most interesting to you — the cheapest one, the best-run one, or the one whose premium hasn't cracked yet? Or no sound investment here? Feel free to get a discussion going in the comments.
Thanks for reading 😉 Long 
Long 
Adding Rheinmethall at the current priceRheinmetall is currently trading around €1,071 after a brutal June that saw the stock crash nearly 23% in a single month. The main trigger was Germany's abrupt cancellation of the €12 billion F126 frigate program on June 24, which sent shares down 19% in one day alone. That's the big drop visible on the chart — it's a panic event driven by one contract loss, not a sign the business is broken.
The recovery has already started. The stock bounced 4–5% as bargain hunters stepped in, and on June 30 the company confirmed a new Ukraine artillery contract with production already running in Spain, scheduled for delivery in Q1 2027. The core defense business is very much alive.
From a fundamental standpoint, the setup looks attractive. 18 analysts currently rate the stock a Strong Buy with zero sell ratings, and the average price target sits at €1,765 — roughly 68% above where it trades today. The next earnings report on August 6 could be a major catalyst, with revenue expected to hit €3 billion for the quarter.
On the chart, the plan is to ride a recovery back to €1,464 as the first target, which would represent a full retracement of the panic drop, and then on to €1,942 where the stock was trading before everything fell apart. The key level to watch on the downside is €932 — that's the floor. If it breaks below there with conviction, the trade is invalidated.
Risk/reward at current levels is solid, but the August earnings report is the real test. A miss there could put pressure on that support zone quickly. Long 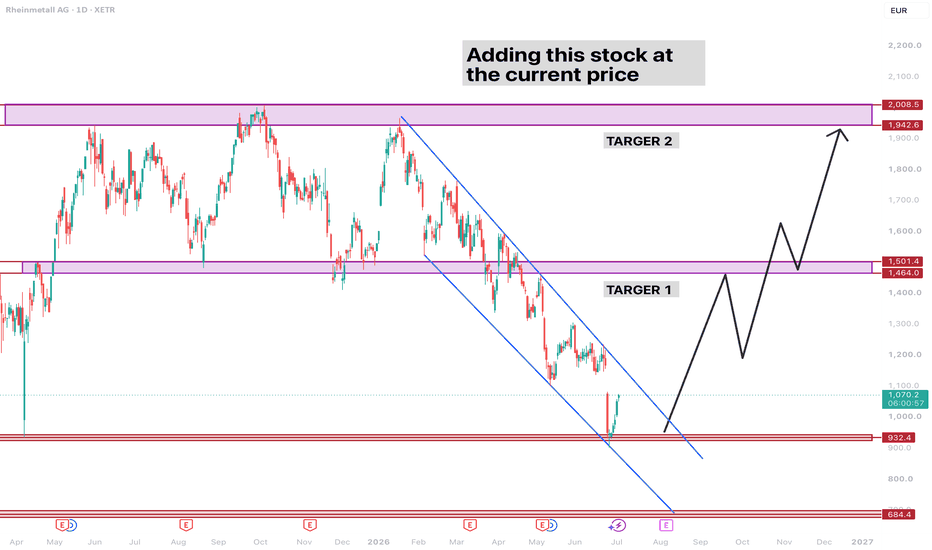
 Long
Long
Adidas: Corrective Top EstablishedAdidas shares have recently dropped more than 10%, accompanied by a downside price gap. In recent trading days, the stock managed a partial recovery, though renewed weakness has emerged in the latest sessions. Based on this price action, we now consider the corrective top below resistance at €196.40 to be established. As a result, we currently see ADS in a corrective phase and expect a corrective move to the downside, likely taking the stock below support at €129.95. Just below this level, shares should find a low and then begin another upward move. Alternatively, Adidas shares could continue their upward move directly, without further interim correction, and break through resistance at €196.40 (probability: 36%). SAP: Cloud Growth Meets a Deep Valuation ResetNYSE:SAP has fallen from roughly €280 to around €178, a drawdown of about 36% from its 2025 peak.
That correction is becoming interesting because the underlying business remains strong: cloud growth is above 20%, backlog continues expanding, free cash flow is rising and SAP is aggressively repurchasing shares.
But the Master Buy Scanner V2 is not yet giving a BUY signal.
The monthly setup remains:
WAIT — quality business, improving valuation, incomplete technical reversal.
Master Buy Scanner V2 — Monthly
Score: 2/3
Signal timeframe: 1M → 1M / 3W
Timeframe confidence: 1M OK
Action: WAIT
Decision: WAIT
BUY state: NO EVENT
Entry quality: OK — 45%
Setup maturity: CHASE
Position size: NONE — 0%
Top recent: SOFT
WT cross: TURN
Band 1: RED
Combined: GREEN 4/10
Bands synchronized: NO
Cycle: NO
WT1 / WT2: -36.64 / -32.45
The monthly oscillator has already fallen dramatically, but the technical structure is incomplete.
Band 1 remains red, the bands are not synchronized and the cycle has not fired. The WT setup is beginning to turn, but there is still no confirmed monthly BUY event.
The 3-week chart is slightly more constructive: the WT cross has occurred, Band 1 is green and the cycle remains active. However, its Combined reading is still only RED 4/10, so even the lower timeframe is not fully aligned.
This looks more like bottom formation in progress than a completed reversal.
Fundamentally, SAP remains very strong
SAP's Q2 2026 results showed:
Cloud revenue: €6.28B, +22%
Cloud ERP Suite revenue: +25%
Current cloud backlog: €22.9B, +27%
Total revenue: €9.88B, +9%
IFRS operating profit: +8%
Free cash flow: €3.0B, +27%
At constant currencies, cloud revenue grew 24% and current cloud backlog increased 26%.
This is important because SAP's share-price decline is not being accompanied by a collapse in operating performance.
The transition toward cloud subscriptions remains firmly intact.
Cloud backlog gives strong visibility
The €22.9B current cloud backlog is particularly important.
SAP is progressively replacing traditional software licences and support contracts with recurring cloud subscriptions. Software licence revenue fell 32% in Q2 and support revenue declined 8%, but cloud revenue grew 22%.
That transition creates short-term complexity, but structurally it should leave SAP with:
More recurring revenue
Greater revenue visibility
Higher customer lifetime value
A stronger platform relationship with enterprise customers
SAP continues to expect 23%–25% cloud revenue growth at constant currencies for FY2026.
AI could strengthen SAP's moat
SAP's AI opportunity is different from that of consumer software companies.
Its advantage lies in access to mission-critical enterprise data across:
Finance
Supply chain
Procurement
Human resources
Manufacturing
Customer operations
AI agents embedded directly within those workflows can potentially automate high-value enterprise processes rather than simply generate content.
SAP is expanding its Business AI platform while also acquiring companies such as Dremio and Prior Labs to strengthen the data and AI layer underlying its products.
The opportunity is significant because AI accuracy depends heavily on trusted enterprise data—and SAP already sits on enormous amounts of it.
The risk is that AI investment and acquisitions increase costs before monetization fully catches up.
Business quality is excellent
The scanner gives SAP a maximum 3/3 quality score:
Return on capital: 13.99% — GREEN
Margin trend: +3.25% — GREEN
Profitability: 15.91%
Cash-generation measure: 22.45%
For H1 2026, SAP generated €6.25B of free cash flow, and management still expects approximately €10B for the full year, versus €8.24B in 2025.
This gives SAP considerable flexibility to invest in AI, fund acquisitions and return capital to shareholders.
The €10B buyback matters
SAP launched a new €10 billion share-repurchase program running through the end of 2027.
By June 30, it had already repurchased approximately 16.3 million shares for €2.6B, at an average price of €161.16.
That average repurchase price is interesting relative to the current share price.
If SAP continues buying aggressively during the correction, lower prices allow the company to retire significantly more shares with the same capital.
Valuation is becoming reasonable
The scanner gives SAP 5.5/7 on valuation:
Cash yield: 4.18%
Business-price multiple: 12.8
Cash-flow multiple: 18.78
Earnings multiple: 26.09
Profit/share: €6.82
Debt-to-equity: 0.22
So SAP is not deep value.
But after the correction, its valuation is substantially less demanding for a business still generating 20%+ cloud growth and double-digit expected operating-profit growth.
The market is still assigning a premium for SAP's quality and recurring revenue, but the risk/reward is becoming more balanced.
Growth remains attractive
The scanner gives growth 3/4:
Future profit growth: -0.78% — RED
Estimate trend: neutral
Three-year profit growth: +46.36%
Three-year sales growth: +7.62%
Meanwhile, management continues to expect FY2026 non-IFRS operating profit of €11.8B–€12.2B, representing 13%–17% growth at constant currencies. The slight guidance reduction reflects more than €100M of dilution from the Dremio and Prior Labs acquisitions rather than deterioration in the core business.
Consensus currently expects further operating-margin expansion and higher EPS through 2027–2029.
Advanced setup: constructive, but not ready
The advanced scanner is reasonably positive:
Advanced score: 10/14 — 71%
Lifecycle: IDLE
Conviction: B+ — 76%
False bottom: OK
That combination tells a fairly clear story.
The fundamental quality is there.
The valuation has improved.
The downside move may be approaching exhaustion.
But the technical BUY cycle has not started yet.
Key technical levels
Immediate support: €160–€170
Major support: €140–€150
First resistance: €180–€185
Initial recovery confirmation: €195–€205
Major resistance: €220–€225
Structural recovery zone: €250–€260
Previous highs: approximately €275–€280
The recent rebound from the €130–€140 area is encouraging.
However, I would want to see SAP establish itself above €180–€185, together with a confirmed monthly WT cross and synchronized bands, before treating the current move as a durable reversal.
A move above approximately €200 would represent much stronger structural confirmation.
My classification: HIGH-QUALITY WATCH
SAP currently offers:
Maximum 3/3 business-quality score
Strong cloud and backlog growth
Improving margins and cash generation
Approximately €10B expected annual free cash flow
A €10B buyback program
A much more reasonable valuation
Strong positioning in enterprise AI
Deeply depressed long-term momentum
But technically:
Scanner score only 2/3
NO BUY event
Monthly WT cross not confirmed
Band 1 remains RED
Bands are not synchronized
Cycle has not fired
Recommended position size remains 0%
This is increasingly attractive—but cheap enough to watch is not the same as technically ready to buy.
Current verdict: WATCH — wait for the monthly signal.
What would you do?
A) Start a small position around €178
B) Wait for the scanner BUY signal
C) Wait for confirmation above €200
Master Buy Scanner V2:
This is not financial advice. Technical signals can fail, and even high-quality businesses can remain under pressure during valuation resets.  Long
Long


