Long
Long
Sartorius: When Opportunities Are Hidden in Lower TimeframesSartorius: When Opportunities Are Hidden in Lower Timeframes
Sartorius is a German company that has delivered an astonishing 30,000% return since 2008.
Yes, you read that right, investing €10,000 back in 2008 would have turned into €3,000,000 by 2021 , thanks in part to a final surge fueled by the COVID-19 boom.
Looking at the long-term weekly chart, we can clearly see a major trendline that was broken, sending the stock into a prolonged downtrend. So far, Sartorius has dropped 80% from its peak, and there might still be room for further declines before reaching key support areas, such as the 38.2% Fibonacci retracement and the pre-COVID highs.
Are we witnessing the last leg down before a major reversal? Or is there more pain to come?
Bounce at Key Local Support — Short-Term Opportunity
Right now, the price is bouncing off a very interesting local support, the same area that previously created a sharp V-shaped bottom . This pattern suggests buyers are stepping in aggressively, seeing these levels as a bargain .
Revisiting this area gives us a potential long entry .
It’s true we could aim for the upper boundary of the current channel for a +30% gain, but placing the stop loss would be tricky, it would need to be relatively wide and against the prevailing trend, which I’m not a fan of.
In situations like this, I zoom into lower timeframes to see if a more precise, short-term setup makes sense.
In this case, we can see that, in the very short term, the price has formed a base and broken above a resistance today. That breakout opens the door for a long trade aiming for a +3.5% return in 2–3 days , with a tight stop loss that still gives plenty of room for price action to breathe.
Based on my analysis of similar historical patterns, the odds of success are over 70%. With probability and risk/reward on our side, let’s go for it!
By first studying the higher timeframe trend and then zooming into the lower timeframes , traders can identify short-term opportunities that align with the broader market direction.
This alignment increases the probability of success, as trades are placed in harmony with the stock’s long-term momentum rather than against it.
💬 Does this setup align with your view on XETR:SRT ?
🚀 Hit the rocket if this helped you spot the opportunity and follow for more easy, educational trade ideas!
 Long
Long
 Long
Long
 Long
Long
 Long
Long
 Short
Short
Retro Editors' picks 2022Going further in our retro EP selection , we present to you the third collection of additional scripts that have earned a spot in our Editors' picks, now from 2022.
These retrospective selections reflect our continued commitment to honoring outstanding contributions in our community, regardless of when they were published. To the authors of these highlighted scripts: our sincere thanks, on behalf of all TradingViewers. Congrats!
Volume Profile, Pivot Anchored by DGT - dgtrd
Estimated Time At Price - KioseffTrading
Signs of the Times - LucF
Strategy (library) - TradingView
Intrabar Efficiency Ratio - TradingView
Over the next two months, in the last week of each month, we will share retro Editors' picks for subsequent years:
August: retro EPs for 2023
September: retro EPs for 2024
They will be visible in the Editors' picks feed .
Previously published retro Editors' picks:
May: retro EPs for 2020
June: retro EPs for 2021
█ What are Editors' picks ?
The Editors' picks showcase the best open-source script publications selected by our PineCoders team. Many of these scripts are original and only available on TradingView. These picks are not recommendations to buy or sell anything or use a specific indicator. We aim to highlight the most interesting publications to encourage learning and sharing in our community.
Any open-source script publication in the Community Scripts can be picked if it is original, provides good potential value to traders, includes a helpful description, and complies with the House Rules.
— The PineCoders team Infineon wave 3 to 62€ Gann-Methode🧠 Infineon (IFX.DE) - Massive Wave 3 in Progress 🚀 | Long-Term Elliott Wave Setup
Ticker: XETR:IFX
Exchange: XETRA 🇩🇪
Chart: Weekly (W1)
Technical Framework: Elliott Wave + Fibonacci + MA + RSI + MACD
🧩 Context:
Infineon has completed a massive corrective wave II (labelled in red) and is now in the early stages of a multi-year impulsive wave III. The price recently rejected at the 0.236 retracement (~35€) and is currently back-testing key moving averages. This zone could represent a wave (2) low of the internal (1)-(2)-(3)-(4)-(5) structure of orange wave ③.
🔎 Structure Breakdown:
✅ Wave (II) (in red) ended as a WXY-Flat-Correction, possibly in 2020
✅ Wave 1 and 2 of wave (III) are complete
✅ Current projection: we are in blue wave (3) of orange wave ③
📈 Fibonacci extensions suggest:
1.618x of wave (1) = ~53.83 €
2.0x = ~63.77 €
2.618x = ~77.11 € – ultimate long-term target for wave ③
🟦 Major resistance: 35–36 €, now acting as support
🟢 Key Moving Averages:
MA (32.7), MA (32.3), MA (31.96) are clustered — strong support zone
📊 Indicators:
MACD: Turning bullish, histogram just crossed above 0
RSI: Neutral (51), still lots of upside potential
Volume: Recent spike suggests accumulation during pullback
🔔 Key Levels:
Level Description
32.7 € Strong support (Fib 0.382 + MA)
39 € Fib 0.5 retracement
46.78 € 2.618x extension of orange wave ①
53.83 € Target: 1.618x of current wave (1)
63.77 € Major resistance / Wave (3) top?
77.11 € 2.618x extension of wave ③
🧠 Thesis:
If the recent low was wave (2), Infineon could be entering a parabolic wave (3) move with +50–100% upside potential over the next 12–18 months. The setup is supported by Elliott Wave structure, MA support, and volume confirmation.
⚠️ Risks:
Breakdown below ~30 € (0.5 Fib) would challenge this count
Macro events (e.g., chip cycle, geopolitics) may affect the timing
✅ Strategy:
I’m watching for confirmation of the local low around 32 €, and then adding during retracements. Targets are scaled into at 46 €, 54 €, and 63 €. Final wave (5) of ③ may push up to 77 €.
 Long
Long
Long 
 Long
Long
 Long
Long
 Long
Long
LVMH BUYLVMH is trading at around €468, well below its 2023 highs and at a significant discount to historical valuation multiples. The forward P/E is approximately 17x, versus a 5-year average of 24x. EV/EBITDA is under 10x, and the dividend yield is near 3%.
Fundamentals remain strong. LVMH continues to generate high free cash flow, maintains operating margins above 25%, and has one of the most powerful brand portfolios in the world. Weakness in Wines & Spirits and soft consumer demand in China have driven the stock lower, but long-term structural growth remains intact.
Recent developments include a 10-year partnership with Formula 1 through Glenmorangie, new retail leadership at Rimowa, and expansion of flagship stores in Asia focused on experience. These signal continued strategic positioning, not retreat.
With fair value estimates in the €550–600 range, LVMH currently offers 17–28% upside. A staged buy strategy between €455–470 appears well-supported. Short-term traders may use €430 as a technical stop.
LVMH offers long-term quality at a temporary discount.
 Long
Long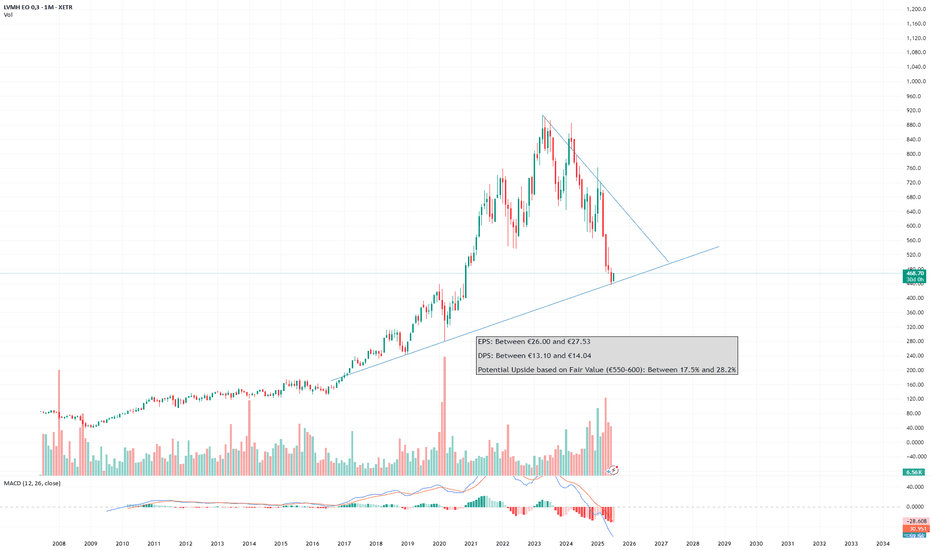
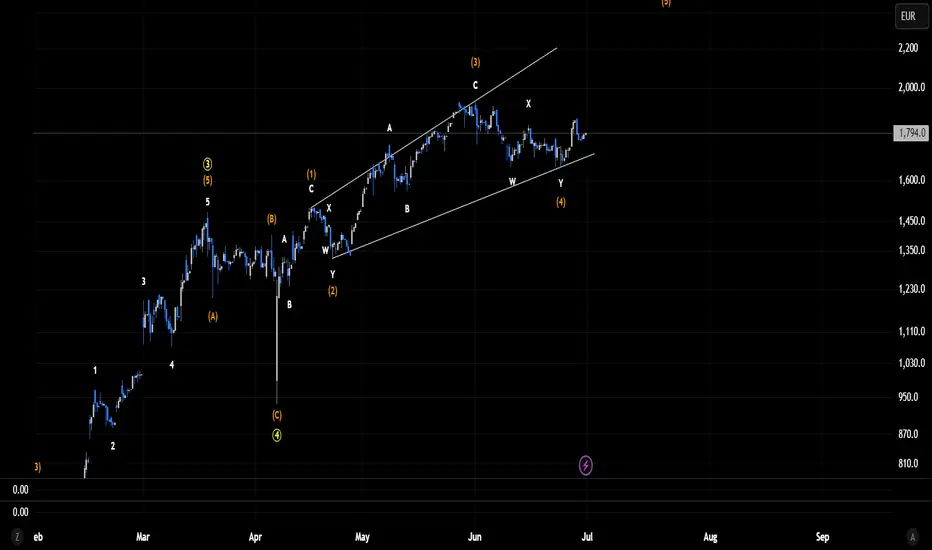
Rheinmetall Ag - Micro Timeframe EW-analysisI have two possible short-term scenarios for Rheinmetall. Both share the same structure on the higher degrees, but they differ slightly in the short term. Despite the difference in micro-counts, both scenarios remain bullish in the near term. As shown here, in this scenario, Wave 5 (yellow) is unfolding as an ending expanding diagonal, with each subwave in orange forming either a zigzag or a double zigzag. One small issue in this count is that Wave 4 (orange) hasn’t yet moved into the price territory of Wave 1 (orange), which is typically expected in an expanding diagonal. However, this is a guideline, not a rule so the count remains valid. Wave 4 (orange) may not be completed yet, and a break below the previous low would indicate that it's still in progress. For now, though, the structure suggests that Wave 5 (orange) has already begun and is expected to lead to a new all-time high. To validate this scenario, Wave 5 (orange) should unfold as a single zigzag (ABC) or a double zigzag (WXY). If instead it develops as a five-wave impulse, this count would be invalidated, and my second scenario would take over. The completion of this ending expanding diagonal would not only finish Wave 5 (yellow), but also mark the end of the larger Wave 3, (two degrees higher), which began on November 20, 2008.
With NATO recently announcing that nearly every European country except Spain will allocate 5% of GDP to defense, I expect that the correction following this major wave 3 impulse may be relatively shallow. More likely, we could see a broad distribution phase take shape, possibly in the form of a triangle rather than a sharp retracement.
Disclaimer: This analysis is for informational and educational purposes only and should not be considered financial or investment advice. All trading involves risk, and you should perform your own due diligence before making any trading decisions. The author is not responsible for any losses that may arise from reliance on this content. Always trade at your own risk.
 Short
Short
Long