Adidas - The Market Sold The Marketing Bill. We Are Buying The BXETR:ADS
Adidas - Wave 2 Complete. The Setup For Wave 3 Is Building.
Adidas is a business in the middle of one of the most impressive brand recoveries in European corporate history. Under CEO Björn Gulden, whose contract has been extended through 2030, the company has rebuilt its product pipeline, exited the Yeezy dependency, and reconnected with performance sport consumers. FY2025 delivered record revenue of €24.8 billion, net income up 75% to €1.34 billion, and operating profit of €2.06 billion, 54% higher than the prior year and significantly ahead of initial guidance. Direct-to-consumer revenue is growing at 25% with e-commerce up 27%. The performance category led by football and running grew 39% on a currency-neutral basis in Q2 2026. Full-year revenue guidance has been raised to 9–10% currency-neutral growth. By any brand and consumer-demand measure, Adidas is performing at the peak of its recovery cycle.
This context matters. Because the chart is not reflecting a broken business. It is reflecting a market that has punished a temporary cost line.
Our Trade - Entry, Exit, And What Comes Next
We first initiated a position in Adidas in March 2026 when price retested the long-term trend support that has defined the stock's trajectory across multiple cycles. That retest was clean, price arrived at support, buyers absorbed the selling, and the structure held. We sold our position in the high €180s, where price rejected the 200-day EMA acting as dynamic resistance. That was the right exit for that leg.
What happened after is the setup we are now trading.
The Earnings That Created Wave 2 - And Why
Following our exit near the high €180s, Adidas reported its Q2 2026 earnings on July 30th. On the surface, the numbers were extraordinary, record quarterly net sales of €6.74 billion, surpassing analyst expectations by 2.4%, and a revenue guidance upgrade to 9–10% currency-neutral growth. By any revenue measure, this was the strongest quarter in company history, boosted by the FIFA World Cup.
The market sold it 16–18% in a single session, the steepest single-day decline since the company's IPO in November 1995.
The reason was not the revenue. It was the cost structure beneath it. Adidas spent €924 million on marketing in Q2, a 30% year-over-year increase, to fund its World Cup campaign featuring Timothée Chalamet, Lionel Messi, Jude Bellingham, and Lamine Yamal. That spending drove Q2 operating profit to €574 million, roughly €49 million below consensus. More critically, management held full-year operating profit guidance at approximately €2.3 billion despite raising revenue guidance, removing the upward revision the market had priced in and implying a 15% consensus earnings downgrade according to RBC Capital Markets analysts. The CFO's announced departure added a layer of leadership uncertainty on top of the profit miss. The combined effect was a repricing event that had nothing to do with the health of the brand and everything to do with the market's disappointment that exceptional revenue growth was not translating into proportional profit leverage in the near term.
This is the earnings disappointment that created the Wave 2 we had been anticipating.
The Elliott Wave Structure
Following the bounce off long-term support and the subsequent rejection at the 200-day EMA, the channel that formed on the way up from the March 2026 lows constitutes Wave 1, a clean, impulsive move with defined structure. The break below that channel, triggered by the earnings reaction described above, confirmed Wave 2 had begun. That corrective wave bottomed at approximately €148, a sharp, swift decline consistent with the character Wave 2 corrections typically exhibit.
Price has since retraced back to the €160 horizontal support level, a level that has now been respected on four separate occasions. The speed of the recovery from €148 to €160 is meaningful, it is not the behaviour of a market that has lost conviction in the underlying asset. It is the behaviour of a market that sold on a headline and reconsidered when the price reached structure.
Wave 2 is complete. The evidence is multi-layered.
The €160 support confluence is the most important level on this chart right now. It represents not one support but three converging simultaneously: the well-established horizontal support respected four times across the past year, the midpoint of the Bollinger Bands which has absorbed the selling and is now holding as dynamic support, and the psychological reset level following the earnings overreaction. When multiple independent technical methods converge at the same price, the probability of that level holding increases substantially. That is what we see here.
Wave 3 - The Target
Under Elliott Wave theory, Wave 3 is typically the most powerful and extended wave of an impulse sequence. Our primary target for Wave 3 is the 1.618 Fibonacci extension of Wave 1, which aligns with the downward-sloping resistance visible on the chart, a confluence of Fibonacci measurement and structural resistance. That confluence is the natural target for Wave 3 to exhaust itself before a Wave 4 correction begins.
The falling wedge that preceded this entire structure is an additional bull case confirmation. Falling wedges are among the most reliably bullish reversal patterns in technical analysis, the tightening compression before the explosive release. The breakout from that wedge established the directional bias. The Elliott Wave structure provides the roadmap.
Our Current Position And What We Are Watching
We have initiated 50% of our intended position at current levels, anchored by the €160 confluence support and the Elliott Wave structure described above. This is a deliberate, disciplined sizing decision.
We will add the remaining 50% only when price breaks above and holds the previous high of €190 on a weekly closing basis. That level represents the confirmation that Wave 3 has genuinely begun and that the market has absorbed the earnings overhang entirely. Chasing below €190 exposes capital to the risk that this is a more extended Wave 2 than anticipated. Waiting for €190 to be reclaimed eliminates that risk at the cost of a slightly higher entry on the second tranche, a trade-off we are entirely comfortable with.
Conclusion
The business is recovering. The earnings reaction was a cost-timing story, not a brand story. The technical structure shows a completed Wave 2, three-way support confluence, and a clear Fibonacci extension target for Wave 3. We are positioned. We are patient. We are watching €190.
Capital preservation first. Confirmation before conviction.  Long
Long
 Long
Long
 Long
Long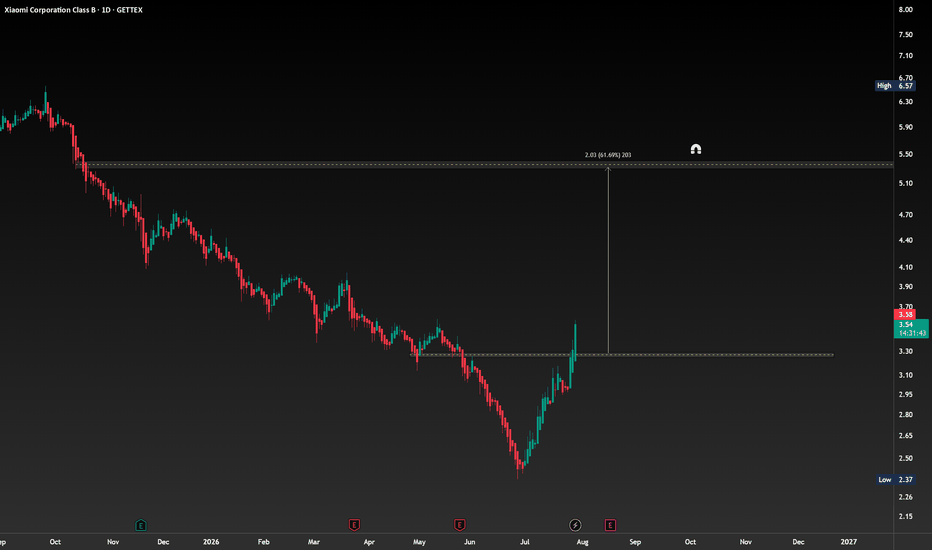
Luxury Wins, China Spins | Mercedes Q2 BreakdownMercedes Benz's Q2 2026 report showed a company caught between two very different realities. On one hand, revenue slipped 3% year over year to €32.1 billion as global vehicle sales remained under pressure, particularly in China. On the other hand, EBIT climbed 22% to €1.55 billion while EPS jumped 20% to €1.14, proving that aggressive cost controls and operational efficiency are helping offset weaker demand
Investors were also encouraged by adjusted EBIT rising 16% to €2.3 billion, suggestin profitability is holding up better than headline sales would imply
🇨🇳China Remains the Biggest Headwind
The biggest concern remains China, where Mercedes continues to lose ground in the premium segment. Q2 deliveries in China plunged nearly 30%, dragging total Asia sales down 27%, while global Mercedes Cars deliveries fell 8% to 417,765 units. In contrast, Europe and North America delivered encouraging growth, with Europe up 4% and North America climbing 13%, showing the brand still commands strong pricing power in developed markets. The regional split highlights that Mercedes' biggest challenge isn't global demand it's reclaiming momentum in the increasingly competitive Chinese luxury EV market
⚡EV Business Is Finally Picking Up Speed
Electrification remains one of the brightest spots. While overall electrified vehicle sales declined slightly, battery electric vehicle (BEV) deliveries surged 51% year over year to more than 52,800 units, driven by strong demand for the new electric GLC, CLA and GLB. Plug-in hybrid sales, however, dropped sharply due to discontinued models in China and weaker tax incentives in the United States
This shift suggests Mercedes is successfully transitioning customers toward full EVs instead of relying on hybrids, an important step as the company prepares more next gen electric launches over the coming quarters
💰Cost Cutting Is Saving the Quarter
Another positive surprise came from businesses outside the core passenger car division. Mercedes-Benz Vans posted a strong 83% jump in EBIT thanks to resilient commercial demand, while Financial Services nearly doubled operating profit as higher returns and stable financing activity supported earnings
Meanwhile, management continued its company wide efficiency program, expanding retail divestitures, launching a productivity initiative in Germany, and accelerating cost reductions. Those restructuring efforts helped offset pressure from lower vehicle volumes and demonstrate management's commitment to protecting margins during a challenging industry cycle.
🚀New Models Keep the Long term Story Alive
This week's earnings also reinforced Mercedes' long-term strategy rather than changing it. Management highlighted continued investment in new products, including the electric C Class, refreshed S Class lineup, new VLE electric van platform, and MB.OS software ecosystem. At the same time, the company announced plans to expand into defense related vehicle applications through a partnership with TYTAN Technologies, creating another potential long-term revenue opportunity beyond traditional automotive markets. Combined with ongoing cost-cutting initiatives, these developments suggest Mercedes is positioning itself for stronger profitability once global auto demand recovers
📈Margin Strength vs China Weakness
Overall Benz delivered a mixed but better than feared quarter. Sales remain under pressure, particularly in China, and management's lower outlook reflects that uncertainty.. However, stronger than expected profitability, rapid BEV growth, disciplined cost control, and improving performance in Vans and Financial Services indicate the business is becoming more resilient despite a difficult macroeconomic backdrop. For investors, the key catalyst over the next few quarters will be whether new EV launches and a stabilization in China can reignite volume growth while preserving the higher margins that management has worked hard to defend..
Would you buy BENZ after these earnings or wait for China to recover?
 Long
Long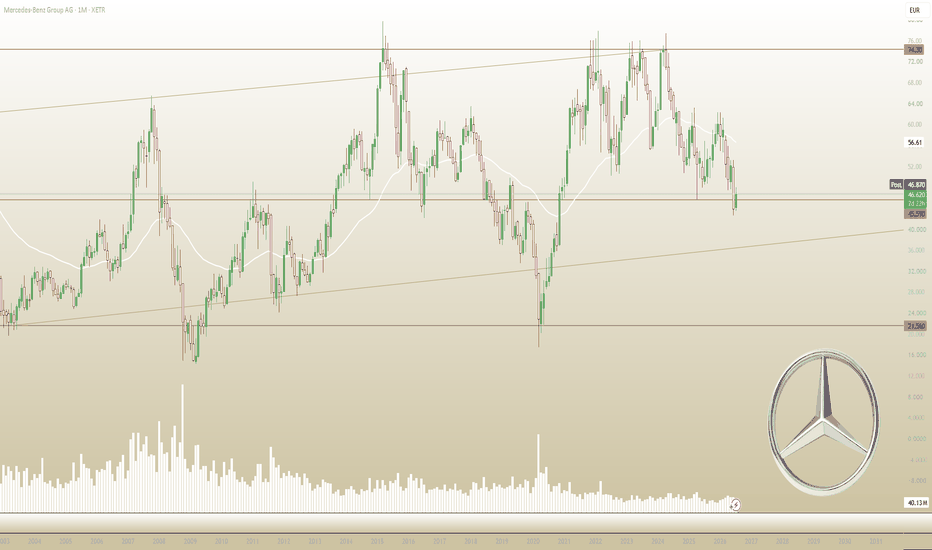
Symrise Rebounds: Quality Compounder Reset or Recovery?Symrise ( XETR:SY1 ) has fallen from above €130 to approximately €68 before staging a sharp recovery toward €87.
The decline has removed a significant part of the premium historically attached to this flavors, fragrances and specialty-ingredients company.
My Master Buy Scanner V2 has now generated a full 3/3 BUY signal on the monthly chart.
But this is not a straightforward deep-value setup.
The technical recovery is confirmed, business quality remains positive and cash generation has improved—but the reported earnings multiple is still high, growth was negative in the latest quarter and the scanner’s combined technical reading is only 4/10.
THE SIGNAL
The monthly scanner currently shows:
• Overall signal: BUY — 3/3
• Action: BUY / BUILD
• Decision: INVEST
• Buy state: SETUP READY
• Entry quality: EXCELLENT — 80%
• Setup maturity: CONFIRM
• Model position size: NORMAL — 50%
• Technical cycle: FIRED
• Bars since BUY: 3
• Top recent: YES
• WaveTrend cross: YES
• Bands synchronized: YES
• Combined technical reading: GREEN — 4/10
Unlike some of the early or tactical signals previously identified by the scanner, Symrise has already reached the CONFIRM stage.
However, the 4/10 combined reading suggests that the broader technical recovery remains incomplete. The signal is constructive, but the stock has not yet repaired its entire long-term trend.
WHY SYMRISE IS INTERESTING
Symrise operates behind thousands of everyday products rather than selling directly to consumers.
Its ingredients are used in:
• Food and beverages
• Fine and consumer fragrances
• Cosmetics and personal care
• Pet food
• Oral care
• Nutrition and health products
• Natural and functional ingredients
The company estimates that consumers interact with products containing its ingredients 20–30 times per day.
This creates an attractive business model: Symrise’s ingredients normally represent only a small percentage of the customer’s total production cost, but they can have a major influence on taste, smell, performance and purchasing decisions.
Symrise is also one of the four largest companies in a flavors-and-fragrances market where the leading players collectively control more than two-thirds of industry sales.
Large consumer-goods companies generally work with a limited list of approved suppliers, creating significant regulatory, technical and relationship-based barriers to entry.
THE 2025 FUNDAMENTAL PICTURE
Symrise delivered respectable full-year 2025 results despite a challenging demand environment:
• Organic sales growth: 2.8%
• Reported sales: €4.93 billion
• Adjusted EBITDA: €1.08 billion
• Adjusted EBITDA margin: 21.9%
• Margin improvement: 120 basis points
• Adjusted Business Free Cash Flow: €780 million
• Business Free Cash Flow margin: 15.8%
• Adjusted EPS: €3.67
• Reported EPS: €1.78
The company achieved approximately €50 million of savings and efficiency gains during the year, exceeding its €40 million target.
Its adjusted EBITDA margin reached its highest level in a decade, while cash conversion improved substantially.
These are not the financial characteristics of a broken business.
THE REPORTED-EARNINGS PROBLEM
The scanner currently shows an earnings-price multiple of 48.82x, which appears extremely expensive.
However, this calculation is based on reported EPS of €1.78.
Reported earnings were materially reduced by non-cash impairments, including:
• €148 million related to the Terpene business
• €150 million related to the Swedencare investment
Adjusted EPS was €3.67.
At a share price around €87, that produces an adjusted earnings multiple closer to 24x—not 49x.
That is still not objectively cheap, but it presents a very different picture.
Investors therefore need to distinguish between:
• Reported earnings distorted by impairments
• Adjusted operating profitability
• Actual cash generation
Symrise looks expensive on reported profit, moderately valued on adjusted earnings and more attractive on cash flow.
THE LATEST QUARTER
The first quarter of 2026 was mixed:
• Organic sales declined 0.4%
• Reported sales fell to approximately €1.25 billion
• Taste, Nutrition & Health organic sales grew 1.7%
• Scent & Care organic sales declined 3.4%
• The full-year outlook was reaffirmed
Management described the quarter as stronger than anticipated and expects organic growth to improve sequentially during the year.
Regional performance was positive in Asia-Pacific, North America and Latin America. Europe, Africa and the Middle East declined against demanding comparisons.
The company still expects for 2026:
• Organic sales growth of 2%–4%
• Adjusted EBITDA margin of 21.5%–22.5%
• Business Free Cash Flow margin above 14%
The guidance is credible—but it requires a meaningful acceleration after the first-quarter decline.
TASTE, NUTRITION & HEALTH
This remains Symrise’s largest segment.
During Q1:
• Organic sales increased 1.7%
• Reported sales were €749 million
• Food & Beverage delivered low-single-digit organic growth
• Naturals and Savory achieved mid-single-digit growth
• Beverages produced low-single-digit growth
• Pet Food achieved low-single-digit growth
The segment benefits from exposure to relatively defensive everyday-consumption categories.
In 2025, Taste, Nutrition & Health generated:
• €3.03 billion of reported revenue
• €722 million of adjusted EBITDA
• An adjusted EBITDA margin of 23.8%
The margin improved by 160 basis points, showing that the efficiency program is having a measurable impact.
SCENT & CARE
Scent & Care currently presents a more complicated picture.
In Q1:
• Organic sales declined 3.4%
• Reported sales were €500 million
• Fragrance continued growing at a low-single-digit rate
• Consumer Fragrance achieved mid-single-digit growth
• Fine Fragrance achieved low-single-digit growth
• Care & Wellness declined at a low-double-digit rate
• UV-filter sales experienced a double-digit decline
• Aroma Molecules declined at a mid-single-digit rate
Fragrance remains resilient, but weakness in UV filters and aroma molecules is weighing on the segment.
This explains why the stock cannot yet be treated as a fully synchronized growth story.
THE FLORAL CONCEPT ACQUISITION
Symrise recently signed an agreement to acquire Floral Concept, a French premium natural fragrance-ingredients company located in the Grasse region.
The planned acquisition would combine Floral Concept with Symrise’s Maison Lautier operation to create a broader premium-naturals platform.
The strategic rationale is attractive:
• Growing demand for traceable natural ingredients
• Greater differentiation in fine fragrances
• Expanded sourcing and extraction capabilities
• Stronger exposure to premium products
• Potentially greater pricing power and margin resilience
The transaction is expected to close during the third quarter of 2026, subject to customary conditions. Financial details were not disclosed.
The acquisition fits Symrise’s strategy, but investors should still monitor the purchase price, integration and effect on leverage once more information becomes available.
BUSINESS QUALITY
The scanner rates Symrise’s business quality GREEN:
• Quality score: 2/3 — 67%
• Return on capital: 4.32% — ORANGE
• Margin trend: -1.86% — ORANGE
• Profitability measure: 6.48%
• Cash-generation measure: 10.52%
The overall quality classification is positive because the company has:
• Diversified defensive end markets
• High customer-switching barriers
• Strong global market positions
• Recurring product demand
• Improving adjusted margins
• Strong cash conversion
But the scanner is also correctly identifying two limitations.
Return on capital is not especially high, and the longer-term margin trend has not yet fully recovered.
Symrise is a good business—but the current data does not classify it as a perfect compounder.
VALUATION AND DEBT
The scanner gives Symrise a GREEN valuation-and-debt assessment:
• Value score: 5/7 — 71%
• Cash yield: 4.28% — ORANGE
• Business-price multiple: 15.29x — ORANGE
• Cash-flow multiple: 17.28x — GREEN
• Reported earnings multiple: 48.82x — RED
• Current reported profit per share: €1.78
• Debt-to-equity: 1.05 — GREEN
• Debt/profit indicator: approximately €1.75 billion / 1.77
The valuation is therefore attractive relative to Symrise’s own historical premium—but it is not a conventional bargain.
The strongest part of the value case is cash flow.
The weakest is reported earnings, although those were distorted by impairments.
At approximately €87, the market is pricing in some recovery, but considerably less long-term optimism than it did above €120.
BALANCE SHEET AND CAPITAL ALLOCATION
At the end of 2025:
• Net debt was €1.62 billion
• Net debt including pensions and leases was €2.09 billion
• Net leverage was approximately 1.9x adjusted EBITDA
• Net debt declined by €216 million year over year
That places leverage within the company’s long-term target range of 1.5x–2.5x.
Symrise also launched its first share-repurchase program, authorizing up to €400 million of buybacks through October 2026.
Repurchasing shares after a substantial valuation reset could create value—provided that management does not overpay for acquisitions or weaken the balance sheet.
THE DIVIDEND
Shareholders approved a dividend of €1.25 per share for fiscal 2025, marking the company’s 16th consecutive dividend increase.
At approximately €87, that represents a yield of roughly 1.4%.
This is not an income investment.
The dividend’s attraction lies in its consistency and growth record rather than its current yield.
For Symrise, reinvestment, acquisitions and share repurchases are likely to remain more important components of shareholder returns.
THE ONE SYM TRANSFORMATION
Symrise’s ONE SYM transformation program is intended to improve:
• Commercial execution
• Portfolio prioritization
• Innovation efficiency
• Digitalization
• Organizational alignment
• Structural costs
• Cash generation
The company generated approximately €100 million of cumulative structural savings across 2024 and 2025.
The next stage is more difficult.
Cost reductions can improve margins temporarily, but sustainable shareholder value ultimately requires organic revenue growth.
The investment thesis therefore depends on Symrise successfully converting its efficiency gains into renewed commercial momentum.
THE TECHNICAL SETUP
The monthly chart shows a significant rebound after the stock tested the €68–72 area.
Key levels I am watching:
• €84–86: immediate support
• €78–80: secondary accumulation area
• €68–72: major structural support and invalidation zone
• €90–92: immediate resistance
• €96–100: first major confirmation area
• €104–108: important long-term resistance
• €116–124: major recovery zone
The BUY signal occurred near the bottoming area, and the cycle has now been active for three monthly bars.
The stock has already rallied substantially, so the risk-to-reward is less attractive than it was near €70.
Holding €84–86 would keep the short-term structure constructive. A monthly close above €92 would confirm additional strength, while recovering €96–100 would provide better evidence that the long-term downtrend is ending.
A sustained move below €78 would weaken the setup. Losing €68–72 would invalidate the current bottoming thesis.
THE BULL CASE
• Strong position in a concentrated global industry
• Exposure to defensive everyday-consumption categories
• High barriers to entry and embedded customer relationships
• Adjusted EBITDA margin at a decade high
• Record Business Free Cash Flow
• Net debt declined in 2025
• Food, Beverage, Pet Food and Fragrance remain resilient
• €400 million share-buyback program
• 16 consecutive dividend increases
• Strategic expansion into premium natural fragrances
• Full-year 2026 guidance reaffirmed
• Monthly scanner signal is confirmed
THE BEAR CASE
• Q1 organic sales declined
• Scent & Care remains weak
• UV filters and Aroma Molecules face difficult conditions
• Growth must accelerate to achieve full-year guidance
• Reported earnings are distorted by large impairments
• Adjusted valuation near 24x earnings is not cheap
• Return on capital remains modest
• Margin trend is still ORANGE
• Combined technical reading is only 4/10
• The rebound from €68 has already reduced the margin of safety
• Further acquisitions could create integration or capital-allocation risk
MY CURRENT PLAN
I would treat Symrise as a quality-recovery setup rather than a deep-value trade.
My framework would be:
• Consider partial exposure while €84–86 holds
• Avoid chasing a rapid move directly into €90–92 resistance
• Add after a constructive monthly close above €92
• Increase conviction if the stock recovers €96–100
• Watch whether organic growth accelerates toward the 2%–4% guidance
• Monitor Scent & Care, UV filters and Aroma Molecules
• Track adjusted margins, cash conversion and acquisition spending
• Reduce conviction below €78
• Reassess the entire thesis if €68–72 fails
The scanner’s NORMAL 50% model allocation reflects the balance of the setup: stronger than an early starter signal, but not yet deserving maximum exposure.
TRY THE SCANNER
Symrise is a useful example of why a scanner should analyze more than price momentum.
The headline signal is BUY—but the underlying dashboard reveals the complete picture:
• Technical recovery: CONFIRMED
• Business quality: GREEN
• Valuation and debt: GREEN
• Growth outlook: ORANGE
• Reported earnings valuation: RED
• Cash-flow valuation: GREEN
Master Buy Scanner V2 separates VALUE BUY, QUALITY BUY, GROWTH WATCH, TACTICAL and NO BUY situations while combining technical timing with business quality, valuation, debt and growth.
Add it to your own TradingView charts here:
Run it across your watchlist and post the next ticker you want me to analyze.
THE QUESTION
At approximately €87, how would you approach Symrise?
A — Buy or build because the quality and cash-flow recovery are confirmed
B — Wait for a monthly breakout above €92–100
C — Avoid because growth is too weak for a roughly 24x adjusted valuation
Comment A, B or C—and share your Symrise thesis below.
This is not financial advice. Always conduct your own research and manage risk according to your investment horizon.
 Long
Long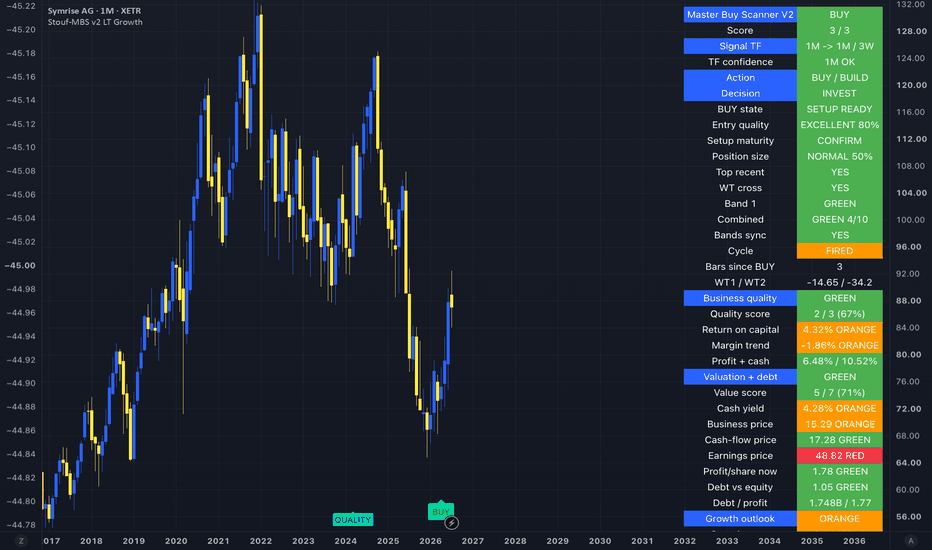
Volkswagen chokes between U.S. tariffs and Chinese pressureBy Ion Jauregui – Analyst at ActivTrades
Volkswagen is facing a challenging period marked by international trade pressure, slowing demand and the structural transformation of the automotive industry. The German manufacturer reported a 10% decline in operating profit during the second quarter, to €3.5 billion, and has revised its forecasts downward, now acknowledging that its revenues in 2026 could fall by up to 3%.
The company estimates that U.S. tariffs could have an impact of up to €5 billion annually, adding pressure to margins already affected by the high costs of the transition towards electric vehicles and investment in new technologies.
Volkswagen finds itself caught between two fronts. On the one hand, U.S. trade barriers are penalising its exports and increasing costs. On the other, the offensive from Chinese electric vehicle manufacturers, with more competitive cost structures and rapid technological innovation, is reducing the historical advantage of European manufacturers.
China, which for years was one of the key markets for the German group, has become one of its main challenges, with growing competition from local brands such as BYD in the electric vehicle segment.
The stock loses ground after the Christmas rally
On the stock market, Volkswagen continues to reflect investors’ doubts about the group’s ability to restore profitability. The share price reached a low of €69.20 on July 1 and was trading around €72.66 during the first hours of Monday’s session.
Since the end of the Christmas rally, the stock has been losing ground from highs of €109.15, without managing to surpass the previous high of €114.20 reached in March 2025. This performance has resulted in a gradual price decline over recent months.
From a technical perspective, the daily chart’s point of control shows a highly polarised volume distribution around the previous range located at €90.82, a level that could act as a reference point for a potential price recovery.
The MACD remains in negative territory, although accompanied by a positive histogram that points towards a possible stabilisation of the bearish movement. The RSI stands at 41.08%, entering moderate oversold territory and showing initial signs of recovery.
The 50-session moving average crossed below the 200-session moving average in March, confirming a technical deterioration that subsequently extended the decline.
Meanwhile, the ActivTrades Europe Market Pulse market sentiment indicator currently shows a neutral risk environment, with no signs of excessive positioning or extreme investor sentiment.
Volkswagen remains one of Europe’s major industrial benchmarks, but the market now demands clear results in efficiency, cost reduction and the ability to compete in a new era dominated by electrification and Asian competition.
*******************************************************************************************
The information provided does not constitute investment research. The material has not been prepared in accordance with the legal requirements designed to promote the independence of investment research and such should be considered a marketing communication.
All information has been prepared by ActivTrades ("AT"). The information does not contain a record of AT's prices, or an offer of or solicitation for a transaction in any financial instrument. No representation or warranty is given as to the accuracy or completeness of this information.
Any material provided does not have regard to the specific investment objective and financial situation of any person who may receive it. Past performance and forecasting are not a synonym of a reliable indicator of future performance. AT provides an execution-only service. Consequently, any person acting on the information provided does so at their own risk. Political risk is unpredictable. Central bank actions can vary. Platform tools do not guarantee success.
 Long
Long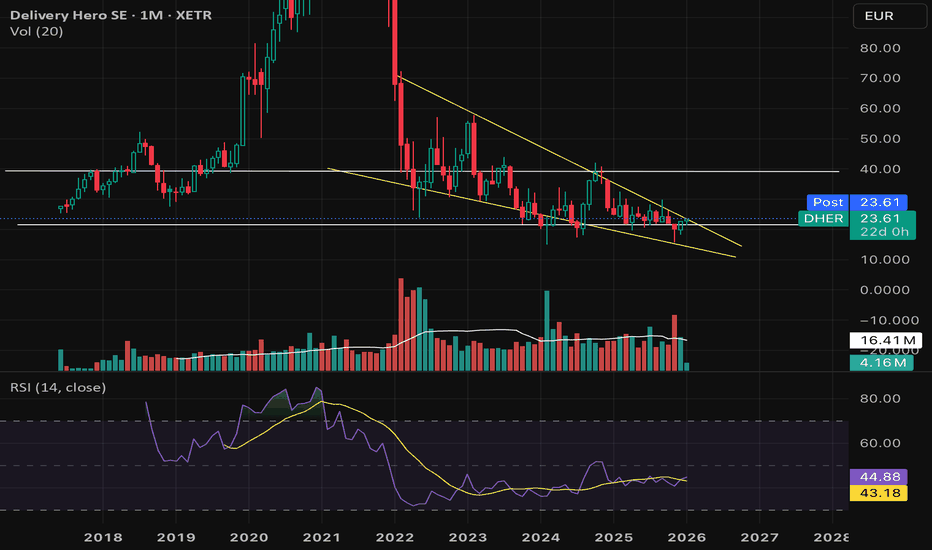
Long 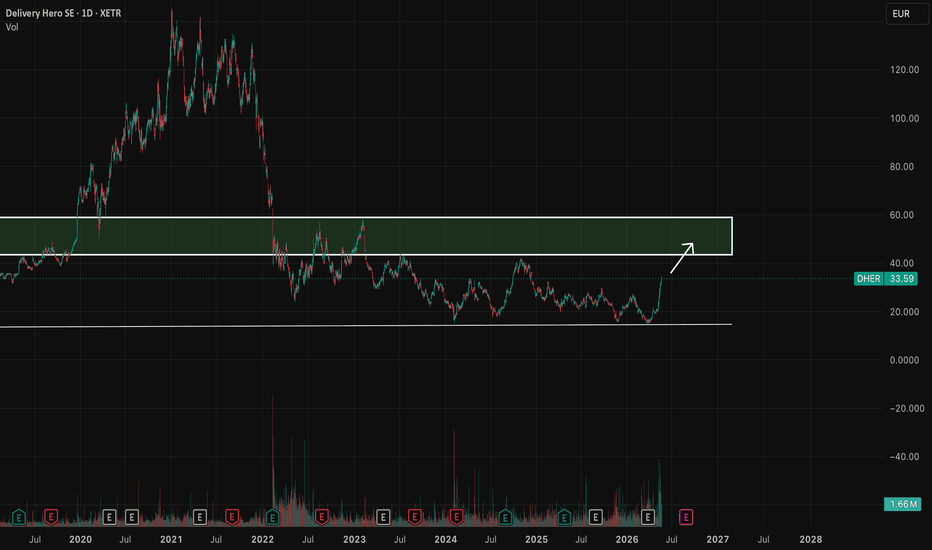
DHER | Why Uber Spent $15 Billion on Delivery HeroUber just announced the biggest acquisition in its history, spending $15 billion to build a global delivery business that would have taken years to create market by market
The deal, announced on July 16, will see Uber acquire Delivery Hero, the Berlin based company behind brands like foodpanda, Glovo, talabat, and Baemin. Uber will pay €41.50 per share in cash, higher than its initial €33 offer in May. Before the agreement, Uber already owned 25% of Delivery Hero and had another 12% of economic exposure through financial instruments. Prosus has also agreed to sell its 17% stake, giving Uber control of roughly 53% of the company before other shareholders tender their shares
So why is Uber making such a big move?
Delivery Hero gives it a strong presence across Asia, Latin America, the Middle East, and parts of Europe. Excluding 14 overlapping markets, Uber will add operations in 50 countries that generated about $42 billion in gross bookings last year
The acquisition also strengthens Uber's broader ecosystem. Its platform will expand from 79 to 99 markets, with combined 2025 gross bookings expected to reach $236 billion. The number of cities where Uber offers both ride-hailing and food delivery will jump from 34 to 58. According to Uber, customers who use both services generate about three times more gross bookings and profit than those who only use one. They're also much cheaper to acquire because Uber can cross-sell existing users instead of paying for new customer acquisition. That makes Uber One membership even more valuable.
The price tag isn't cheap .. Uber is paying about 14 times EBITDA before any cost savings, which is a high multiple for a delivery business with relatively thin margins.
But CFO Balaji Krishnamurthy believes the company can unlock $1.2 billion in annual cost synergies within 18 months by moving Delivery Hero onto Uber's technology platform. If those savings are achieved, Uber estimates the effective purchase price falls to roughly 8 times adjusted 2027 EBITDA. Management also expects the deal to boost nonGAAP earnings per share immediately after closing
Why It Matters
Consolidation is accelerating , DoorDash bought Deliveroo, Prosus acquired Just Eat Takeaway, and now Uber is buying Delivery Hero. Food delivery is increasingly becoming a scale business, leaving fewer independent players able to compete
Regulators remain a hurdle , To improve its chances of winning approval, Uber agreed to sell 14 overlapping markets, including Türkiye, Spain, and Poland, to SSW Partners for about $1.6 billion. The companies expect the deal to close in the second half of 2027, showing that antitrust approval is likely to be a lengthy process
It's also a long term defensive move , As autonomous vehicles become more common, ride hailing could face pressure. A much larger delivery business gives Uber another way to keep customers engaged and generate revenue, even if the economics of rides change over time
Uber paid a premium for a company whose major shareholders were ready to sell, and it structured the transaction to improve its chances with regulators. If management delivers the promised $1.2 billion in synergies, the effective valuation could end up looking attractive. But execution is the real challenge
Integration won't even begin until the deal closes, which likely won't happen until late 2027 .
Long 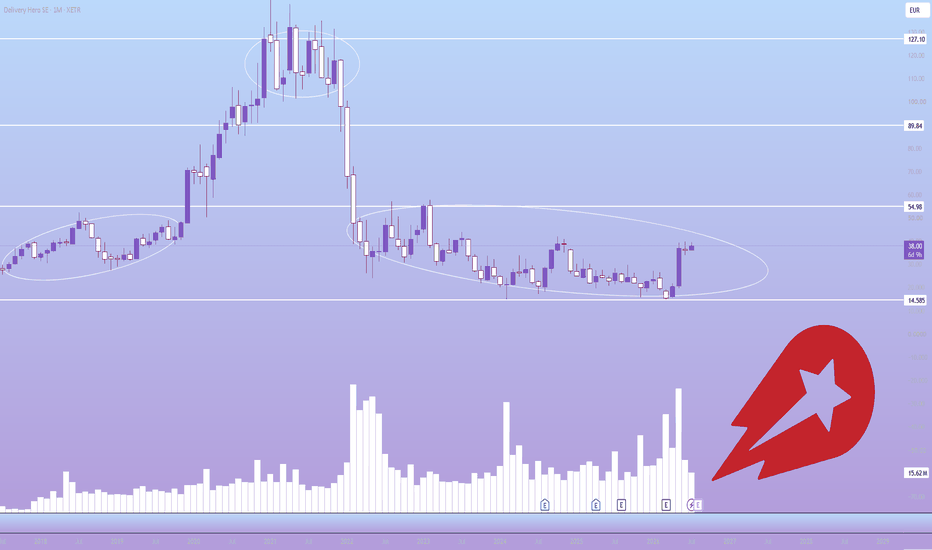
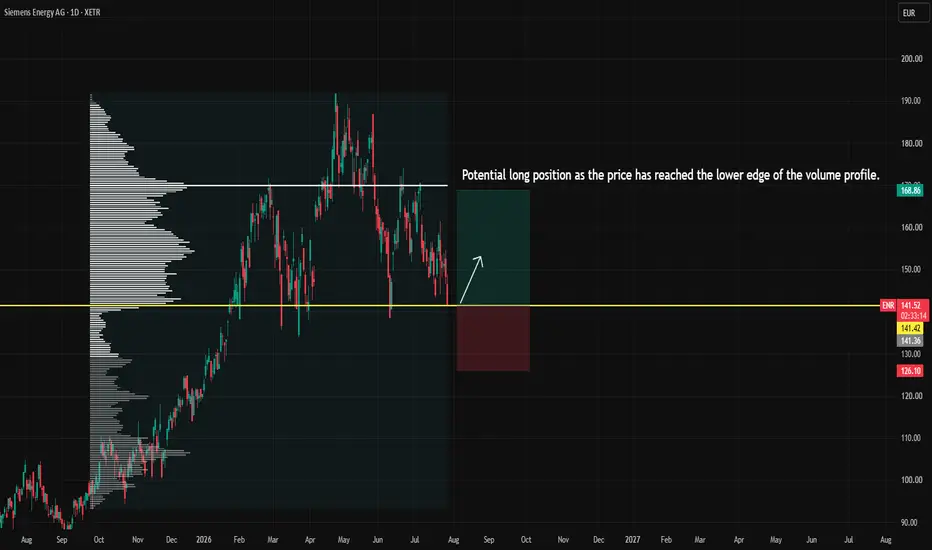
VERBIO & ENERGY SECURITY The market continues to value Verbio as if the German THG quota market is inherently cyclical. I believe that assumption overlooks the structural changes that have taken place over the past two years.
The collapse in THG prices from around €550/t to €85/t was not the result of normal market cyclicality. It was primarily driven by fraudulent biodiesel imports from China that severely distorted supply, undermined confidence, and temporarily broke the economics of the system.
Today, the market operates under a fundamentally different framework.
The EU has tightened verification requirements, significantly restricted fraudulent imports, removed double counting, and reinforced the integrity of the compliance market. At the same time, Europe’s energy policy has shifted decisively toward domestic production, strategic resilience, and reducing dependence on imported fossil fuels.
This matters because the EU cannot achieve energy security without sustained private investment. Building biomethane plants, advanced biofuel capacity, and renewable fuel infrastructure requires long-term economic visibility. Stable blending mandates and a robust THG quota market are not simply environmental policies—they are investment signals. Without them, capital deployment slows and Europe’s energy transition becomes more vulnerable.
There is also an increasingly important climate dimension. Europe is experiencing record-breaking heatwaves, prolonged droughts, and extreme weather events that would have been considered exceptional only a decade ago. As climate impacts become more visible, political pressure to accelerate decarbonisation is likely to intensify rather than weaken. That should further support ambitious blending targets and compliance mechanisms such as the THG quota system.
Against this backdrop, today’s THG price of approximately €500/t should not be viewed in isolation. It reflects a market operating under a significantly stronger regulatory and structural foundation than the one that existed during the previous cycle.
An important point that is often overlooked is that Verbio typically signs contracts on an annual basis. As these contracts are renewed in the current pricing environment, the stronger THG economics should increasingly flow through to financial results during FY2026/27.
With higher blending mandates across Europe, stronger regulatory enforcement, an increasing focus on energy independence, and growing urgency around climate policy, the long-term outlook for renewable fuel producers appears materially stronger than many investors currently appreciate.
Sometimes the biggest investment opportunities emerge when the market mistakes a structural reset for a temporary cycle.
 Long
Long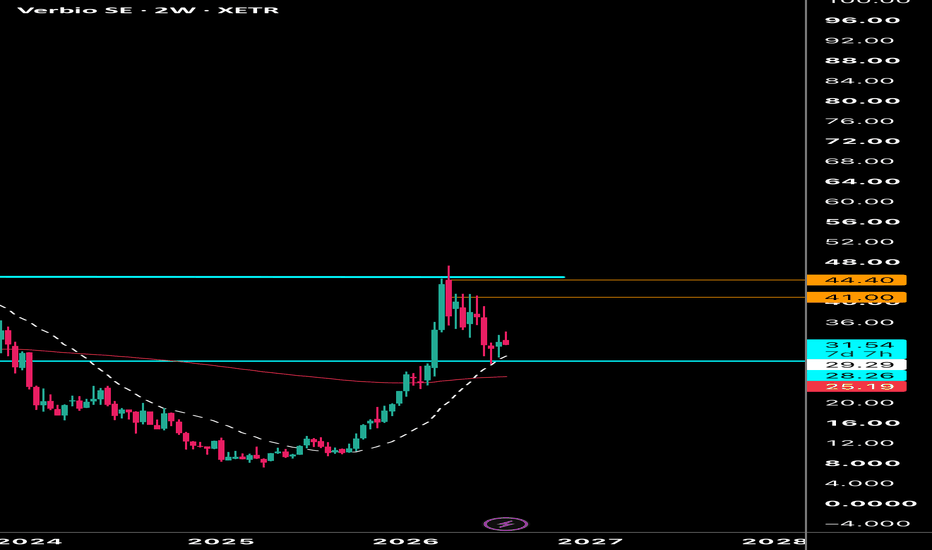
 Long
Long
SAP: The Software Behind the World’s Supply ChainsABOUT: SAP is the world’s largest provider of enterprise application software and the global leader in enterprise resource planning. Its products connect finance, procurement, human resources, manufacturing, supply chains, travel, expenses and customer management. The company earns revenue primarily through cloud subscriptions, software licenses and maintenance services, with its legacy on-premises business steadily shifting to the cloud.
The pitch is straightforward: SAP is a wide-moat enterprise software leader turning a massive installed customer base into a faster-growing recurring-revenue platform. In Q1 2026, cloud revenue grew 27% at constant currency, Cloud ERP Suite revenue grew 30%, operating profit increased 24%, and current cloud backlog reached €21.9 billion. With AI increasingly integrated into its mission-critical applications, margins expanding and the supplied valuation sitting approximately 50% below fair value, SAP offers an attractive combination of durable switching costs, visible growth and valuation upside.
SAP offers a combination that is difficult to find:
Wide moat: mission-critical software, high switching costs, complex implementations and deeply embedded customer workflows.
Visible cloud growth: the €21.9 billion current cloud backlog provides substantial forward revenue visibility.
Operating leverage: recurring cloud revenue is growing faster than total revenue, while operating profit is expanding faster than both.
Enterprise AI distribution: SAP can introduce AI directly into the finance, supply-chain and operating systems customers already use.
Valuation support: the supplied Morningstar estimate places the stock approximately 50% below fair value.
STATS:
GreenBlue: 1,023 / 2,500
GreenRed: 520 / 2,712
Morningstar: 5 stars; approximately 50% below fair value
Moat: Wide
Capital allocation: Standard
Fair-value uncertainty: Medium
GuruFocus: 77 / 100
Risks: SAP has historically operated with lower margins and less consistent execution than some major software competitors. Cloud migrations are complex, implementation cycles can be lengthy, and the transition replaces highly profitable maintenance revenue with subscriptions recognized over time. The counterargument is that SAP’s deeply embedded ERP systems, large backlog and high switching costs provide a durable customer base from which cloud revenue, margins and AI adoption can compound for years.
Competitors: ORCL, MSFT, CRM, WDAY, NOW, IBM  Long
Long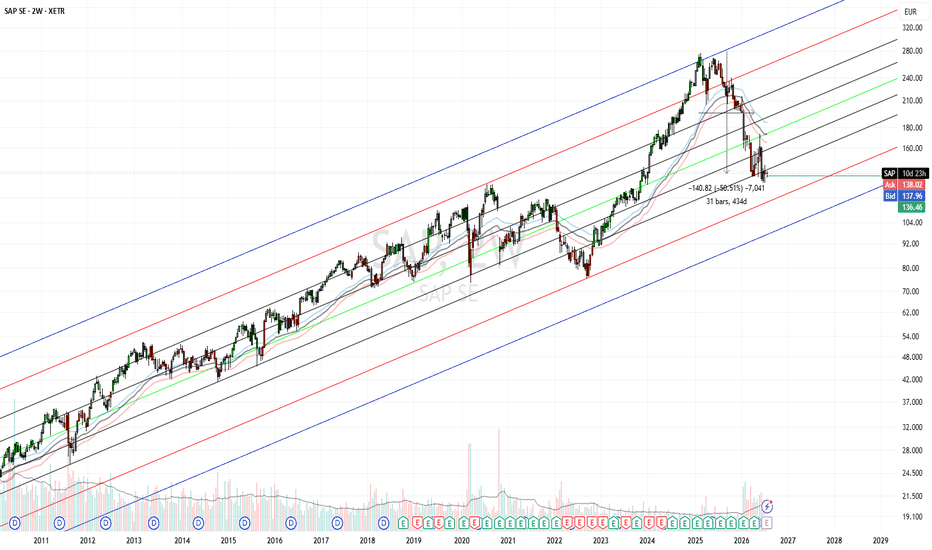
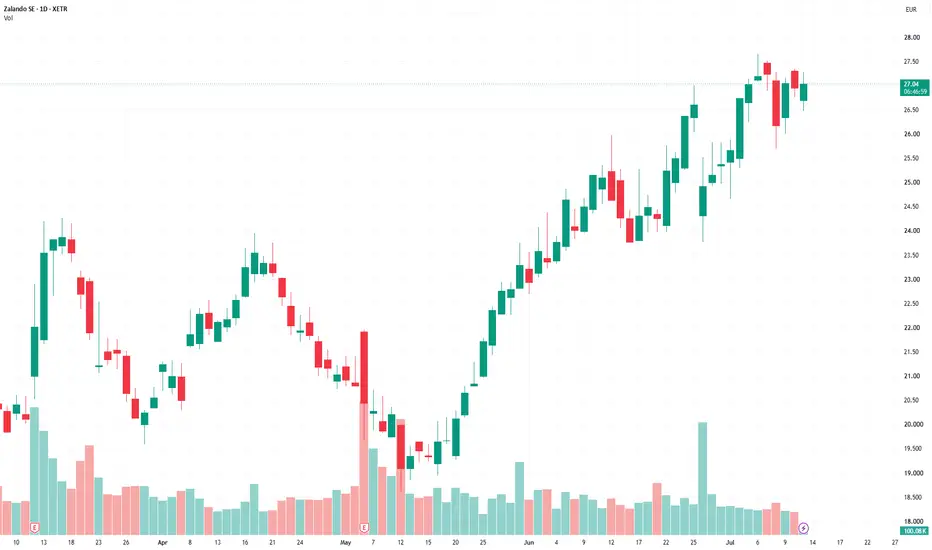
Zalando SE: AI and Robots Lend a HandZalando SE’s growing use of AI tools and the integration of ABOUT YOU could support further upside in ZAL shares.
Xetra ticker: ZAL
Current price: €25.66
Target price: €29.50
Upside potential: 14.96%
Zalando shares have nearly 15% upside to the €29.50 target price, supported by stronger quarterly results, the expanding use of AI, and the integration of ABOUT YOU. The company reported higher revenue and adjusted EBIT in the first quarter, while management reaffirmed its 2026 guidance and highlighted AI-driven improvements in customer engagement and operational efficiency.
Reasons to Buy
Quarterly revenue growth amid the rollout of AI tools and the integration of ABOUT YOU. In its first-quarter report, Zalando recorded revenue growth, expanded its AI capabilities, and made progress on the integration of ABOUT YOU. In the first quarter, reported GMV increased by almost 22% year over year, while reported revenue rose by 24%. Adjusted EBIT grew by 39% to €65 million, with a margin of 2.2%. On a pro-forma basis, GMV amounted to €4.3 billion, up 6%, while revenue reached €3 billion, up 3.4%.
Management reaffirmed its 2026 guidance, noting that AI is improving both customer engagement and operational efficiency. Around 10 million marketplace visitors used the company’s AI assistant during the quarter, compared with 6 million in all of 2025. Warehouse robots autonomously process around 2 million items per month, while computer-vision tools process approximately 6,000 product images per day. Around 85% of these images are uploaded to the platform within three days.
Recommendations from leading investment banks. Twenty-six investment banks currently cover Zalando, 20 of which rate the stock “Buy.” These include Deutsche Bank and BNP Paribas, each with a target price of €35; UBS, with a target price of €36.50; and Citi, with a target price of €42. The remaining six banks rate the stock “Hold.” The average target price is €35.
Technical outlook. ZAL shares have broken above the downtrend that began in February 2025. After testing resistance at €27, the shares pulled back. A sustained break above this level could pave the way for a move toward €29.50.
Bottom line: The expanded use of AI tools and the integration of ABOUT YOU underpin the upside case for ZAL shares.
Tags - #Freedom Holding #Freedom Broker #Zalando, ZAL, E-commerce, Fashion Retail, AI, About You, GMV, Revenue Growth, Adjusted EBIT, German Stocks, Investment Idea
 Long
Long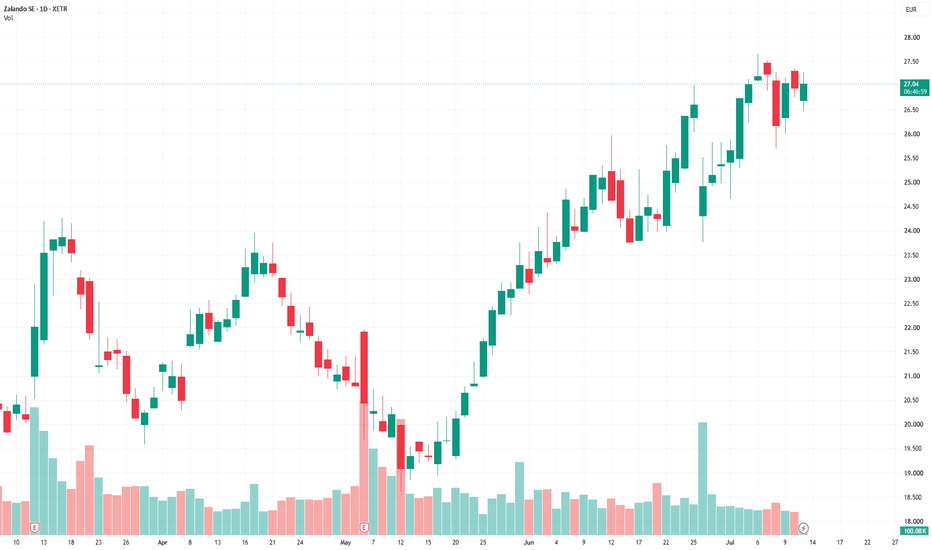
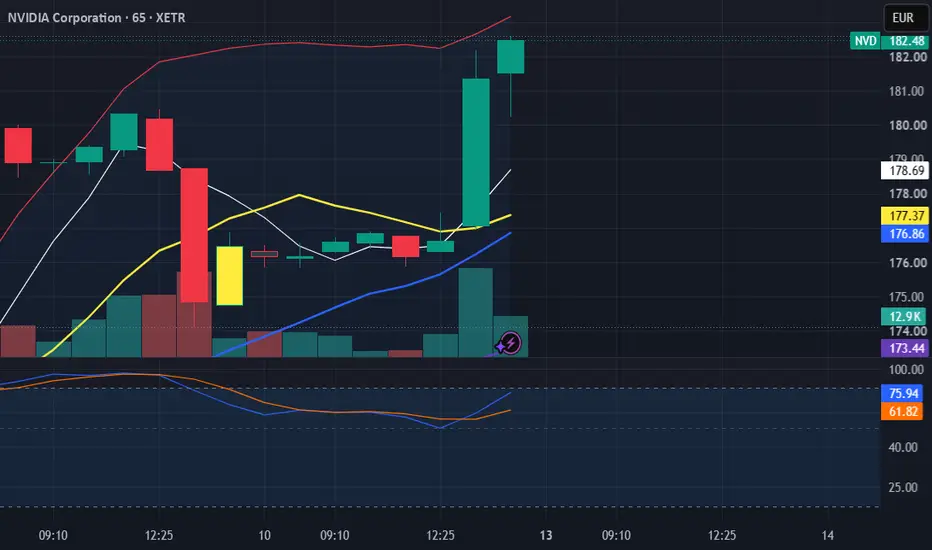
NVDA: BULLISH BIAS FLASHBias: BULLISH — daily, weekly, and monthly all flash bull. Invalidation: a close below the 204–205 support shelf.
Pivot-Ladder:
Daily (Mon, Jul 13):
DR3 — 223.08
DR2 — 217.04
DR1 — 214.00 ← first target
CDL — 207.96 ← daily bias line
DS1 — 204.92 ← support shelf
DS2 — 198.88
DS3 — 195.84
Weekly (Jul 13–17):
WR3 — 237.45
WR2 — 224.23
WR1 — 217.59 ← confluence with DR1, ~3.5 apart
CWL — 204.37 ← weekly bias line, stacked on DS1
WS1 — 197.73
WS2 — 184.51
WS3 — 177.87
Monthly (July 2026):
MR3 — 267.46
MR2 — 249.87
MR1 — 224.98
CML — 207.39 ← confluence: sits within half a point of CDL
MS1 — 182.50
MS2 — 164.91
MS3 — 140.02
The setup: CDL (207.96) and CML (207.39) sit within about half a point of each other — the daily and monthly bias lines are effectively the same price. That's rare, and in my tracking, it produces a cleaner signal than either timeframe alone, because a breakthrough this level isn't just a daily event, it's a monthly one too.
Directly below that cluster is a second one: the weekly pivot (204.37) and daily S1 (204.92) sit within about half a point of each other, forming a shelf roughly three points under the pivot cluster. NVDA effectively has two lines stacked close together here, not one.
1._Structure: Above 208, the path of least resistance is up, daily — DR1 at 214.00 first, then weekly- WR1 at 217.59, which cluster within 3.5 points of each other and trade as one zone.
2._A dip between 208 and the 204–205 shelf isn't bearish yet — it's a hold-and-defend zone, buyable as long as the shelf holds on a closing basis.
**_The real invalidation is below 204, not below 208: that's where the daily and weekly floor break together.
Plain English: NVDA's daily and monthly levels are lined up on top of each other, which almost never happens — today's level and this month's level agree. As long as price holds above 208, dips are for buying, targeting 214 then 217.5. A close below 204 breaks the daily and weekly floor at the same time, and that's when the bullish case is off the table.
Nothing here is a black box. The levels are standard pivot math on the prior confirmed session, week, and month.
Not financial advice. Trade your own plan. TPG0: Extreme Mispricing or Deep Value Opportuinty?The Platform Group AG operates a software platform acquiring and scaling B2B and B2C e-commerce channels across Europe, targeting €1B in Gross Merchandise Value (GMV). While short-term debt noise and market capitulation have dragged the stock to historical lows around €0.74, smart money looks past fear to evaluate cash flow potential, underlying profitability, and aggressive corporate actions.
💼 Fundamentals
The Platform Group (TPG0) continues to demonstrate strong operational scaling despite market volatility:
Growth & Scale: The company is on track to hit €1.0B in GMV by 2026, backed by consistent M&A execution and software-driven operational synergies across over 20 platform verticals.
Profitability Disconnect: Unlike speculative growth plays, TPG0 generates solid operating profits. EPS stands at €2.04, placing the stock at a trailing P/E ratio under 0.4x—an extreme valuation anomaly driven by panic rather than business deterioration.
Proactive Debt Management: In response to market concerns regarding Nordic bond obligations, management initiated a €5M bond buyback program on July 2, 2026. This aggressive capital allocation directly proves balance sheet solvency and internal liquidity.
Upcoming Catalysts: The Q2/H1 2026 financial report scheduled for August 20, 2026, represents the primary fundamental catalyst expected to re-anchor market valuation to real operational earnings.
Risks: High market volatility, debt refinancing optics, and short-term algorithmic selling pressure. Communication delays regarding debt restructurings can prolong short-term sentiment drag.
📐 Technicals
Capitulation & Flushout Zone: On the daily chart, TPG0 has completed a major liquidity flushout into the €0.73 – €0.75 range. High volume nodes indicate massive turnover from panic sellers to institutional buyers accumulating at rock-bottom valuations.
Resistance & Gap Target: The immediate overhead resistance sits in the €1.09 – €1.15 confluence zone, which aligns with recent rebound highs and the 20-day EMA. A breakout above €1.15 clears the path to fill the price gap up to €1.50.
Long-Term Target: Consensus analyst price targets remain anchored far above current trading levels (historical consensus around €19.00). From an asymmetric risk/reward standpoint, any mean reversion toward a modest 3x–5x P/E multiple implies a long-term target of €6.00 – €10.00.
🎯 The Bottom Line
The market currently prices TPG0 under a worst-case distress scenario. However, active debt buybacks, high per-share earnings (€2.04 EPS), and solid revenue trajectory create a rare asymmetric risk/reward setup for patient value investors ahead of the August 20 earnings catalyst.  Long
Long
P911 | PORSCHE | Q3 2026 | Day ChartPorsche AG -
MARKET-BEATING SCORE -3/10
Dividend yield (indicated)
2.14%
----------------------------------
I posted a Ferrari chart last week. Then thought I could do a Porsche chart and since I'm doing a Porsche chart, I'll have to do a VWAGY chart since Volkswagen owns it and so many other automobile companies like Audi, Bugatti, Bently, Ducati, Lamborghini, Porsche, and some others.
----------------------------------
Multiple Time-Frame Analysis; Color Code | Strength favors the higher timeframe.
Yearly timeframe = black
Monthly timeframe = pink
weekly = grey
daily = red
4hr = orange
1hr = yellow
15min = blue
5min = green if they are shown. (Level visibility on intervals is set to timeframe the level was found on and below to keep chart view organized.)
** Candle Science explained **
A Range = two or more consecutive color candles.
There are two types of ranges - accumulation and distribution.
DISTRIBUTION RANGES DEFINED:
When price is above a distribution range, these candles/levels act as support.
(BS) BACKSIDE Candle - First distribution candle in a distribution range. Expectation = strong reaction to price. long wicks reaching to or away from level.
(FS) FrontSide Candle - Last distribution candle in a distribution range. Expectation = reversal, create a trend in the opposite direction. Distribution candles are used as support.
ACCUMULATION RANGES DEFINED: When price is below an accumulation range, these candles/levels act as resistance.
INVERSE BACKSIDE (Inv.BS) - First Accumulation candle in an accumulation range. Expectation. = strong reaction to price. long wicks reaching to or away from level.
INVERSE FRONTSIDE (Inv.FS) - Last accumulation candle in an accumulation range. Expectation = reversal, create a trend in the opposite direction. Accumulation candles are used as resistance.  Long
Long
Bayer improves its valuation following Roundup legal relief
Bayer (XETRA: BAYN) improves its valuation following Roundup legal relief
Ion Jauregui – Analyst at ActivTrades
Bayer shares posted a strong rally after the company announced the creation of Ruveon, a new entity that will consolidate its U.S. glyphosate business, which includes the Roundup brand. The move comes alongside a significant easing in the legal overhang after the U.S. Supreme Court declined to review a case related to the herbicide, a decision that strengthens the company’s legal position against the large number of pending lawsuits.
The development has been well received by the market, as it reduces part of the uncertainty that has weighed on Bayer’s valuation for years following the acquisition of Monsanto. The restructuring will allow the U.S. glyphosate business to be managed more independently, improving operational flexibility and leaving the door open to potential future corporate actions.
The improvement in the legal backdrop also triggered a positive reaction from analysts. Deutsche Bank upgraded Bayer from Hold to Buy and raised its price target to 60 euros, arguing that the market could begin to re-evaluate the upside potential of its pharmaceutical and agricultural businesses, rather than focusing on Roundup-related litigation.
From a technical perspective, the news acted as a clear bullish catalyst. The share price broke through key resistance levels in yesterday’s session on significantly higher volume, closing at a high of €53.92 per share. This reinforces the structure of higher highs and higher lows that has been in place since the beginning of the year, particularly since the strong upward impulse starting in early June.
As long as the price remains above the breakout zone, the bias remains positive, with the €60 level gaining relevance both from a technical standpoint and due to alignment with Deutsche Bank’s new valuation. The €58.74 and €62.30 zones represent notable resistance levels from 2023 and may act as reference points in a continuation scenario toward that area.
Currently, RSI stands in overbought territory at 82.89, while MACD shows a positive histogram with both the signal and MACD lines trending firmly upward, confirming strong bullish momentum. According to the ActivTrades Europe Market Pulse indicator, overall market risk has remained neutral in recent sessions, suggesting that the move is primarily driven by stock-specific factors.
Overall, the reduction in legal risk and the restructuring of the glyphosate business improve the perception of Bayer’s fundamentals and could help narrow the long-standing valuation discount driven by uncertainty.
*******************************************************************************************
The information provided does not constitute investment research. The material has not been prepared in accordance with the legal requirements designed to promote the independence of investment research and such should be considered a marketing communication.
All information has been prepared by ActivTrades ("AT"). The information does not contain a record of AT's prices, or an offer of or solicitation for a transaction in any financial instrument. No representation or warranty is given as to the accuracy or completeness of this information.
Any material provided does not have regard to the specific investment objective and financial situation of any person who may receive it. Past performance and forecasting are not a synonym of a reliable indicator of future performance. AT provides an execution-only service. Consequently, any person acting on the information provided does so at their own risk. Political risk is unpredictable. Central bank actions can vary. Platform tools do not guarantee success.
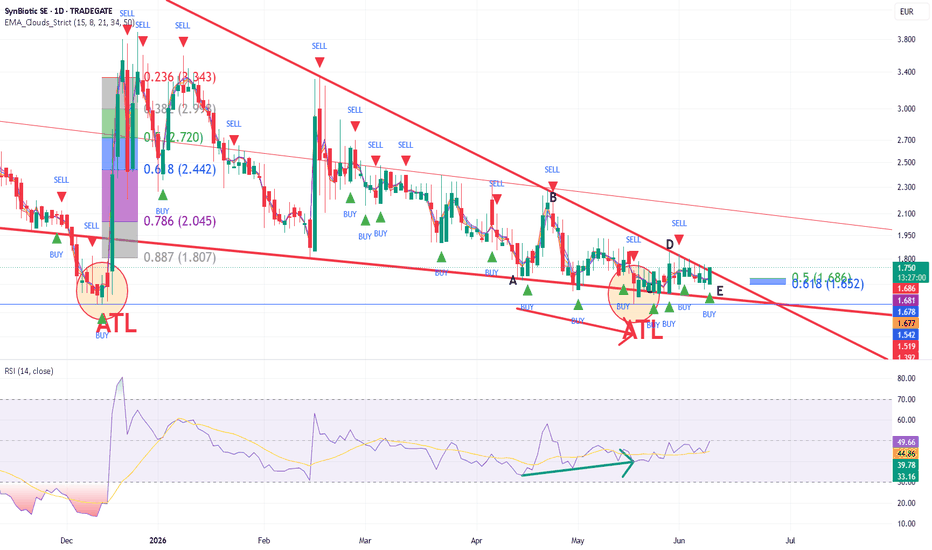
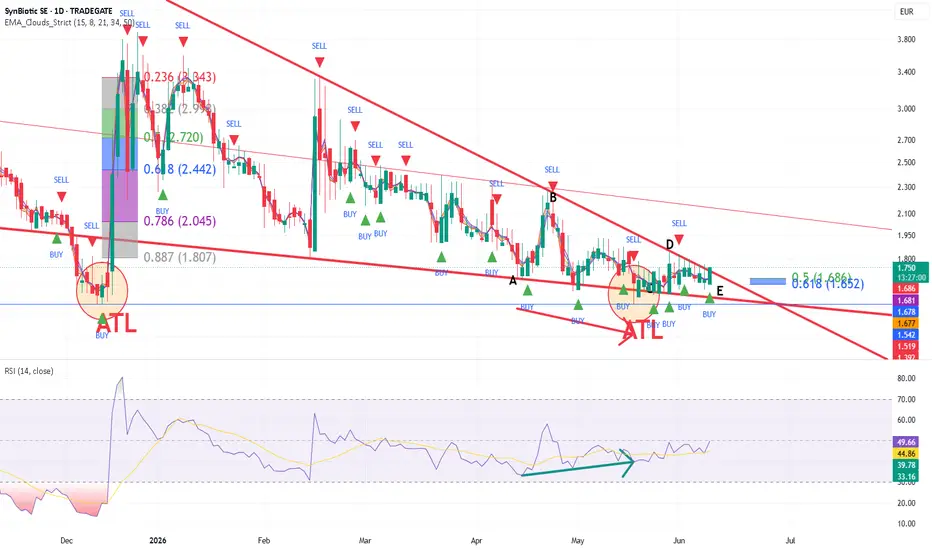
Triangle, triangle....Let's go again....and Fail again?
Stock is completing a triangle ABCDE Formation with Wave E bouncing at the 61,8 % Fibonacci lvl of Wave D.
Before that, the stock bounced of a second ATL, forming a bullish divergence on the RSI on it's way.
Now it is crucial to look for stock price reaction at the breakout.
Expect a breakout and retest at best.
Risk & Reward can be set very tight, since triangle is nearing its end formation
Fundamental:
Stock is about to release 2025 numbers. Considering the fact, that medical cannabis is somewhat legal to be obtained online, I expect a bump in growth for 2025.
Profitability should be reached in 2026 however according to the company, with 2025 just failing a net zero, after years of losses.
Legally:
Politically challenging times ahead, since online cannabis market, could be adressed by an ongoing reform.  Long
Long