Short
Short
 Long
Long
 Long
Long
 Long
Long
Long 
 Long
Long
 Short
Short
 Long
Long
 Long
Long
 Long
Long
 Long
Long
 Long
Long
AIRBUS READY FOR TAKEOFF - 65% PROFITAIRBUS (AIR) - 4hr/Frankfurt
Hello and welcome to this update,
this one is about Airbus, which looks GOOD in my opinion.
-All-time high was 140, which we dropped from, which is a 65% drop.
-RSI looking good, bullish divergence confirmed.
-Volume is solid- declining at the bottom (or temporary bottom) is a good sign and could mean, the selloff came to an end (for now).
-Reversal of 65% to 79€ (Resistance from 2nd January 2019) from 48€ is absolutely in range.
-Contesting all-time high in the future is possible as well since Airbus is next to Boeing the biggest aircraft and flight producer in the market.
-Longterm, this is a steal in my opinion.
Since we are in "reporting Season", end of April there will be the quarterly report of Airbus, which could stagnate, due to the corona crisis and the circumstances, which many companies suffer from. Aviation Business could be under pressure, though for the longterm, this will be fine in my opinion.
Have a nice day, thank you for tuning in, I appreciate it a lot!
Your german-quality-trader  Long
Long
Technical Analysis of Mercedes-Benz Group AG (MBG)### Technical Analysis of Mercedes-Benz Group AG (MBG)
#### Overview
The chart shows the daily price movement of Mercedes-Benz Group AG, indicating significant technical levels and trends. Key aspects include the Fibonacci retracement levels, support and resistance lines, and trend lines.
#### Fibonacci Retracement Levels
The Fibonacci retracement levels are drawn from the swing low around the end of 2020 to the swing high in early 2022. The key levels are:
- **0.236 (60.77 EUR)**
- **0.382 (63.95 EUR)**
- **0.5 (66.53 EUR)**
- **0.618 (69.11 EUR)**
- **0.786 (72.77 EUR)**
These levels often act as potential support and resistance zones.
#### Current Price Action
The current price is around **64.98 EUR**, slightly above the 0.382 Fibonacci retracement level (63.95 EUR), suggesting that this level may act as support. The recent price action shows a decline from the highs near the 0.786 level (72.77 EUR), testing lower support levels.
#### Trend Lines
The chart indicates a long-term ascending trend line starting from the lows of early 2020, intersecting with the 0.236 Fibonacci level around **60.77 EUR**. There is also a shorter-term ascending trend line from early 2023, providing additional support levels.
#### Resistance Levels
- **66.53 EUR (0.5 Fibonacci level)**
- **69.11 EUR (0.618 Fibonacci level)**
- **72.77 EUR (0.786 Fibonacci level)**
These levels are crucial to monitor as potential resistance if the price attempts to move higher.
#### Support Levels
- **63.95 EUR (0.382 Fibonacci level)**
- **60.77 EUR (0.236 Fibonacci level)**
The ascending trend line also provides dynamic support around these levels.
#### Projection
Given the current positioning, the price might continue to test the 0.382 Fibonacci level (63.95 EUR) for support. If this level holds, a potential rebound towards 66.53 EUR or higher might occur. Conversely, a break below 63.95 EUR could see the price testing the next support around 60.77 EUR, where the ascending trend line also provides a confluence of support.
### Conclusion
Mercedes-Benz Group AG (MBG) is currently in a consolidation phase, with key support at 63.95 EUR and resistance around 66.53 EUR. Traders should watch these levels for potential breakout or breakdown scenarios, keeping an eye on the broader market trends and any significant news that might impact the stock.
### Disclaimer
This analysis is just an opinion and should not be considered as financial advice. Trading stocks involves risk, and you should do your own research or consult a financial advisor before making any investment decisions. Any profit or loss is the responsibility of the audience, and I do not take any responsibility in this regard.  Long
Long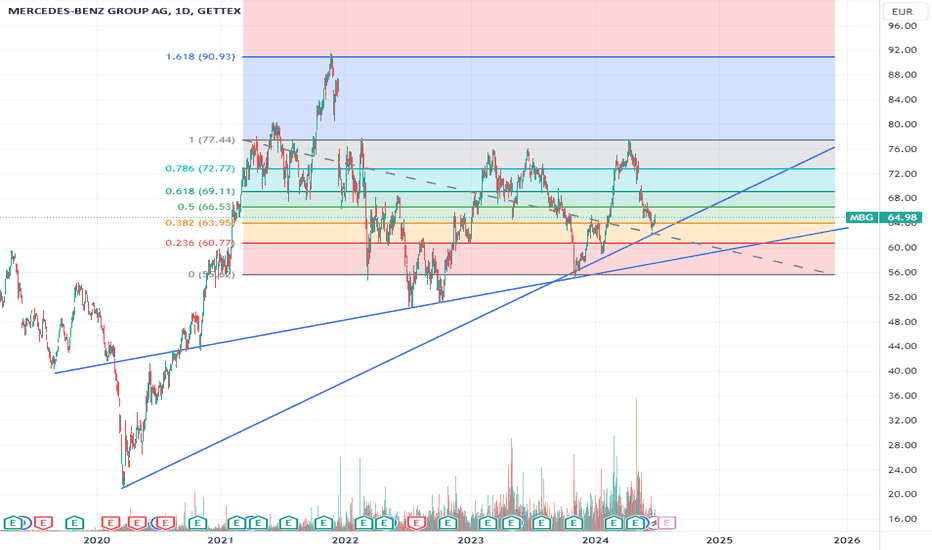
 Long
Long
Deutsche Bank AG (DB): Potential Sell-Off Ahead?Analyzing the Deutsche Bank AG on the German Stock Exchance XETR, we observe a repeating pattern involving two trend channels. In both instances, the trend channels were respected and behaved as expected.
In the first case, the price exited the trend channel and then retested it almost perfectly. In the second instance, the price overshot the trend channel briefly with a wick above but quickly retraced back below it. This overshoot indicates significant weakness, suggesting a potential stronger sell-off in the near future.
Zooming into the volume since 2020, we notice that the current range has seen low volume, indicating minimal buying interest at these levels. The buying interest appears to be much lower.
Zooming into the Deutsche Bank AG 12h chart, we see that the level of the larger Wave (1) at €14.64 is being respected and held for now. However, we anticipate a sell-off down to the range between €13.50 and €12.50. Falling below this range is not expected, but if it occurs, the next likely support would be between €10.50 and €9.30.
From an Elliott Wave perspective, it would be unfavorable if Wave 4 were to fall into the territory of Wave 1. While brief wicks below are acceptable, a prolonged stay in this range would not be ideal and is not our primary expectation. We also observe that the RSI is showing signs of being overbought.
There is a bearish divergence forming, with a lower high on the RSI and a higher high on the price chart. This divergence suggests that the recent price movements might lead to further declines.
In summary, while the €14.64 level is currently holding, we expect a potential sell-off to the €13.50 to €12.50 range. A further decline into the €10.50 to €9.30 range could occur but is less likely. The bearish RSI divergence supports this outlook, indicating potential downward pressure in the near term.  Long
Long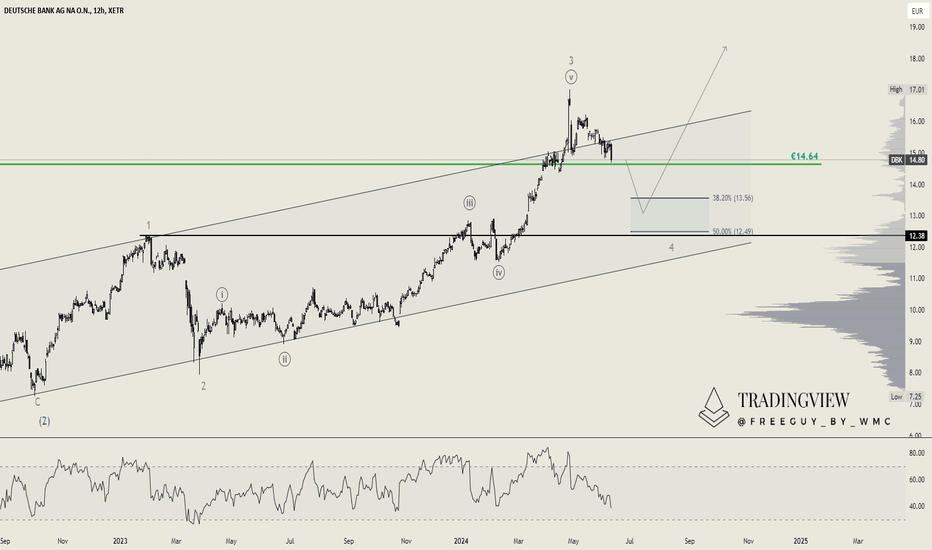
DWS GROUP (DWS): Upswing in Germany's Financial SectorDWS GROUP (DWS): XETR:DWS
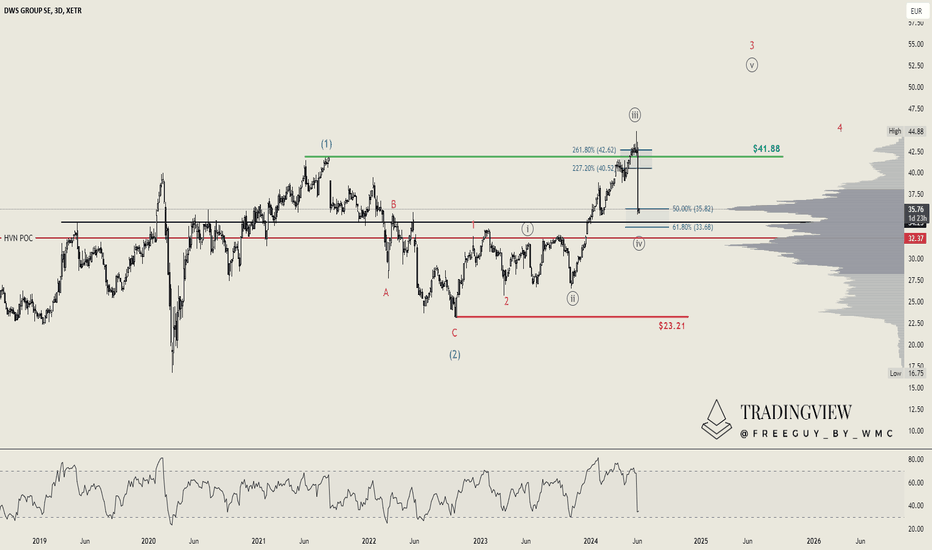
Analyzing the relatively young German stock, DWS Group, listed on the Xetra exchange in Germany, we find ourselves in an overarching Wave (3). We start this count at the Corona low of €16.75. Wave (2) concluded at €23.21, and our old high is at €41.88, which also represents the level of Wave (1). Naturally, for Wave (3), we aim to surpass this level. Subordinately, we are also in a Wave 3, and at an even lower level, again in a Wave ((iii)). We're looking to identify our entry point at the conclusion of Wave ((iv)). We anticipate some upside for the encapsulated Wave ((iii)), expecting the level between 227% and 261%, roughly at the all-time high, before we turn and complete our Wave ((iv)), and then fully develop the subordinate Wave 3.  Long
Long
DWS Group (DWS): Potential Trend Continuation from SupportAnalyzing the DWS Group chart on the German stock exchange XETR, our previous assumption was that the top would be found between €40.52 and €42.62. The actual top was at €44.88, which aligns well with our prediction. After this peak, the stock experienced a significant 16% sell-off over three days.
Currently, the stock is trading between the 50% and 61.8% Fibonacci retracement levels, which is a plausible and acceptable range for Wave ((iv)). Additionally, the High-Volume Node Point-of-Control from the entire chart since the IPO serves as a crucial support level. This level should act as the lowest point, as falling below it would enter the Wave ((i)) territory, which we aim to avoid. From an Elliott Wave perspective, we might see an upward trend for the DWS Group. Despite being a volatile stock that has mostly moved sideways since its IPO in 2018, it has been forming higher highs and higher lows since the post-COVID-19 low. This suggests a potential continuation of the trend, making it an interesting stock for potential entries.
Given the current situation, the stock appears to be in a sideways range rather than being overbought, providing potential entry opportunities up to the €32 level. This could be an attractive entry point for investors looking to capitalize on the continuation of the trend. Long