• Products
  • Community
  • Markets
  • Brokers
  • More
Get started
  • Markets
  • /Germany
  • /Stocks
  • /Ideas
Allianz: Strong Structural Tailwinds with a Disciplined TechnicaInsurance companies currently benefit from multiple structural tailwinds, positioning them favorably relative to banks and other financials. Rate cuts support equity valuations and enhance the appeal of dividend-paying stocks, allowing insurers such as Allianz to shine further in a yield-seeking environment. Unlike banks, insurers are not exposed to direct credit risk, making them more resilient during economic downturns, particularly amid growing concerns around loan quality and the so-called “cockroach theory” in banking, where the discovery of one bad loan raises fears of many more. Insurance companies also offer highly predictable shareholder returns, underpinned by stable premium income, disciplined underwriting, and long-duration liabilities. This predictability supports consistent dividends and share buybacks. A key additional tailwind is their large bond portfolios, which benefit from reinvestment at higher yields over time and contribute to steadily rising investment income. Allianz, in particular, stands out as one of the largest bondholders in Europe, giving it exceptional leverage to this structural dynamic. From a technical perspective, Allianz has been trading within a well-defined upward channel and has recently approached a confluence of resistance. Based on this structure, a pullback toward a confluence of support, projected around March, would be a technically constructive retest rather than a sign of weakness. Personally, assuming broader conditions remain stable, I intend to initiate a position on such a retracement, once technical confirmation aligns with the already compelling fundamental backdrop. Fundamentally, the stock appears strong; the strategy is therefore to combine fundamental conviction with disciplined technical execution.
XETR:ALVLong
by Vasileios_Kairaktidis
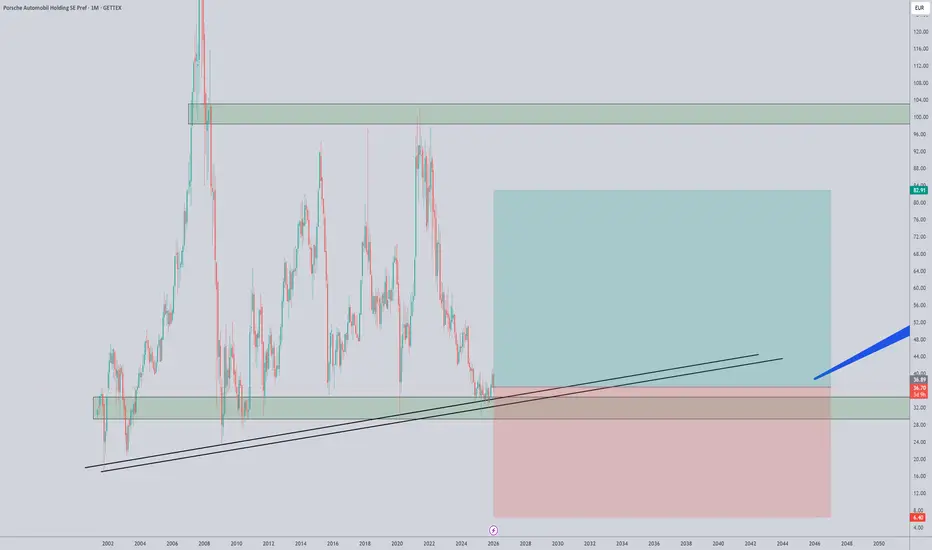
Porsche AG: ripe for recovery?This stock has been hammered since its 120EUR top in 2023. After months of consolidation around current levels it looks like the stock price is ripe for a bullish 2026. Technical set-up - weekly RSI bullish divergence - currently under the 52-week moving average, a clean break and hold above it would open the door for a larger mean‑reversion leg.​ - Seasonality kicking: strong historical stock performance in Q1 Fundamental - Levered play on lower or stabilising tariffs, plus Germany’s ongoing fiscal stimulus and recovery in Euro‑area demand.​ - Upside from a rising share of electrified and hybrid Porsche deliveries - Beneficiary of spillover from higher German public spending and political support for domestic OEMs - Remains the biggest ambassador of the “Made in Germany” brand globally
XETR:P911Long
by diligent_leopard
Updated
11
Downtrent reversal XETR:RHM is suffering from fear and doubt due to the recent news on the war in Ukraine. If this news blows over, the current price is a good opportunity to step in at a low level. Watch for the following on this chart. The price is in the red on the Supertrend. The Volume is higher than the blue line, and it is a dark green bar. The LaRSI crosses the bottom line up. We are also reaching oversold territory on the RSI (Current: just above 30)
XETR:RHMLong
by TLN_
Updated
77
Ascending Triangle DOUChart pattern: Ascending triangle AGE: 266D Occurance: Bullish reversal, after downward trend Below 52 week MA
XETR:DOULong
by KarimSubhieh
WCH - Symmetrical triangleChart pattern: Symmetrical triangle Age: 252 days Occurance: Appearing as a potential bullish reversal after downtrend Below 52Week MA
XETR:WCHLong
by KarimSubhieh
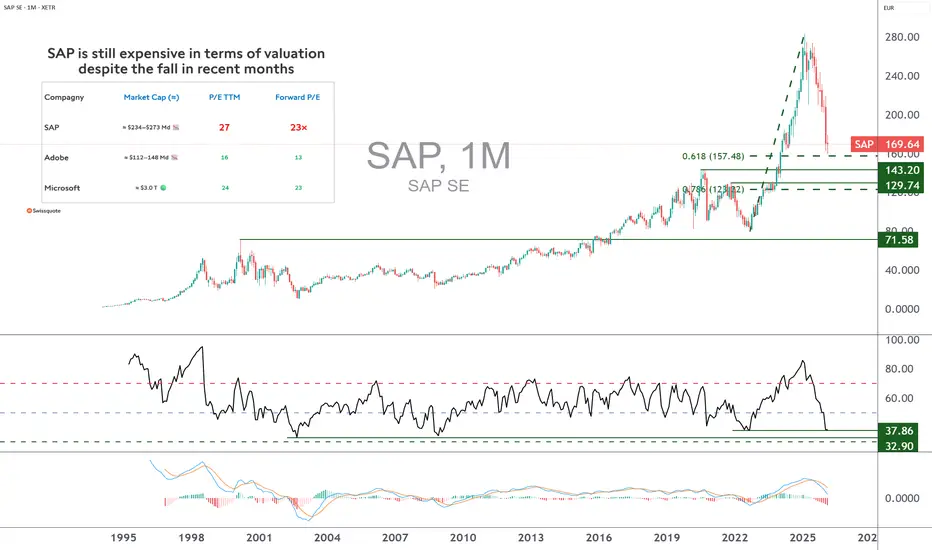
SAPInteresting chart. We should we ait for incoming days 🧐
XETR:SAP
by SchaltPro
BMW - Cup And handlePattern: Cup and Handle Occuracne: Bullish reversal Age: 539 days Pricetarget: 120,60
XETR:BMWLong
by KarimSubhieh
ALV - RectangleCompany name : Allianz SE Pattern: Rectangle Age: 7 months or 217 days Occurance: Bullish continuation Price target: 423 or 12%
XETR:ALVLong
by KarimSubhieh
ADB reaching its bottom?Hi, Just a note for myself. Clear bottom structure, long term disembarking. Profitable company, industry leader. Estimated revenue and profits -> growing. EPS growing. Additionally have clear buy signals and falling triangle breakout. My expectation is to see 450 in 2026. BUY! AG
XETR:ADBLong
by ag12977
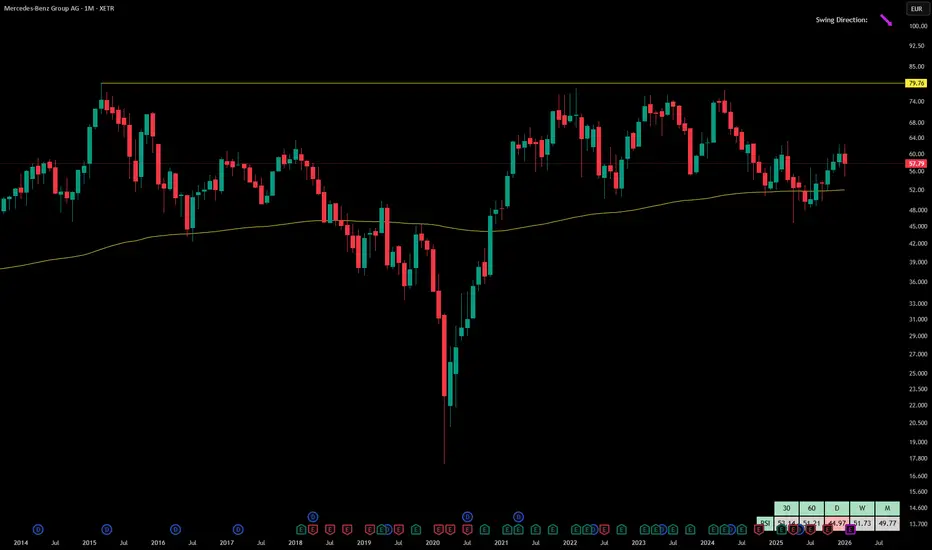
Mercedes‑Benz Group AG📄 Key Fundamentals for Mercedes‑Benz Group AG Here are some of the most relevant recent valuation and financial metrics for Mercedes‑Benz. Metric / Indicator Latest / Reported Value* EPS (TTM) € 6.48 per share justETF +2 GuruFocus +2 P/E (Trailing 12 mo) ~ 9–9.5× (various sources: 8.9×, 9.3×, 9.5×) Wisesheets +3 Yahoo Finance +3 GuruFocus +3 Forward P/E ≈ 9.1× (2025/2026 estimates) GuruFocus +1 PEG ratio (based on 5‑yr EBITDA growth) ~ 0.63–0.66 GuruFocus +1 Dividend yield (TTM / recent) Estimates around ~ 7% for 2025 Wisesheets +1 2024 Net Income (full year) ~ € 10,207 million (Net Income) & EPS 6.48 € justETF +1 2024 Revenue ~ € 145,594 million (≈ €145.6 bn) justETF +1 * “TTM” = trailing twelve months. Figures come from a mix of recent financial‑data sources for 2024–2025. What these numbers suggest: A P/E around 9–9.5x is relatively low, especially compared to many global automakers or growth companies — this could imply the stock is modestly valued or undervalued (assuming stable earnings). PEG < 1 (around 0.63–0.66) suggests that, relative to its growth potential (5‑year EBITDA growth), the valuation might be attractive. A dividend yield near ~7% (depending on payout policy and share price) is relatively generous, making the stock potentially interesting for income‑oriented investors. Caveats / Risks: The forward P/E suggests modest expected earnings growth (or at least modest investor optimism relative to current price). The auto industry is cyclical and subject to macroeconomic pressures: demand, raw‑material costs, competition, regulatory shifts (especially around EVs), etc. Past performance (2024 earnings, 2025 interim results) may not guarantee similar performance ahead, especially in a rapidly evolving auto market. 📈 Technical Analysis (Based on Your Chart + General Context) From the chart and common technical indicators (trend lines, Fibonacci zones, support/resistance, oscillators, etc.): The price appears to have undergone a significant uptrend (from lows ~ €20s/€30s up to high near ~€90 in earlier years), followed by a prolonged retracement / consolidation phase. Currently, the stock seems to be trading around €60–62, which may correspond to a mid‑range level (not near the highs, but above recent lows) — potentially forming a base or accumulation zone. The presence of a Fibonacci retracement overlay suggests investors are watching certain retracement levels (e.g., 38.2%, 50%, 61.8%) as potential support/resistance zones. Momentum indicators — from what can be seen — may show some recovery, but given the long-term volatility, it’s hard to assert a strong bullish reversal without confirmation (breakout, volume increase, improved fundamentals, etc.). The recent bounce from lower levels may reflect recovery optimism (e.g., better earnings outlook, stabilization of macro conditions, or company-specific developments). Possible near‑term technical scenarios: If price holds above current support (~ €55–60) and breaks above recent resistance (~ €62–65), we might see a rally toward higher resistance zones (possibly retesting higher Fibonacci retracement levels). If price fails to sustain support, there could be a re‑test of lower levels, potentially toward prior consolidation lows (depending on broader market conditions). 🧮 Combined Fundamental + Technical View (Neutral‑to‑Moderately Positive) Considering the modest P/E, low PEG, and attractive dividend yield, the fundamental valuation of Mercedes‑Benz appears reasonably attractive, especially if the company can maintain earnings and manage industry headwinds well. On the technical side, the stock seems to be in a consolidation or base‑building phase, which — if combined with favorable fundamental developments — could set the stage for a more sustained uptrend or value recovery. Given the cyclical nature of auto demand and external risks (global economy, competition, EV transition, regulation), the path may be choppy — but Mercedes‑Benz seems reasonably positioned compared to many peers. ✅ What to Watch / Key Catalysts Earnings announcements & guidance, especially as global auto markets face challenges (macroeconomics, interest rates, consumer demand). Automotive industry trends: demand for electric vehicles (EVs), regulation (EU emissions, tariffs), supply‑chain costs, raw materials. Company’s operational execution: cost management, efficiency, new model launches, EV strategy, global sales exposure (e.g., China, U.S., Europe). Macro environment: economic growth in key markets, currency fluctuations, inflation/interest‑rate environment, global trade conditions. Technical confirmation: breakout from consolidation, volume trends, support/resistance tests. This is not financial advice — only data analysis. Please consult a qualified financial professional for personalized guidance.
GETTEX:MBGLong
by SchaltPro
11
E.ON SE — Technical + Fundamental AnalysisFundamental Overview & Recent Performance E.ON is a major European energy company: it focuses on energy distribution networks, infrastructure (grids), energy sales, and increasingly on sustainable energy solutions. GlobalData +2 eon.com +2 As of 2025, the company’s market capitalization is roughly €40–48 billion (depending on exchange rate/report) which places it among the larger utilities in Europe. Companies Market Cap +2 eon.com +2 For 2025 the company reaffirmed its guidance: the adjusted EBITDA target is €9.6–9.8 billion, and adjusted net income target is €2.85–3.05 billion. Investing.com +2 Quartr +2 In the first 9 months of 2025, adjusted EBITDA was €7.4 billion (up ~10% YoY) and adjusted net income rose by ~4% to €2.3 billion. SolarQuarter +2 Ad Hoc News +2 Investment plans remain strong. From 2024–2028, E.ON expects to invest around €43 billion, with a large portion (€35 bn) going into its Energy Networks business. eon.com +2 eon.com +2 The company’s dividend history shows a steady increase in annual dividend: for 2025 the dividend is €0.55 per share — last years were €0.53 (2024), €0.51 (2023), etc. Dividend yield is around 3.5%–4%, depending on price. StockAnalysis +1 ➡️ Interpretation (Fundamental Strengths): E.ON appears financially healthy: increasing EBITDA and net income, stable dividend policy, and large ongoing investments — especially in grid infrastructure and energy transition. Its focus on networks/infrastructure (rather than riskier commodity‑based energy retail) provides more stable cash-flows. GlobalData +2 Quartr +2 Given Europe’s push for energy transition, upgrades to power grids, decarbonization, and electrification, E.ON’s investment‑heavy strategy might position it well for long‑term structural demand in energy infrastructure. ⚠️ Risks / Considerations: The valuation and net debt evolution remain a key watch: increasing investments and debt must be managed carefully. Seeking Alpha +1 Regulatory risk — as a grid operator, returns often depend on regulation of tariffs, allowed returns, and energy policies in Germany and Europe. Changes in regulation could impact profitability. 📊 Technical Picture (Based on Your Chart + Indicators) From your chart (daily timeframe): The stock had a strong upward trend from mid-2022 to early‑2025, and more recently it seems to be in consolidation / range-bound around €10–11 (though your chart shows 10.76 — possibly older or another listing). Momentum indicators: RSI (14) is ~63–64 → not yet overbought but approaching higher zone. Stochastic RSI is in overbought zone (K ~82, D ~86) → possible short-term overbought conditions, risk of a pullback or consolidation soon. MACD shows a recent crossover — histogram slightly positive — but the move seems weak / indecisive. From chart annotations you have “RsiLE” and “RsiSE” signals (buy/long entries vs exit/short entries) — recent signals seem to lean toward “long entry” (RsiLE), which suggests some bullish bias in the short/medium term. ➡️ Technical outlook: The setup suggests that the stock may be forming a base or consolidation. If it breaks out above resistance (depending on your defined resistance, perhaps near prior swing highs), there may be room for a move higher. But with oscillators somewhat stretched, a short‑term pullback or sideways action is also quite possible before a decisive breakout. Possible scenarios: Bullish breakout: Price breaks out of consolidation, riding on positive fundamentals + market sentiment → potential move to prior resistance zones (depending on timeframe, could be higher). Sideways / consolidation: Price remains in range until clearer catalyst (earnings, regulatory news, broader energy/commodity sentiment) emerges. Short-term correction: Given overbought Stochastic‑RSI, a minor pullback (or test of support) could occur before resuming upward move. 🧮 Combined View & What to Watch Strengths (Fundamental) Technical Signals / Cautions Strong 2025 earnings growth (EBITDA & Net Income increasing) SolarQuarter +1 Overbought in Stochastic‑RSI — risk of short-term pullback Substantial capex and investment plans for energy networks & infrastructure (long-term structural play) eon.com +2 eon.com +2 Recent chart shows consolidation — trend not clearly upward yet Stable dividend history, decent yield ~3–4% StockAnalysis +1 Momentum (MACD) is weak — needs stronger confirmation for upmove Operating in essential utility/energy infrastructure business — somewhat defensive Regulatory/policy risk: energy‑market & grid regulation in Europe must be watched Key catalysts to watch for future direction: Execution of E.ON’s investment program (especially grid upgrades, energy networks) and how that impacts future EBITDA and cash flows. Regulatory developments regarding energy tariffs, grid rates, returns on infrastructure investment in Germany/Europe. Macro developments: energy demand, European energy transition policies, inflation/interest‑rate environment (affecting CAPEX costs & financing). Technical breakout or failure: if price breaks convincingly above consolidation range, or falls below key supports. 🧠 My View (Neutral-to-Cautiously Optimistic — Not a Recommendation) Given the combination of solid fundamentals (earnings growth, capex/investment strategy, dividend) + reasonable technical setup (though with some overbought signals), E.ON SE appears as a company with long-term structural potential, particularly as Europe transitions toward greener, more robust energy infrastructure. In the short-to-medium term, price action may be choppy: likely consolidation or mild pullbacks before a clearer breakout. But over a multi‑year horizon, the strong investment and essential‑services nature of the business provide a supportive backdrop. This is not financial advice — only data analysis. Please consult a qualified financial professional for personalized guidance.
TRADEGATE:EOAN
by SchaltPro
Fluor Corporation (FLR) – Full Technical & Fundamental AnalysisI. Technical Analysis The chart shows a combination of Fibonacci retracements, an ascending support trendline, a descending resistance trendline, MACD+RSI, and Stochastic RSI. Here is the complete breakdown: 🔍 1. Price Structure & Trend ✔️ Ascending Triangle / Rising Support FLR has created a series of higher lows since the $26.70 bottom, forming a strong rising trendline. Simultaneously, multiple lower highs form a descending resistance, creating a wedge-like consolidation. ➡️ This signals price compression — a breakout is coming. 🔍 2. Fibonacci Key Levels Using the swing low $26.70 and swing high $49.64, important levels include: 0.382 → $40.87 (major resistance) 0.50 → $38.17 (current barrier zone) 0.618 → $35.21 (major support) 0.786 → $32.01 (deep support) ✔️ Current price is near $37.23 Price sits between 0.50 and 0.618, a typical reversal zone in strong trends. 🔍 3. Support & Resistance Support Levels $35.00–$35.20 (0.618 Fibonacci) Ascending trendline Below $35, next support is $32. Resistance Levels $38.17 – $40.87 Descending trendline Above $44, final resistance is $49.64 (previous high) 📈 4. MACD+RSI Indicator MACD is turning bullish, with the MACD line curving upward. Histogram turning green. Momentum begins shifting toward buyers. This supports the possibility of a medium-term upward swing. 📉 5. Stochastic RSI Currently rising toward the upper region (60–70). Shows short-term bullish momentum. Once above 90, a short-term pullback becomes possible. ⭐ 6. Technical Summary Bullish Scenario If FLR breaks above $38.17, targets are: $40.87 $44.22 $49.64 Bearish Scenario If FLR loses $35, price may fall to: $32.01 A break below $32 invalidates the bullish structure. Overall Technical Bias: ➡️ Neutral to Bullish, with confirmation needed above $38.17. II. Fundamental Analysis Here are the most recent reliable fundamental metrics available, including EPS and P/E as requested. 🧩 1. EPS & P/E (Latest Available) Metric Value Interpretation EPS (TTM) ≈ $18–$20 per share Extremely high relative to price, partly due to non-recurring gains P/E Ratio (TTM) ≈ 2.3× Very low; signals undervaluation or temporarily inflated earnings Forward P/E ≈ 19–20× Indicates expected normalization of earnings in coming quarters 👉 What this means A very low P/E usually attracts value investors, BUT the large gap between P/E (2.3×) and forward P/E (~20×) indicates that recent EPS includes one-time gains or unusually strong project profits. Analysts expect more normal (lower) earnings going forward, which is why forward valuation is much higher. 📈 2. Revenue & Earnings Momentum Fluor has reported: Strong year-over-year revenue growth Improving profitability after years of restructuring Solid performance in infrastructure, LNG, chemicals, and government contracts Backlog has been growing, indicating stable revenue visibility. 💰 3. Cash Flow & Balance Sheet Operating cash flow has strengthened significantly. Long-term debt levels have declined, improving leverage and financial stability. Liquidity remains solid, supporting ongoing project execution. ⚙️ 4. Growth Catalysts LNG megaprojects in the U.S. and Middle East Government and defense contracts CHIPS Act & clean energy construction Mining & industrial expansion projects Nuclear and carbon reduction infrastructure These trends support strong multi-year demand for EPC services. ⚠️ 5. Key Risks Project execution risk (cost overruns can impact earnings) Highly cyclical industry Backlog dependency on large, long-term contracts Global economic slowdown could reduce project awards ⭐ III. Combined Technical + Fundamental Outlook ✔️ Technical signals trending bullish (MACD recovery, strong support at $35, bullish reversal zone). ✔️ Fundamentals improving, but EPS is inflated and future P/E is much higher. 🎯 Overall Outlook: Bullish potential, but confirmation is needed above $38.17 for continuation toward $41 → $44 → $49. Long-term investors should consider: Strong fundamentals Attractive low current P/E But also forward valuation risk Short-term traders should watch: Trendline support MACD confirmation Stochastic RSI reaching overbought ⚠️ Disclaimer (as you requested): This analysis reflects my personal view only. I take no responsibility for your buy or sell decisions.
GETTEX:FLULong
by SchaltPro
Siemens AG (1D) – Full Technical Analysis + Fundamental Analysis🔍 1. Price Action & Trend Structure ✔️ Strong long-term uptrend inside a rising channel Siemens has been moving within a well-defined ascending channel for several years. The price consistently respects both the upper resistance line and the lower support line of this channel. Every pullback to the bottom of the channel has historically led to a new bullish wave. ✔️ Price currently near the upper-mid region of the channel This suggests: The trend is still healthy and bullish But the stock is not at an ideal low-risk buy zone Strongest buy opportunities typically occur near the channel’s lower boundary ✔️ Key support zone: ~138 € This level, marked on the chart, acted as: Major support during corrections A psychological price floor If the stock ever returns to this zone, it would be considered a high-value demand area. 🔍 2. MACD + RSI Combined Indicator ✔️ MACD is recovering from a recent bearish phase The histogram is transitioning from negative toward zero → decreasing selling pressure MACD and Signal lines are preparing for a possible bullish crossover This usually indicates early momentum shift toward buyers ⚠️ However: The momentum is not strongly bullish yet. The MACD must cross above the Signal line with histogram turning positive for a confirmed buy signal. ➡️ We are currently in a transition phase, not a confirmed uptrend continuation. 🔍 3. Stochastic RSI (Stoch RSI) ✔️ Stoch RSI is near overbought levels (above 90) This indicates: A strong recent upward bounce Potential for short-term pullback or consolidation However, in strong long-term trends (like Siemens), Stoch RSI can stay overbought for extended periods without triggering a reversal. ✔️ Overall message from Stoch RSI: Momentum is strong short term, but buying at this level carries increased risk of near-term correction. 🔍 4. Key Observations from RSI Strategy Buy/Sell Signals The chart shows multiple automated RSI-based Buy (LE) and Sell (SE) signals. Pattern: Buy signals occur near channel support → extremely profitable historically Sell signals occur near channel resistance → reliable for trimming or exiting Right now: Price is closer to the upper-middle zone, not near support Therefore, no strong Buy signal is present 🔥 5. Bullish & Bearish Scenarios Bullish Scenario (Primary Trend) If price continues respecting the channel: Next target: 240–250 € range Break above 250 € → continuation toward 270–280 €, the projected top of the channel This aligns with the stock’s strong long-term bullish structure. Bearish Scenario (Less likely but important) If momentum weakens and price breaks below the mid-channel line: First support: 210 € Major support: 138 € zone (historically very strong) A break below 138 € would invalidate the rising channel, but this has a low probability given historical behavior. ⭐ Final Summary Siemens remains in a strong multi-year uptrend inside a clean ascending channel. MACD shows early signs of bullish momentum returning, but not confirmed yet. Stoch RSI is overbought, signaling the possibility of a short-term pullback. Price is not at the channel bottom, meaning risk is higher for new entries at current levels. 📌 Best buying opportunities historically occur at the channel’s lower boundary. We are currently in the mid-to-upper area, which is not optimal for low-risk entry. If you want, I can also provide: ✔ Entry/exit points ✔ Risk management plan ✔ Weekly & monthly timeframe confirmation ---------------------------------------------------------- Fundamental Analysis 🧾 1. Business & Structural Drivers Siemens AG is a diversified industrial and technology group, with core businesses in: Digital Industries (automation, industrial software) Smart Infrastructure (building technologies, power distribution) Mobility (rail and transportation solutions) Management highlights electrification, transportation and industrial software as the main long-term growth drivers, with continued strong demand in these areas even while the automation environment has been more challenging. Siemens The company is also pushing its “ONE Tech Company” strategy – integrating hardware, software and services to lock in customers and grow recurring revenues. Siemens +1 📈 2. Recent Financial Performance FY 2024 (year ended 30 Sept 2024) Revenue: €75.9 billion, +3% year-on-year. Net income: €9.0 billion – a record high at that time. Free cash flow: €9.5 billion, described by management as “excellent”. Siemens +2 Siemens Press +2 Demand remained strong in electrification, transport and industrial software, helping offset a tougher cycle in automation. Siemens FY 2025 (latest full year) For fiscal 2025 (ended Sept 2025), Siemens extended this growth trend: Q1 2025: revenue €18.4 bn (+3%); book-to-bill 1.09. Siemens Press Q2 2025: revenue €19.8 bn (+7%); orders up 10% to €21.6 bn; book-to-bill 1.10. Siemens Press Q4 2025: revenue €21.4 bn (+6% comparable); book-to-bill 1.02. Siemens Press +1 For the full fiscal 2025 year: Net income: ~€10.4 billion, another all-time high (third year in a row). EPS pre PPA: €12.95; excluding one-off gains, EPS pre PPA was ~€10.71 – in line with guidance (€10.40–11.00). Siemens Press +1 There was an earnings miss versus analyst expectations in Q4 2025 (EPS and revenue came in slightly below forecasts, which caused a short-term share price drop), but underlying growth remained solid. Investing.com Outlook For fiscal 2026, Siemens guides for: Comparable revenue growth: 6–8% Book-to-bill: >1 EPS pre PPA: €10.40–11.00 (excluding special items). Siemens This shows management still expects profitable growth despite macro uncertainty and FX headwinds. 💰 3. Balance Sheet, Cash & Dividend Free cash flow: around €9.5 bn in FY 2024 (and similarly strong in 2025), giving the company a lot of flexibility for dividends, buybacks and investment. Siemens Press +1 Net debt: Total net debt around €34.8 bn, but industrial net debt only about €7.9 bn, down ~27% vs 2022, with a solid liquidity position. Creditreform Rating Dividend: Proposed/paid dividend of €5.20 per share, with a yield roughly in the 2–3% range and a payout ratio around 40–45%. Siemens Press +2 Siemens +2 Rating agencies and independent analysts generally view Siemens’ balance sheet as strong and conservative, which supports continued investment and shareholder returns. Siemens +1 📊 4. Valuation Recent data show: Trailing P/E: around 23–24x earnings. Wisesheets Forward estimates (2026–2027) imply a P/E in the low-20s and a dividend yield around 2.4–2.6%. MarketScreener Profit margin around 12% and decent returns on equity and invested capital compared with peers. Yahoo Finance +1 So the stock is not cheap, but for a high-quality, diversified industrial with strong cash generation and structural growth themes, the valuation is in a reasonable premium range rather than “bubble” territory. ⚙️ 5. Key Fundamental Positives Structural tailwinds in electrification, grid upgrades, automation, digitalization and rail transport. Siemens +1 Consistent revenue and order growth with book-to-bill >1, showing a healthy pipeline. Siemens Press +2 Siemens Press +2 Excellent free cash flow and disciplined capital allocation (dividends, buybacks, targeted acquisitions). Siemens Press +1 Strong balance sheet with manageable industrial net debt and solid credit ratings. Creditreform Rating +1 ⚠️ 6. Main Risks & Caveats Cyclical exposure: Parts of the business (especially automation) are sensitive to global industrial cycles and capex spending. Siemens Execution & portfolio risk: Strategy depends on integrating software, services and hardware; missteps in large projects (Mobility, infrastructure) or M&A could pressure margins. FX and macro headwinds: Management already cites currency effects as a drag on EPS for 2026. Siemens Valuation risk: With a P/E in the 20s, any disappointment (like the recent Q4 2025 earnings miss) can trigger sharp short-term drawdowns. Investing.com +1 🧩 7. How This Fits Your Technical View Technical picture: clear long-term uptrend in a rising channel, but currently not at the lower boundary (not a “deep value” technical entry). Fundamentals: confirm Siemens as a high-quality, cash-generative company with solid growth guidance and a shareholder-friendly capital allocation policy. So from a combined technical + fundamental perspective: Long-term investors might see Siemens as a strong compounder but may prefer to buy on pullbacks toward the lower part of the channel to improve risk/reward. Short- to medium-term traders should still respect the overbought readings and channel resistance, even though the underlying business is fundamentally strong. ⚠️ Disclaimer (as you requested) This fundamental and technical analysis reflects only my personal view based on publicly available information. I take no responsibility for any of your buy or sell decisions.
TRADEGATE:SIE
by SchaltPro
Commerzbank (CBK.DE) – Short Fundamental SummaryCommerzbank (CBK.DE) – Short Fundamental Summary EPS (TTM): ~€2.07 P/E (TTM): ~16.5× Forward P/E: ~12–13× Dividend Yield: ~2% ROE: ~7.8% Summary: Commerzbank shows stable profitability with a solid EPS and a moderate P/E ratio. Forward valuation suggests the market expects steady or slightly improving earnings. Dividend yield is modest but consistent. Overall, the stock appears reasonably valued with potential upside if economic conditions stay stable. ⚠️ Disclaimer: I am not responsible for any of your buy or sell decisions, and this report reflects only my personal view.
XETR:CBKLong
by SchaltPro
Is Europe's Industrial Crown Jewel Being Quietly Dismantled?Volkswagen Group, once the symbol of German engineering dominance and post-war European recovery, is experiencing what can only be described as a structural dismantling rather than a cyclical downturn. The company faces a perfect storm of challenges: geopolitical vulnerability exposed by the Nexperia semiconductor crisis, where China demonstrated escalation of dominance over critical supply chains, catastrophic labor cost disadvantages ($3,307 per vehicle in Germany versus $597 in China), and a complete failure of its CARIAD software division that consumed €12 billion with little to show for it. The result is unprecedented: 35,000 German job cuts by 2030, the first factory closures in 87 years, and Golf production moving to Mexico. The technological surrender is perhaps most revealing. VW is investing $5.8 billion in American startup Rivian and $700 million in Chinese EV maker XPeng—not as strategic partnerships, but as desperate attempts to acquire the software and platform capabilities it failed to develop internally. The company that once provided technology to Chinese joint ventures now buys entire vehicle platforms from a Chinese startup founded in 2014. Meanwhile, its profit engine has collapsed: Porsche's operating profit plummeted 99% to just €40 million in Q3 2024, while VW's China market share eroded from 17% to under 13%, with only 4% share in the critical EV segment. This isn't just corporate restructuring—it's a fundamental transfer of power. VW's "In China, For China" strategy, which moves 3,000 engineers to Hefei and creates a separate technological ecosystem under Chinese jurisdiction, effectively places the company's intellectual property and future development under the control of a systemic rival. The patent analysis confirms the shift: while BYD has built a moat of 51,000 patents focused on battery and EV technology, much of VW's portfolio protects legacy internal combustion engines—stranded assets in an electric future. What we're witnessing is not Germany adapting to competition, but Europe losing control of its most important manufacturing sector, with the engineering and innovation increasingly done by Chinese hands, on Chinese soil, under Chinese rules.
XETR:VOWShort
by UDIS_View
22
RHM do or die RHM is currently at a support level. If 1400 holds, it could go up to 2300-2400. Otherwise, back at the base of the rally around 240.
XETR:RHM
by shiftpark
11
$RHM now beneath 1500 E and the Weekly 50 MA - Can it bounce?XETR:RHM has had a fabulous run since the start of the Ukraine War. It has contributed to the DAX making new highs up until the summer of 25. However as mentioned elsewhere the possibility of a Ukraine Peace Plan has taken the lustre of European aerospace and defence stock, and RHM has been hit hard. From tickling the soft underbelly of 2000 Euros were no beneath 1500 Euros and also beneath the weekly 50 Moving Average. Is this where it bounces, or do we see more moves lower? Personally, I think any kind of peace agreement means we move lower, and i wonder if we head back to the 1000 Euro area. However if the peace plan is scuppered then we're likely to reclaim the 50MA and the 1500 Euro level...though it may not return to the highs of 2000 Euro. This will be a case of watching the news, and taking the lead from the negotiations. I wish for a just peace...but i winder if there's too many people making too much money out of the Ukraine War to allow it to end any time soon. Or is that just me being a cynical old b*stard?
XETR:RHMShort
by FXTraderPaul
Sub Wave 3 of Wave 3 imminent?Since end of November we just completed an inverse SKS formation on the daily charts, which is a bullish pattern. Also noticeable is a much higher trade volume since late last summer. Time to look into possible target zones: Sub (3) should go up to the 1,618 fib at least, maybe after a quick retest of the resistances marked in red Since the (3) and 3 waves share almost the same target i expect the Wave 3 to reach a higher fib lvl. In the past the 3,618 oder even 4,618 fib lvls were possible.
TRADEGATE:11LLong
by robschulz
Siemens Energy in den letzten Zügen Bei noch maligen Bruch der Trendlinie steht der Weg nach unten offen.
XETR:ENR
by fluffo
Micron (MU) is booming in the AI era! 💥 🚀🔥#Micron (#MU) is booming in the AI era! With record demand for memory and storage, constant innovation, and strong results, MU is redefining the digital future. Savvy investors see huge opportunities in a global leader ready to transform technology and portfolios. 🚀 #Micron #MU #AI #TechStocks #Investing #Innovation #DigitalFuture #StockMarket #GrowthStocks #Finance NASDAQ:MU
GETTEX:MTELong
by SomeOne-LikeYou
Novo Nordisk: The European Giant Challenging Alphabet Novo Nordisk: The European Giant Challenging Alphabet in the Debt Market By Ion Jauregui – Analyst at ActivTrades The European corporate debt market closes 2025 with a surprise: Alphabet becomes the largest issuer of euro-denominated bonds of the year, with €13.25 billion placed and 3.1% of the total issued volume. However, the Danish company Novo Nordisk, Europe’s capitalization leader, positions itself as its main competitor, with €12.7 billion in issuances. Interest in both companies reflects the search for defensive and growth assets, but in the case of Novo Nordisk, the fundamentals provide unmatched strength. Fundamentals: Solid Growth and Structural Demand Novo Nordisk continues to expand, driven by its flagship drugs for diabetes and obesity (Ozempic and Wegovy), consolidating a business model with exceptional margins. • Annual growth: over 20% • Operating margin: above 44% • Solid cash position: even after investments in production capacity • Future market: obesity could exceed 1 billion global patients by 2030 The biopharmaceutical company does not issue debt out of necessity, but to finance industrial expansions and capture a rapidly growing healthcare market. The Debate: Bubble in the Debt Market? The rise in European issuances, especially from technology and pharmaceutical companies, has led some fund managers to warn of a possible bubble due to concentration rather than valuation. Unlike other issuers, Novo Nordisk maintains solid fundamentals that justify demand for its bonds, placing it among the safest issuers in Europe. Technical Analysis: Consolidation with Bullish Bias Since its all-time highs in June 2024, when it reached €134.14, the company’s stock corrected to a low in August 2025 around €38.09. This Monday, the price showed a technical rebound, closing yesterday at €42 after a week of bullish performance. If the price manages to retake the previous consolidation range, between €53.46 and €61.11, we could anticipate a more significant advance. For now, the stock is near the €42.5 consolidation zone, coinciding with the point of control (POC), a key accumulation and support level. Technical indicators show mixed signals: the RSI is recovering at 45.06%, while the MACD confirms a positive evolution with the histogram in positive territory. However, the moving average crossover does not yet fully support the bullish trend: the price remains around the 50-day moving average, while the 100- and 200-day moving averages are still sloping downward. In terms of scenarios, if the price fails to hold the annual low, we could see a bearish continuation toward €30. Conversely, if the support, which has been tested three times, holds, a clear upward rebound is possible. According to ActivTrades Europe Market Pulse, market sentiment shows a risk-on bias, although the overall situation remains neutral for now, reflecting caution among investors. European Benchmark Novo Nordisk confirms its position as one of the most solid European benchmarks, both in the debt and equity markets. Its structural growth, sustained demand for its treatments, and financial discipline distinguish it from competitors such as Alphabet and Volkswagen. Although technical analysis shows critical support levels that will condition the next price movement, the stock maintains a bullish recovery bias, supported by positive indicators and a market still favorable to controlled risk. Overall, Novo Nordisk combines stability and growth potential, consolidating itself as a defensive and strategic investment for investors seeking exposure to a leading European biopharmaceutical company. ******************************************************************************************* The information provided does not constitute investment research. The material has not been prepared in accordance with the legal requirements designed to promote the independence of investment research and such should be considered a marketing communication. All information has been prepared by ActivTrades ("AT"). The information does not contain a record of AT's prices, or an offer of or solicitation for a transaction in any financial instrument. No representation or warranty is given as to the accuracy or completeness of this information. Any material provided does not have regard to the specific investment objective and financial situation of any person who may receive it. Past performance and forecasting are not a synonym of a reliable indicator of future performance. AT provides an execution-only service. Consequently, any person acting on the information provided does so at their own risk. Political risk is unpredictable. Central bank actions can vary. Platform tools do not guarantee success.
XETR:NOV
by ActivTrades
SAP - could this be the top for the main driver of the DAX ?SAP has the highest market cap in the DAX (315 billion €) and has had an impressive run since the 2022 lows. Price shot up from 80 to 280 in one steep channel. Looking at the chart since the IPO, you can see a five wave structure that might have come to an end at the upper trendline of the channel. The DAX has dropped by 700 points this week and if SAP starts correcting to a conservative 0.764 retracement of this move, we are looking at a drop to 236. The MACD and RSI could certainly use a cooldown.
XETR:SAP
by flightleader78
Updated
11
Pitchfork to see estimate time untill 2100I used a pitchfork based on Elliot impulse and correction waves to get an idea of how steep this bull run might turn out. A verry Rough 100 days until XETR:RHM 2100 is the answer (if it holds). Any daily close below the bottom blue zone is a trend reversal downwards. Take some profits if it gets high up in the top blue zone.
XETR:RHMLong
by TLN_
Updated
11
112233445566778899101011111212131314141515161617171818191920202121222223232424252526262727282829293030313132323333343435353636373738383939404041414242
…999999

Made by humans

Select market data provided by ICE Data Services. Select reference data provided by FactSet. Copyright © 2026 FactSet Research Systems Inc.Copyright © 2026, American Bankers Association. CUSIP Database provided by FactSet Research Systems Inc. All rights reserved. SEC filings and other documents provided by Quartr.© 2026 TradingView, Inc.

More than a product
  • Supercharts
Screeners
  • Stocks
  • ETFs
  • Bonds
  • Crypto coins
  • CEX pairs
  • DEX pairs
  • Pine
Heatmaps
  • Stocks
  • ETFs
  • Crypto coins
Calendars
  • Economic
  • Earnings
  • Dividends
  • IPOs
More products
  • News Flow
  • Portfolios
  • Fundamental Graphs
  • Yield Curves
  • Options
  • Macro Maps
  • Pine Script®
Apps
  • Mobile
  • Desktop
Community
  • Social network
  • Wall of Love
  • Refer a friend
  • House Rules
  • Moderators
Ideas
  • Trading
  • Education
  • Editors' picks
Pine Script
  • Indicators & strategies
  • Wizards
  • Freelancers
  • Paid Spaces
Tools & subscriptions
  • Features
  • Pricing
  • Market data
  • Gift plans
Trading
  • Overview
  • Brokers
  • Brokers comparison
  • The Leap
Special offers
  • CME Group futures
  • Eurex futures
  • US stocks bundle
About company
  • Who we are
  • Space mission
  • Blog
  • Help Center
  • Careers
  • Media kit
Merch
  • TradingView store
  • Tarot cards for traders
  • The C63 TradeTime
Policies & security
  • Terms of Use
  • Disclaimer
  • Privacy Policy
  • Cookies Policy
  • Accessibility Statement
  • Security tips
  • Bug Bounty program
  • Status page
Business solutions
  • Widgets
  • Charting libraries
  • Lightweight Charts™
  • Advanced Charts
  • Trading Platform
Growth opportunities
  • Advertising
  • Brokerage integration
  • Partner program
  • Education program
Community
  • Social network
  • Wall of Love
  • Refer a friend
  • House Rules
  • Moderators
Ideas
  • Trading
  • Education
  • Editors' picks
Pine Script
  • Indicators & strategies
  • Wizards
  • Freelancers
  • Paid Spaces
Business solutions
  • Widgets
  • Charting libraries
  • Lightweight Charts™
  • Advanced Charts
  • Trading Platform
Growth opportunities
  • Advertising
  • Brokerage integration
  • Partner program
  • Education program
Look FirstLook First