Bayer (BAYN): Is the Bottom Finally Here?Since our initial analysis in November, Bayer's stock has experienced a 40% pullback. Despite missing our limit order by 2%, we have decided to enter the market now and plan to make additional purchases if the price drops further.
The stock has held around the 88.2% Fibonacci retracement level. We are currently within the 50-61.8% Fibonacci extension zone for Wave 5, which aligns with our bottom outlook.
Our entry strategy involves making an initial purchase now, acknowledging the recent suppo
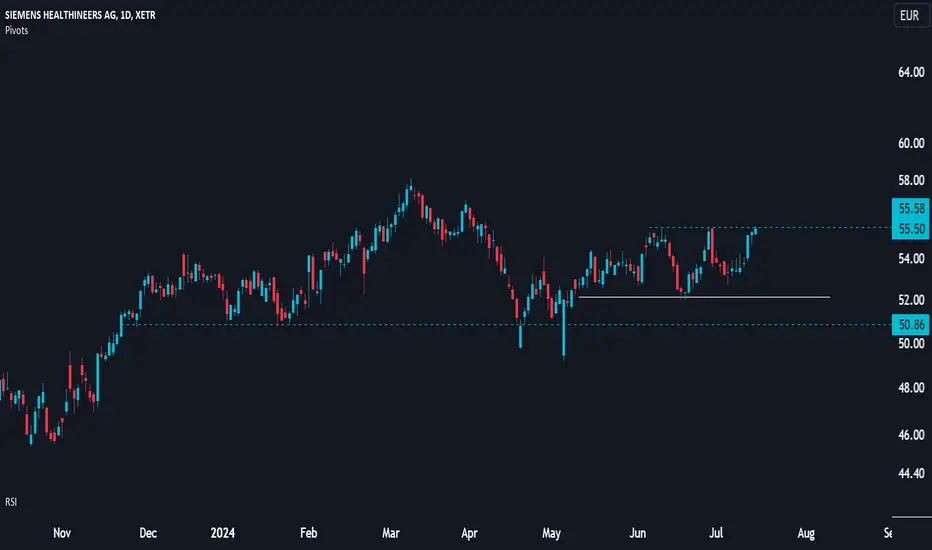
SHLSiemens Healthineers is a German company which provides healthcare services. It was spun off from its parent company Siemens in 2017, which retains a 75% stake. Siemens Healthineers is the parent company for several medical technology companies and is headquartered in Erlangen, Germany.
A name via my screen. An appealing medium term structure.
INFINEON Bullish Momentum --> 40.00 EUR (Buy & Hold < 12 Months)Infineon is undervalued at present and shows upside momentum in the long-term. Stock might follow a negative trajectory in the next weeks but eventually should pick up positive momentum in the second half of 2024. Target price for this trade is somewhere around 40.00 EUR which will be most likely accomplished until the first half of 2025.
PORSCHE - P911 - German Auto IndustryWith current issue on tariffs between EU & China - it will be a daring move to buy and European Car stock. It is hard to predict how those discussions will end given the current shift in the EU political landscape.
DAX broke records but P911 was on a downtrend forever. Profitable, dividend play. If to chose any EU auto stock RACE (Ferrari) STLA and Mercedes would be top of the list along with P911.
Once the trend line breaks, ideal entry would be on the retest. The last extended wick might ha
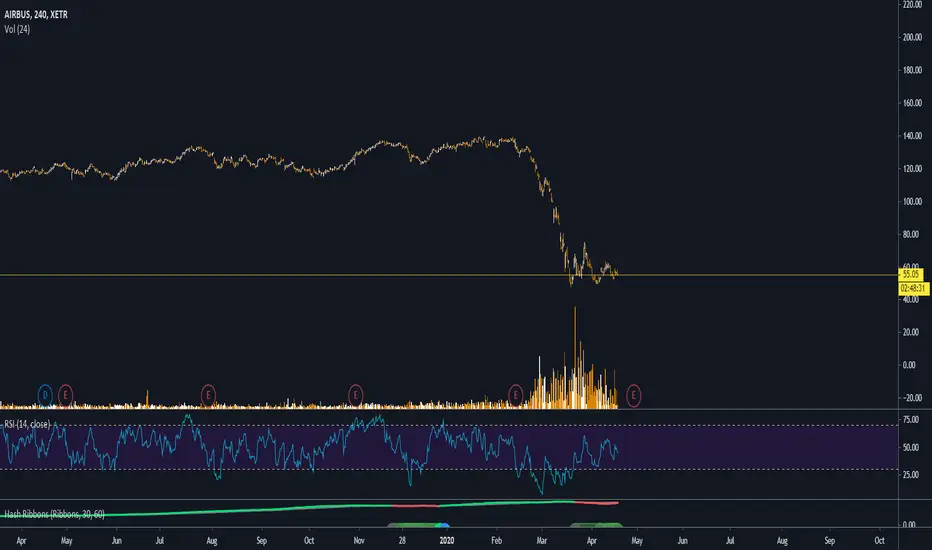
AIRBUS READY FOR TAKEOFF - 65% PROFITAIRBUS (AIR) - 4hr/Frankfurt
Hello and welcome to this update,
this one is about Airbus, which looks GOOD in my opinion.
-All-time high was 140, which we dropped from, which is a 65% drop.
-RSI looking good, bullish divergence confirmed.
-Volume is solid- declining at the bottom (or temporary bottom) is a good sign and could mean, the selloff came to an end (for now).
-Reversal of 65% to 79€ (Resistance from 2nd January 2019) from 48€ is absolutely in range.
-Contesting all-time high in t
Technical Analysis of Mercedes-Benz Group AG (MBG)### Technical Analysis of Mercedes-Benz Group AG (MBG)
#### Overview
The chart shows the daily price movement of Mercedes-Benz Group AG, indicating significant technical levels and trends. Key aspects include the Fibonacci retracement levels, support and resistance lines, and trend lines.
#### Fibonacci Retracement Levels
The Fibonacci retracement levels are drawn from the swing low around the end of 2020 to the swing high in early 2022. The key levels are:
- **0.236 (60.77 EUR)**
- **0.382 (6
Attractive risk/reward in Lufthansa long position. Lufthansa has been struggling with strike, cancelled flights and increased tax by the German government resulting in weak Q1 results. There is support at around 5,6 EUR and even the slightest positive Q2 report by the end of July should result in a bull run lasting until December/Januar.
Deutsche Bank AG (DB): Potential Sell-Off Ahead?Analyzing the Deutsche Bank AG on the German Stock Exchance XETR, we observe a repeating pattern involving two trend channels. In both instances, the trend channels were respected and behaved as expected.
In the first case, the price exited the trend channel and then retested it almost perfectly. In the second instance, the price overshot the trend channel briefly with a wick above but quickly retraced back below it. This overshoot indicates significant weakness, suggesting a potential stronger
Allianz SE to correct 40% in 2024?On the above 12 day chart price action has appreciated 70% since late 2022. The outlook for future growth maybe about to change as the flood waters threaten to submerge the performance of this Munich based institution.
Why the bearish outlook?
1) Price action and RSI support breakouts.
2) Volume is exiting the market following overbought conditions. See 2 week chart below and look left. The Money flow index now informs the outward flow.
3) The rising wedge and breakout confirms. A forecast t
DWS GROUP (DWS): Upswing in Germany's Financial SectorDWS GROUP (DWS): XETR:DWS
Analyzing the relatively young German stock, DWS Group, listed on the Xetra exchange in Germany, we find ourselves in an overarching Wave (3). We start this count at the Corona low of €16.75. Wave (2) concluded at €23.21, and our old high is at €41.88, which also represents the level of Wave (1). Naturally, for Wave (3), we aim to surpass this level. Subordinately, we are also in a Wave 3, and at an even lower level, again in a Wave ((iii)). We're looking to identi
DWS Group (DWS): Potential Trend Continuation from SupportAnalyzing the DWS Group chart on the German stock exchange XETR, our previous assumption was that the top would be found between €40.52 and €42.62. The actual top was at €44.88, which aligns well with our prediction. After this peak, the stock experienced a significant 16% sell-off over three days.
Currently, the stock is trading between the 50% and 61.8% Fibonacci retracement levels, which is a plausible and acceptable range for Wave ((iv)). Additionally, the High-Volume Node Point-of-Control
$NVDA Started Accumulating on May 6NASDAQ:NVDA Started Accumulating on May 6, with our buy alert from our proprietary algorithm momentum indicator. ### Algorithm Momentum Indicator
The Algorithm Momentum Indicator (AMI) is a sophisticated trading tool designed to identify the strength and direction of market trends. By leveraging advanced computational algorithms, the AMI analyzes price movements, trading volume, and historical data to provide traders with precise signals for potential buy or sell opportunities.
#### Key Featu
IS BMW about to correct 60% in September?On the above monthly chart price action has grown 200% since May 2020. A number of reasons now exist to consider a cautious outlook. They include:
1) Bearish divergence. 5 oscillators now print negative divergence with price action as measured over an annual period. This measurement is equivalent to previous corrections.
2) Three rising wedges are shown. The age of each wedge is measured. Statistically a wedge shall breakout 70% into the formation.
September 2007
Age: 2281 days
Breakout: 1581